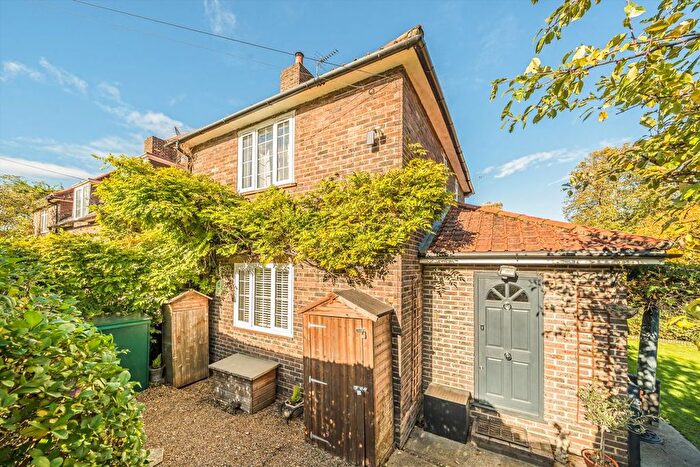
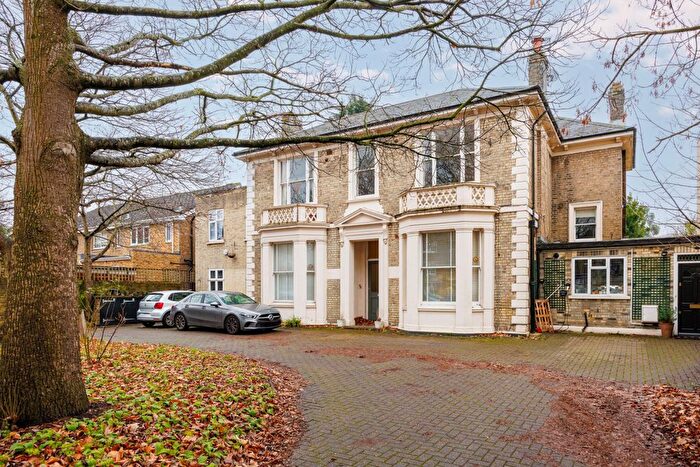
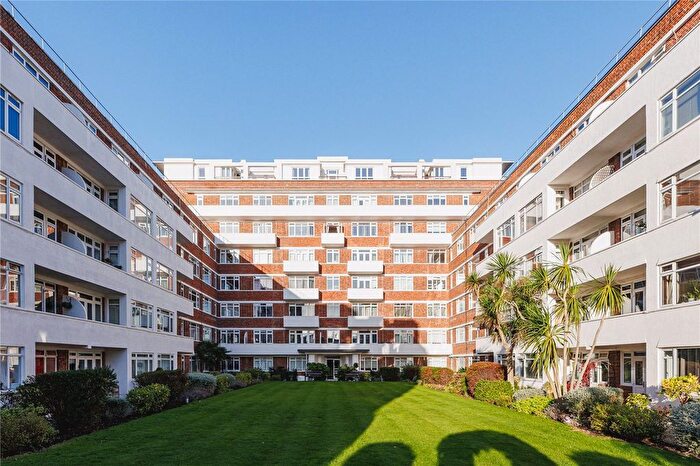
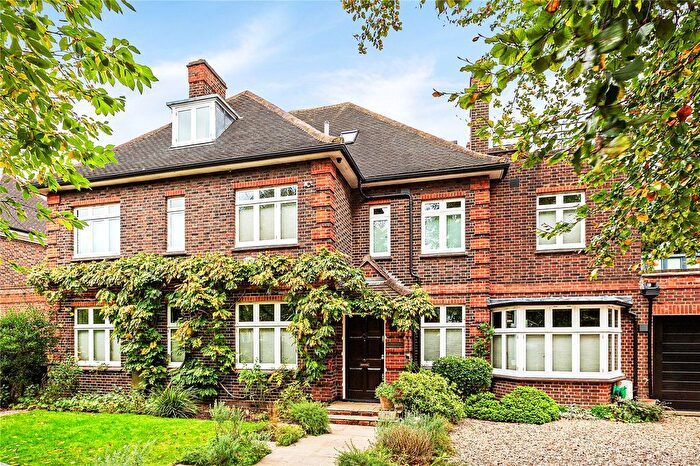
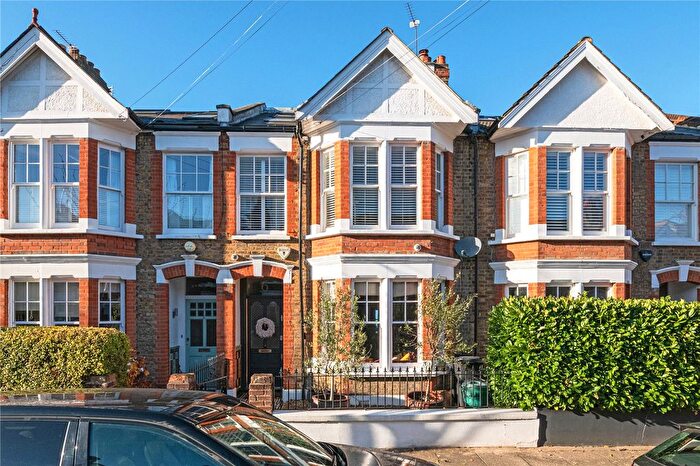
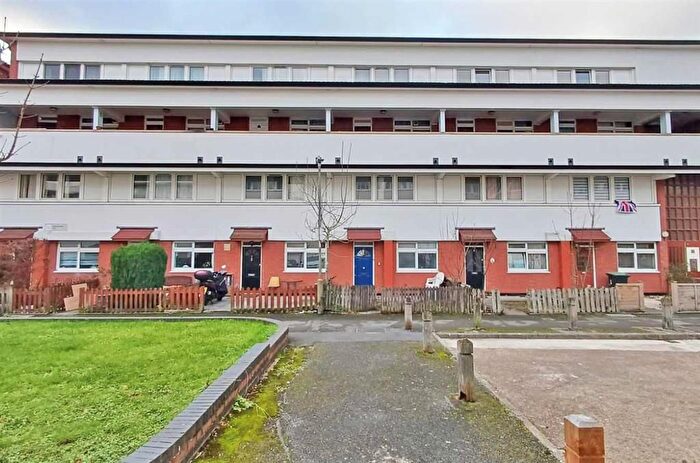
Houses for sale & to rent in West Putney, London
House Prices in West Putney
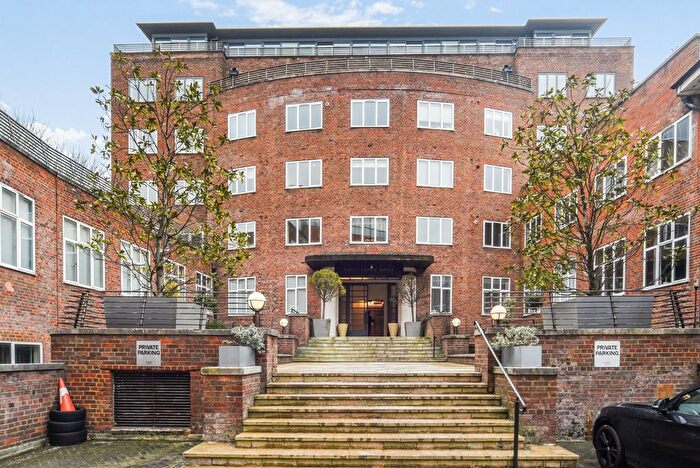
Properties in this part of West Putney within London have an average house price of £799,154.00 and had 740 Property Transactions within the last 3 years¹. This area has 6,199 households² , where the most expensive property was sold for £5,950,000.00.
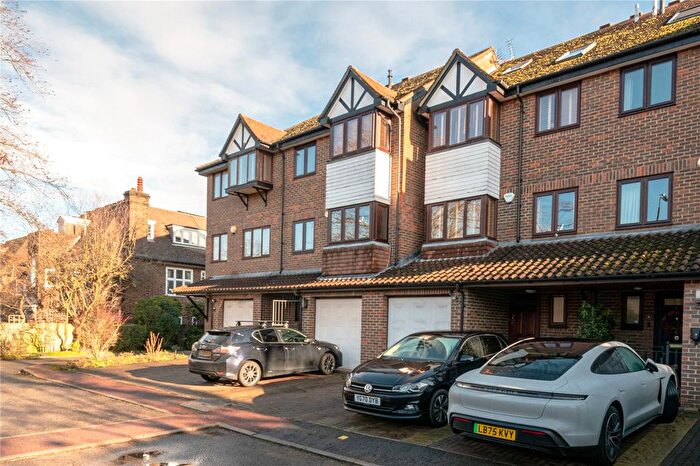
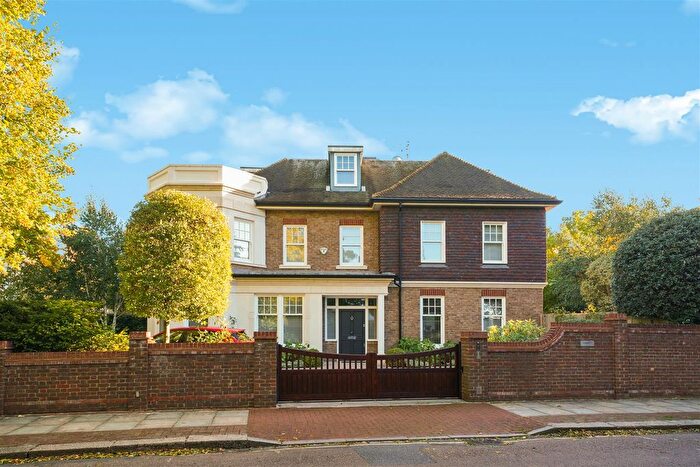
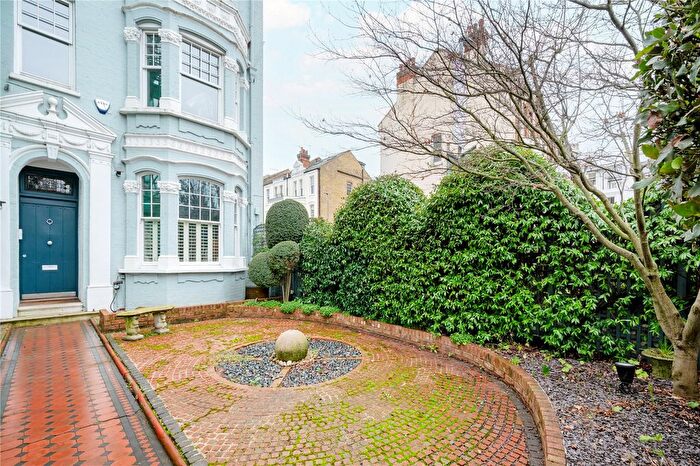
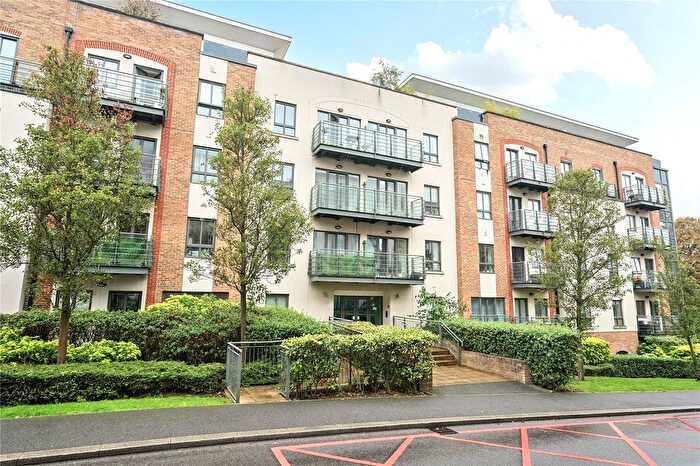
Properties for sale in West Putney
Roads and Postcodes in West Putney
Navigate through our locations to find the location of your next house in West Putney, London for sale or to rent.
Transport near West Putney
-
Barnes Station
-
Putney Station
-
East Putney Station
-
Putney Bridge Station
-
Barnes Bridge Station
-
Southfields Station
-
Mortlake Station
-
Parsons Green Station
-
Wandsworth Town Station
-
Chiswick Station
- FAQ
- Price Paid By Year
- Property Type Price
Frequently asked questions about West Putney
What is the average price for a property for sale in West Putney?
The average price for a property for sale in West Putney is £799,154. This amount is 3% lower than the average price in London. There are 2,298 property listings for sale in West Putney.
What streets have the most expensive properties for sale in West Putney?
The streets with the most expensive properties for sale in West Putney are Bramcote Road at an average of £4,725,000, Dealtry Road at an average of £2,875,000 and Hazlewell Road at an average of £2,833,433.
What streets have the most affordable properties for sale in West Putney?
The streets with the most affordable properties for sale in West Putney are Woodmill Close at an average of £320,250, Toland Square at an average of £334,483 and Innes Gardens at an average of £339,029.
Which train stations are available in or near West Putney?
Some of the train stations available in or near West Putney are Barnes, Putney and Barnes Bridge.
Which tube stations are available in or near West Putney?
Some of the tube stations available in or near West Putney are East Putney, Putney Bridge and Southfields.
Property Price Paid in West Putney by Year
The average sold property price by year was:
| Year | Average Sold Price | Price Change |
Sold Properties
|
|---|---|---|---|
| 2025 | £738,648 | -16% |
144 Properties |
| 2024 | £860,319 | 8% |
204 Properties |
| 2023 | £790,369 | 0,2% |
174 Properties |
| 2022 | £788,895 | -4% |
218 Properties |
| 2021 | £823,929 | 8% |
272 Properties |
| 2020 | £759,307 | -4% |
176 Properties |
| 2019 | £792,925 | 2% |
168 Properties |
| 2018 | £773,948 | 12% |
198 Properties |
| 2017 | £682,409 | -14% |
232 Properties |
| 2016 | £776,867 | -2% |
311 Properties |
| 2015 | £792,870 | 10% |
230 Properties |
| 2014 | £715,744 | 8% |
313 Properties |
| 2013 | £661,787 | 9% |
344 Properties |
| 2012 | £605,311 | 11% |
254 Properties |
| 2011 | £537,707 | -0,2% |
265 Properties |
| 2010 | £538,934 | 11% |
246 Properties |
| 2009 | £479,205 | -6% |
208 Properties |
| 2008 | £508,141 | 8% |
151 Properties |
| 2007 | £467,995 | 6% |
304 Properties |
| 2006 | £440,019 | 14% |
363 Properties |
| 2005 | £377,666 | 6% |
308 Properties |
| 2004 | £353,450 | 15% |
305 Properties |
| 2003 | £298,819 | -16% |
302 Properties |
| 2002 | £346,119 | 18% |
350 Properties |
| 2001 | £282,205 | 12% |
321 Properties |
| 2000 | £248,710 | 7% |
300 Properties |
| 1999 | £231,408 | 23% |
333 Properties |
| 1998 | £178,934 | 17% |
298 Properties |
| 1997 | £147,708 | -6% |
339 Properties |
| 1996 | £155,952 | -7% |
301 Properties |
| 1995 | £167,447 | - |
238 Properties |
Property Price per Property Type in West Putney
Here you can find historic sold price data in order to help with your property search.
The average Property Paid Price for specific property types in the last three years are:
| Property Type | Average Sold Price | Sold Properties |
|---|---|---|
| Flat | £491,393.00 | 458 Flats |
| Semi Detached House | £1,809,082.00 | 50 Semi Detached Houses |
| Detached House | £3,103,631.00 | 33 Detached Houses |
| Terraced House | £871,567.00 | 199 Terraced Houses |

