
Houses for sale & to rent in Thamesfield, London
House Prices in Thamesfield
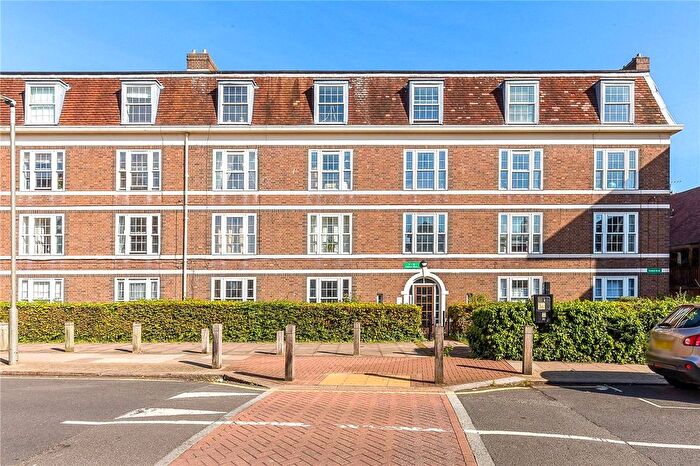
Properties in this part of Thamesfield within London have an average house price of £935,963.00 and had 1076 Property Transactions within the last 3 years¹. This area has 6,562 households² , where the most expensive property was sold for £4,850,000.00.
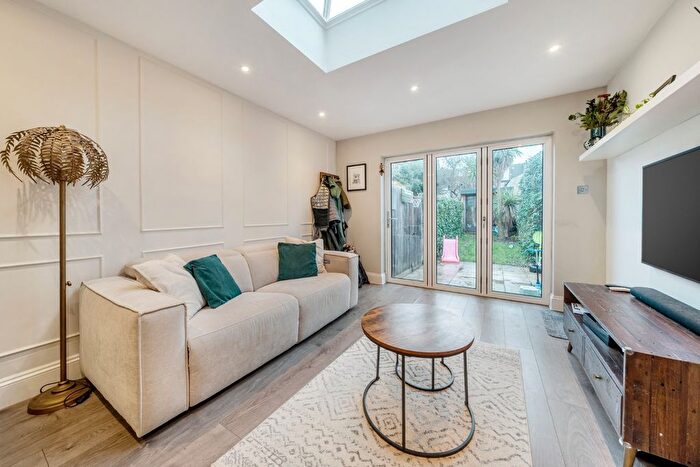
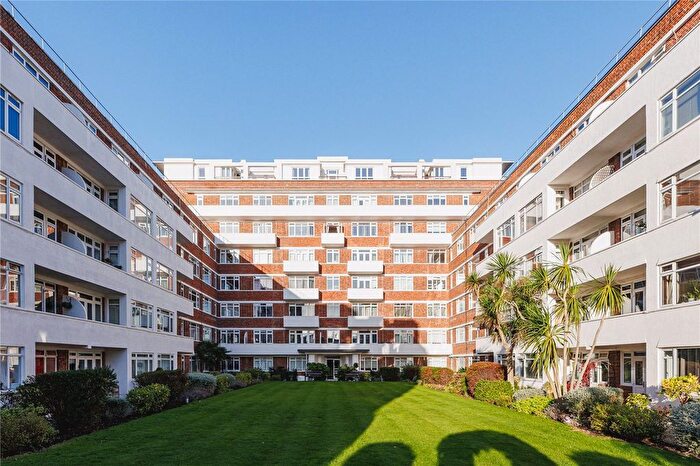
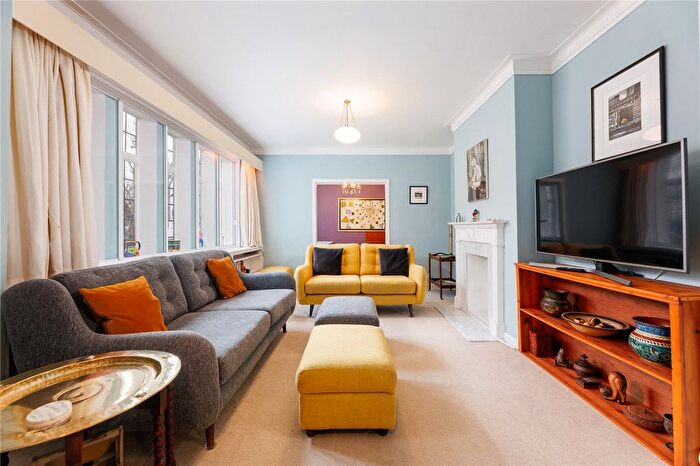
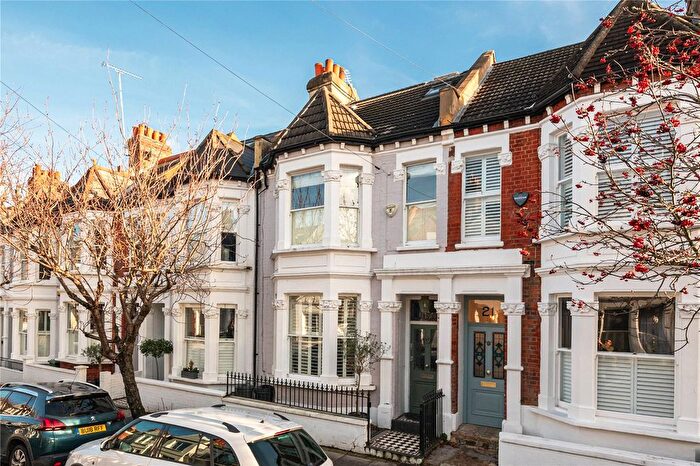
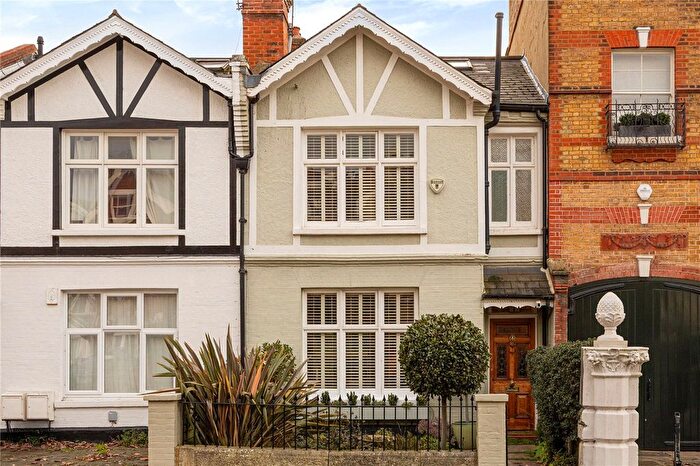
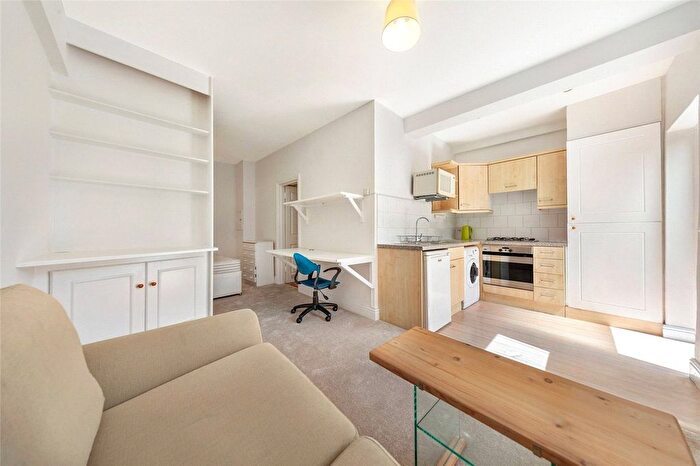
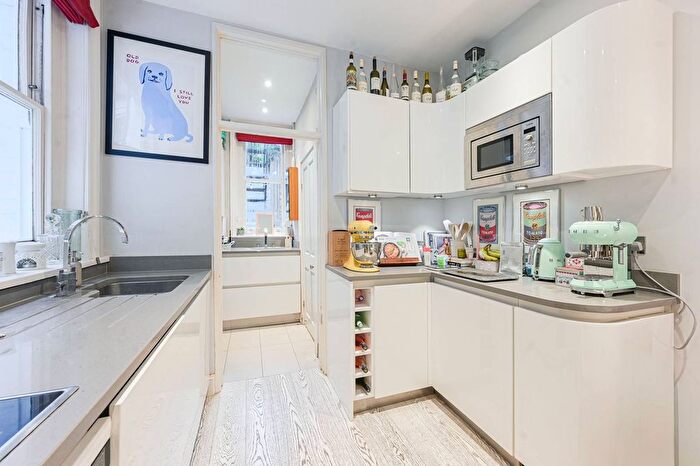
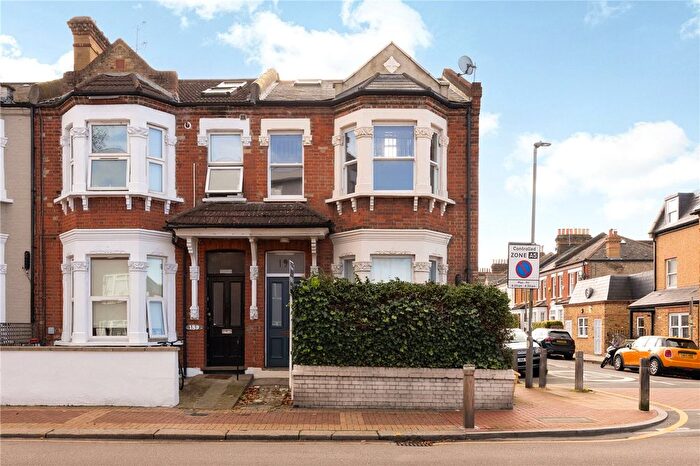
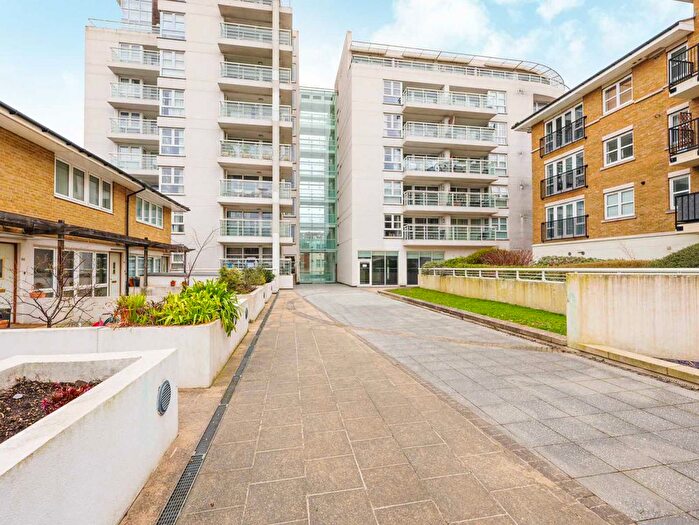
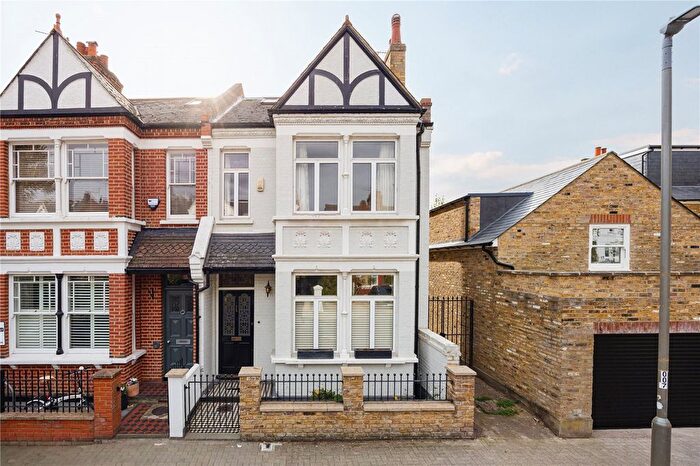
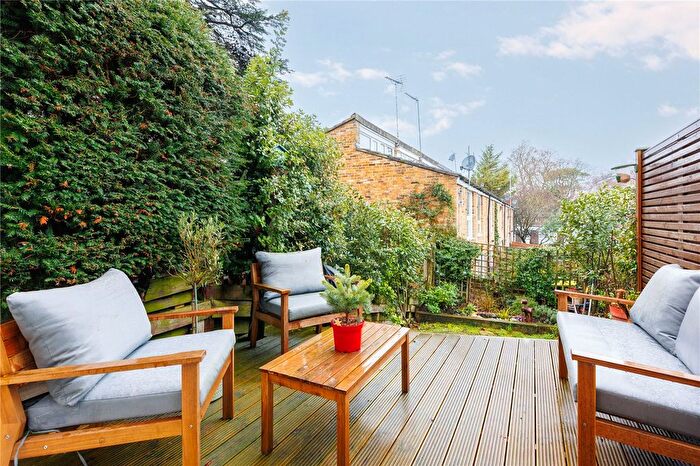
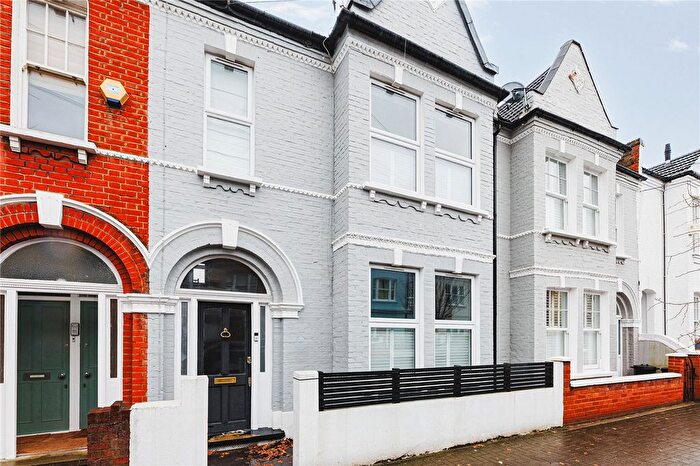
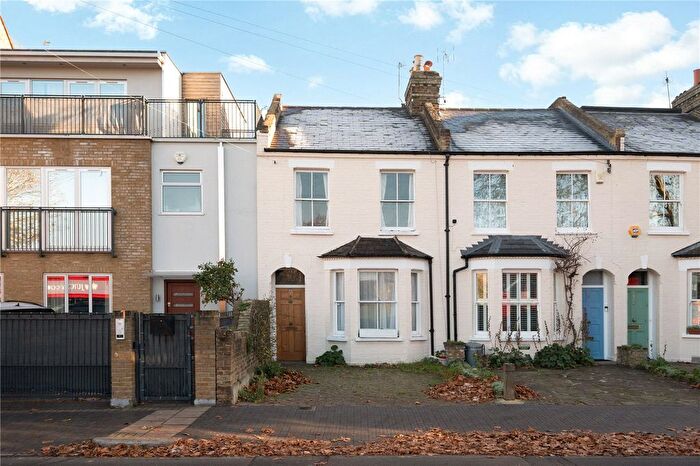
Properties for sale in Thamesfield
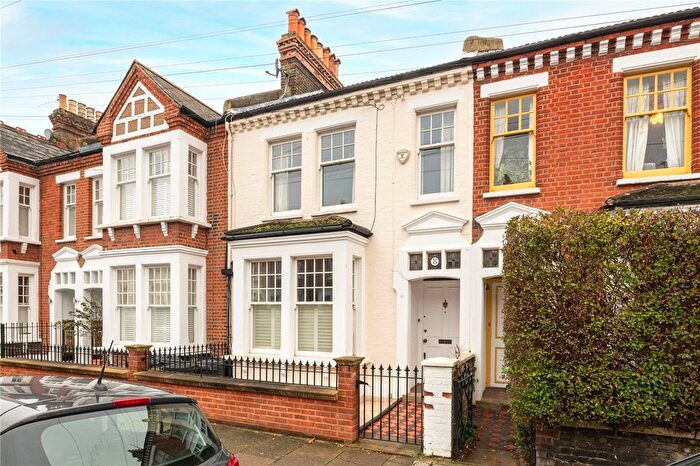
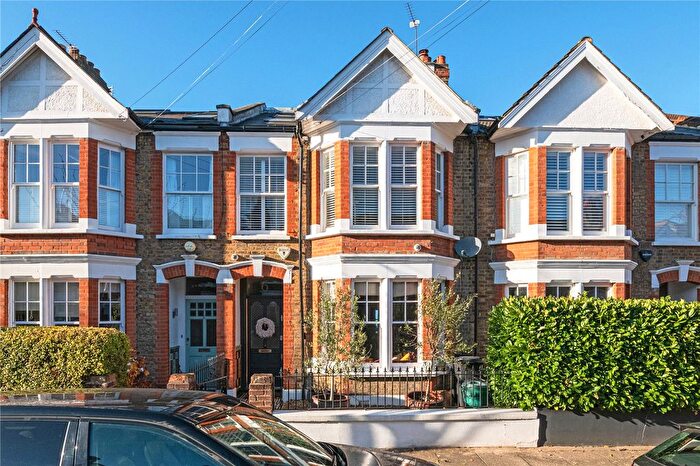
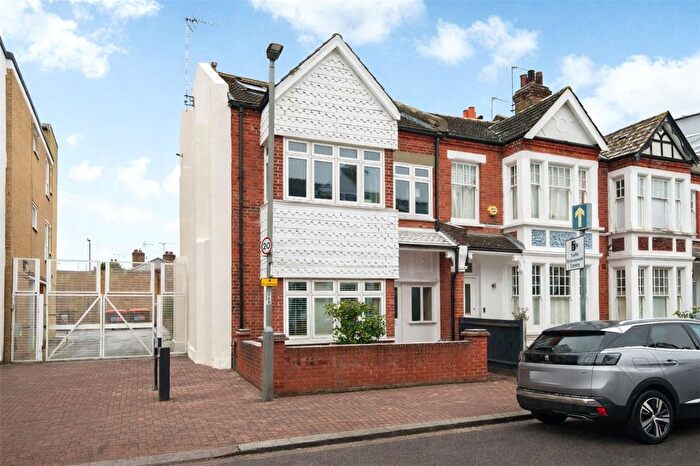
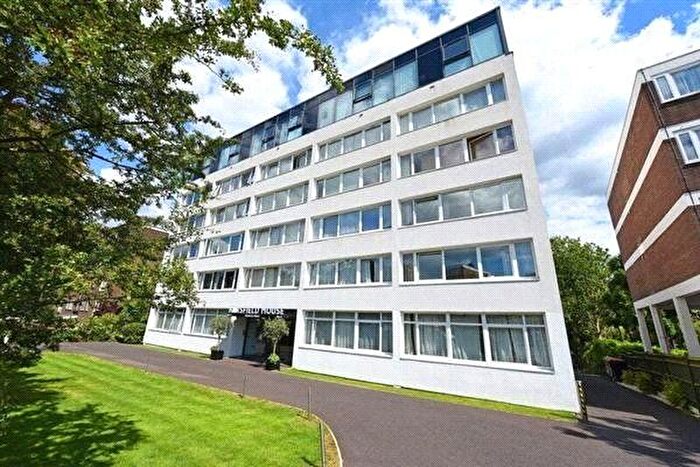
![]()
If you are looking to sell your house, let it out, or receive a property valuation, an expert can help you.
Click the button below to get started.
Roads and Postcodes in Thamesfield
Navigate through our locations to find the location of your next house in Thamesfield, London for sale or to rent.
Transport near Thamesfield
-
 Putney Station
 -
 Putney Bridge Station
 -
East Putney Station
-
Parsons Green Station
-
Barnes Station
-
Wandsworth Town Station
-
Fulham Broadway Station
-
Southfields Station
-
 Imperial Wharf Station
 -
Barnes Bridge Station
- FAQ
- Price Paid By Year
- Property Type Price
Frequently asked questions about Thamesfield
What is the average price for a property for sale in Thamesfield?
The average price for a property for sale in Thamesfield is £935,963. This amount is 14% higher than the average price in London. There are 4,612 property listings for sale in Thamesfield.
What streets have the most expensive properties for sale in Thamesfield?
The streets with the most expensive properties for sale in Thamesfield are Lower Common South at an average of £3,437,500, Charlwood Road at an average of £2,207,500 and Ruvigny Gardens at an average of £1,834,166.
What streets have the most affordable properties for sale in Thamesfield?
The streets with the most affordable properties for sale in Thamesfield are Enterprise Way at an average of £344,598, Horne Way at an average of £366,028 and The Platt at an average of £425,423.
Which train stations are available in or near Thamesfield?
Some of the train stations available in or near Thamesfield are Putney, Barnes and Wandsworth Town.
Which tube stations are available in or near Thamesfield?
Some of the tube stations available in or near Thamesfield are Putney Bridge, East Putney and Parsons Green.
Property Price Paid in Thamesfield by Year
The average sold property price by year was:
| Year | Average Sold Price | Price Change |
Sold Properties
|
|---|---|---|---|
| 2025 | £863,467 | 1% |
184 Properties |
| 2024 | £859,003 | -17% |
308 Properties |
| 2023 | £1,003,142 | 1% |
266 Properties |
| 2022 | £996,256 | 5% |
318 Properties |
| 2021 | £950,442 | 7% |
409 Properties |
| 2020 | £880,175 | 7% |
277 Properties |
| 2019 | £816,149 | -6% |
317 Properties |
| 2018 | £863,500 | -2% |
240 Properties |
| 2017 | £883,004 | 2% |
264 Properties |
| 2016 | £864,175 | 5% |
349 Properties |
| 2015 | £823,933 | -6% |
336 Properties |
| 2014 | £876,474 | 23% |
411 Properties |
| 2013 | £675,344 | 7% |
504 Properties |
| 2012 | £626,871 | -6% |
313 Properties |
| 2011 | £666,039 | 6% |
309 Properties |
| 2010 | £625,586 | 8% |
301 Properties |
| 2009 | £575,587 | -7% |
267 Properties |
| 2008 | £613,787 | 8% |
196 Properties |
| 2007 | £564,441 | 10% |
505 Properties |
| 2006 | £509,239 | 11% |
611 Properties |
| 2005 | £450,990 | 6% |
455 Properties |
| 2004 | £426,032 | 6% |
596 Properties |
| 2003 | £400,170 | -1% |
422 Properties |
| 2002 | £402,574 | 12% |
426 Properties |
| 2001 | £352,832 | 15% |
449 Properties |
| 2000 | £300,516 | 16% |
361 Properties |
| 1999 | £252,329 | 14% |
527 Properties |
| 1998 | £217,200 | 14% |
391 Properties |
| 1997 | £185,937 | 14% |
560 Properties |
| 1996 | £160,162 | 9% |
487 Properties |
| 1995 | £146,483 | - |
382 Properties |
Property Price per Property Type in Thamesfield
Here you can find historic sold price data in order to help with your property search.
The average Property Paid Price for specific property types in the last three years are:
| Property Type | Average Sold Price | Sold Properties |
|---|---|---|
| Flat | £640,527.00 | 696 Flats |
| Semi Detached House | £1,886,821.00 | 66 Semi Detached Houses |
| Detached House | £2,812,641.00 | 8 Detached Houses |
| Terraced House | £1,353,784.00 | 306 Terraced Houses |