
Houses for sale & to rent in WA13 9SE, Mill Lane, Lymm, Lymm
House Prices in WA13 9SE, Mill Lane, Lymm
Properties in WA13 9SE have no sales history available within the last 3 years. WA13 9SE is a postcode in Mill Lane located in Lymm, an area in Lymm, Warrington, with 2 households².
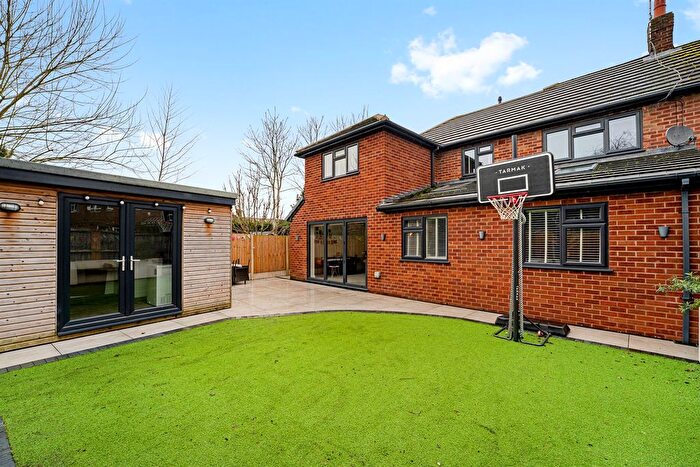
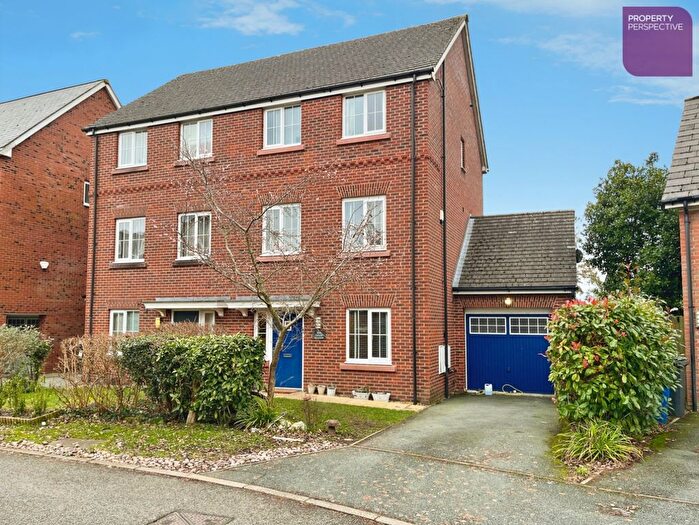
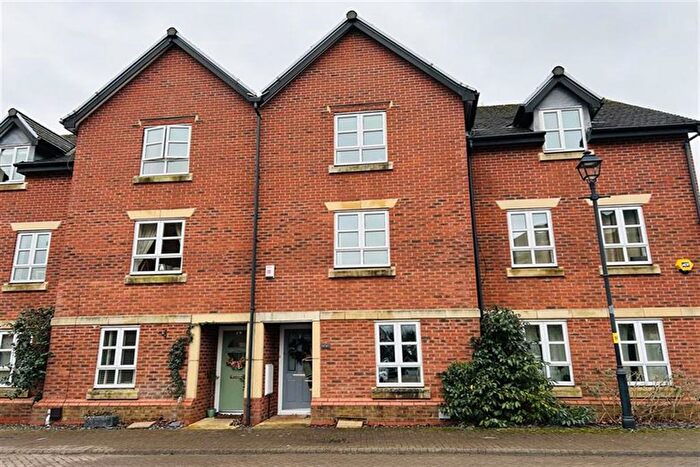
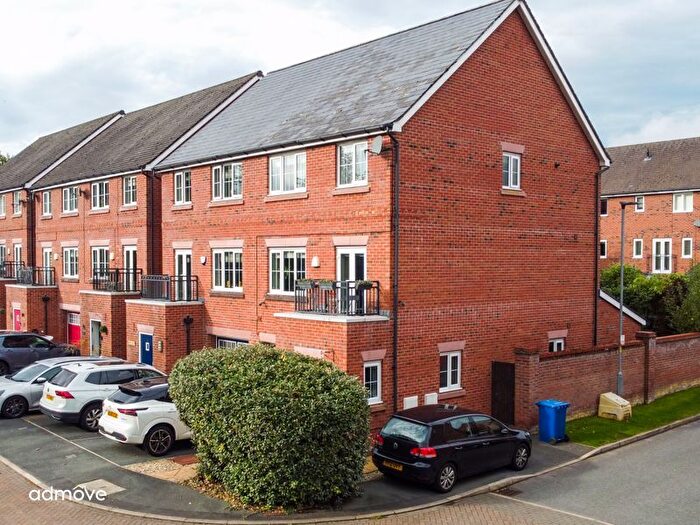
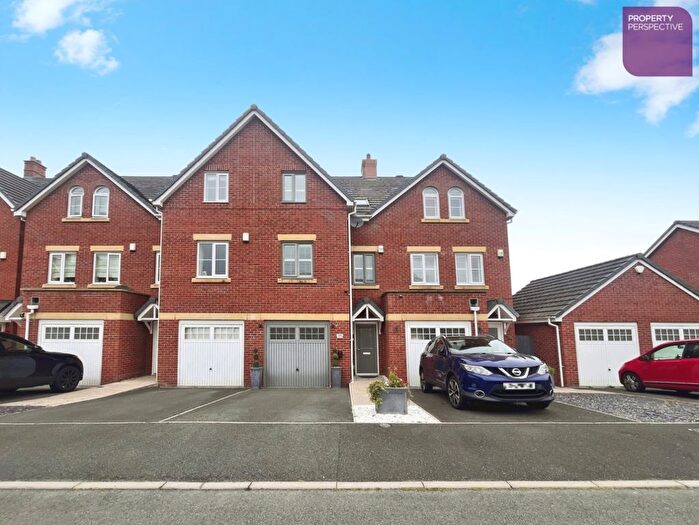
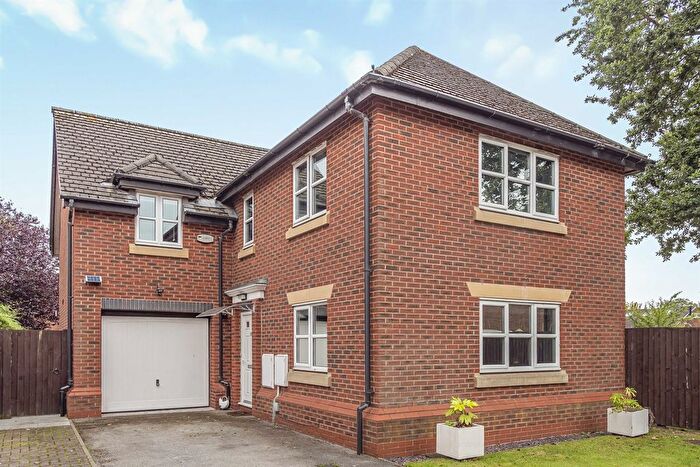
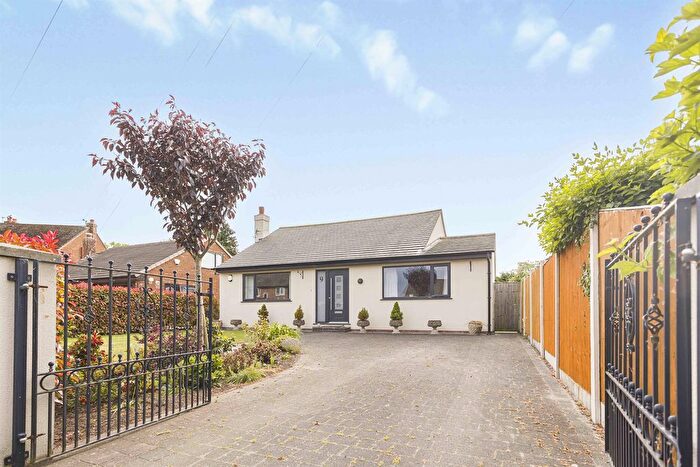
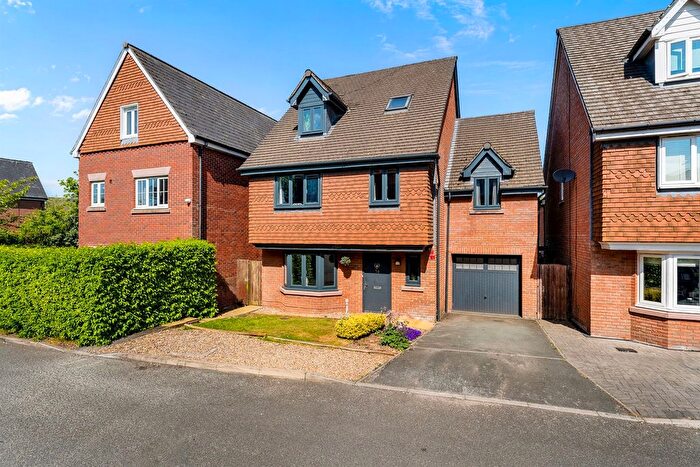
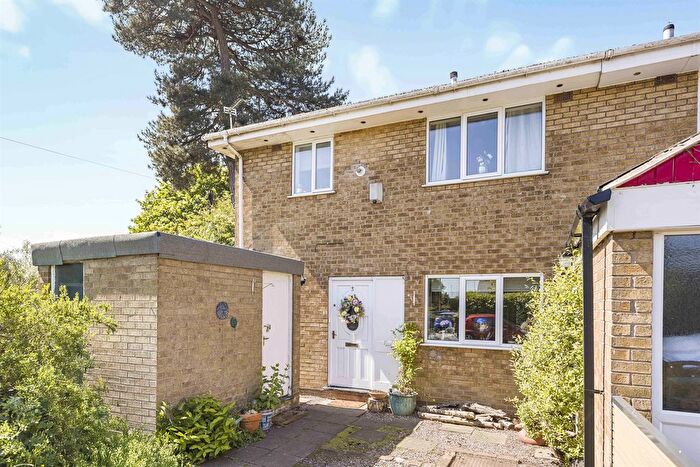
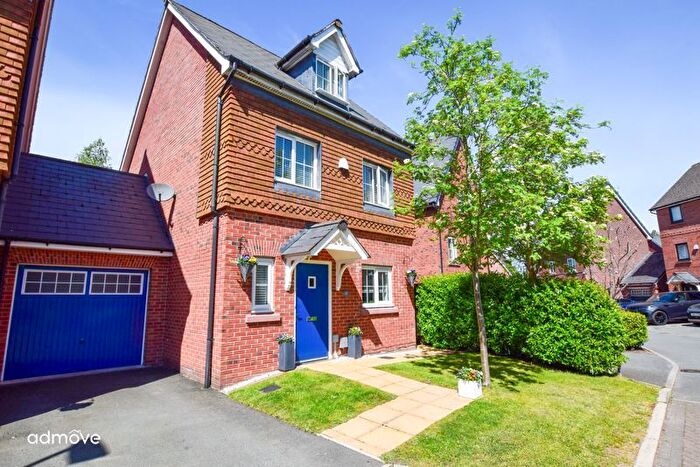
Properties for sale near WA13 9SE, Mill Lane
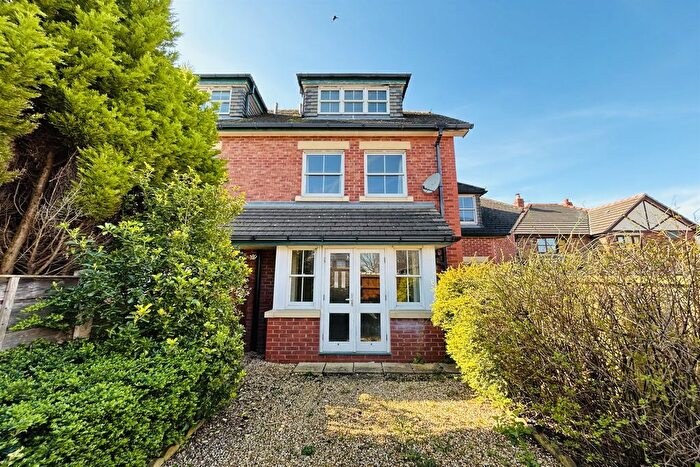
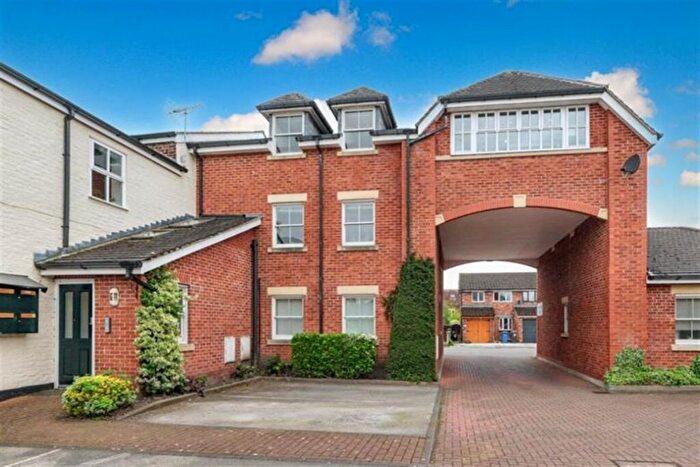
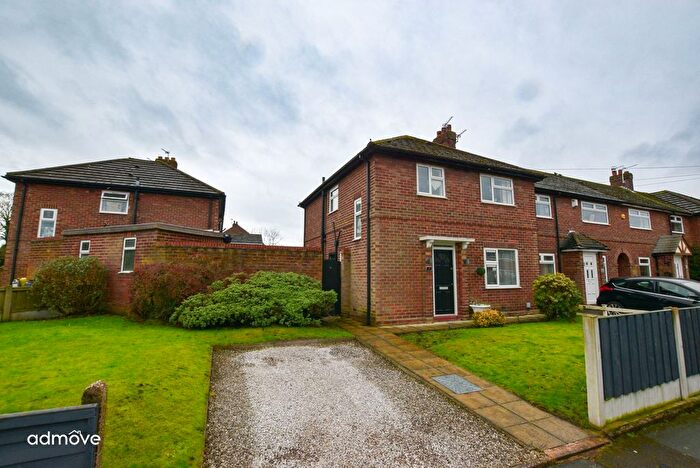
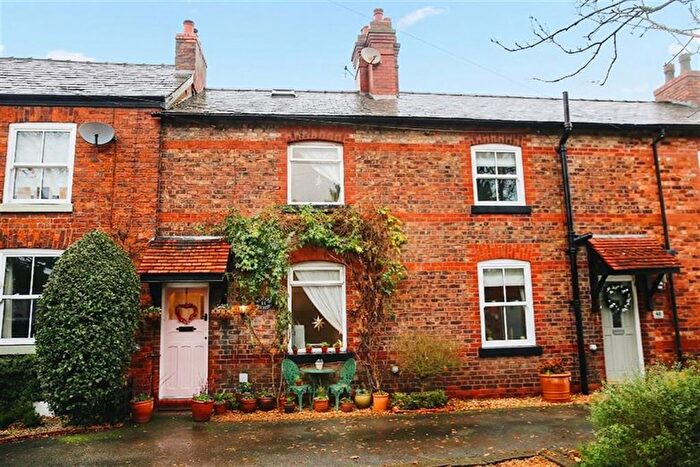
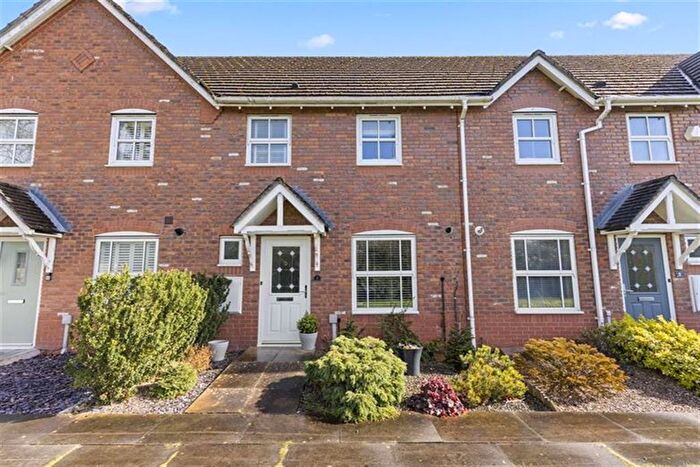
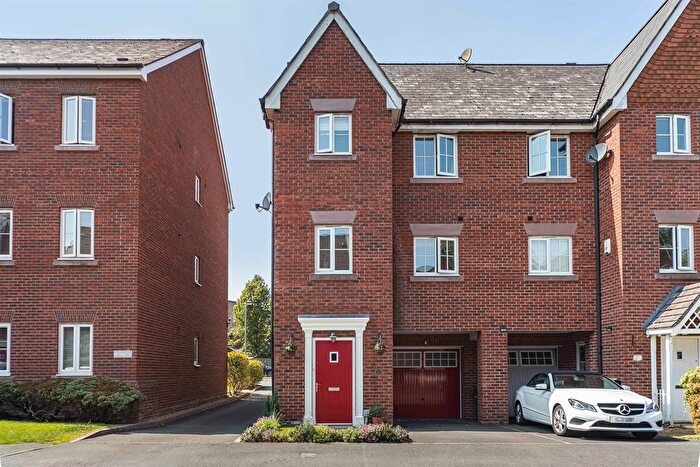
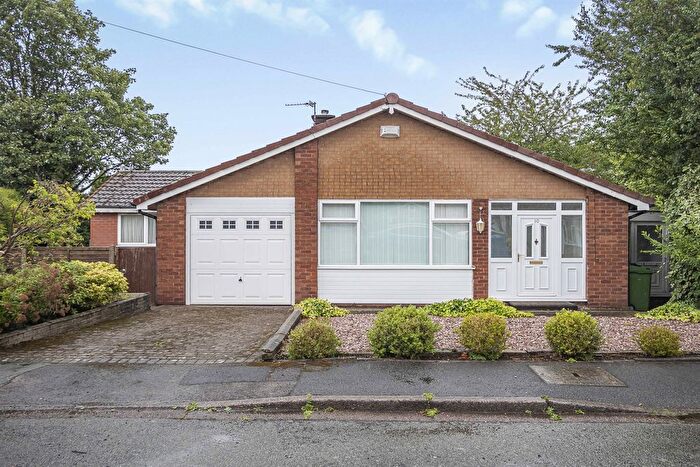
Previously listed properties near WA13 9SE, Mill Lane
![]()
If you are looking to sell your house, let it out, or receive a property valuation, an expert can help you.
Click the button below to get started.


Price Paid in Mill Lane, WA13 9SE, Lymm
20A Mill Lane, WA13 9SE, Lymm Lymm
Property 20A has been sold 2 times. The last time it was sold was in 07/12/2012 and the sold price was £390,000.00.
This is a Semi Detached House which was sold as a freehold in 07/12/2012
| Date | Price | Property Type | Tenure | Classification |
|---|---|---|---|---|
| 07/12/2012 | £390,000.00 | Semi Detached House | freehold | Established Building |
| 30/07/1998 | £140,000.00 | Semi Detached House | freehold | Established Building |
20 Mill Lane, WA13 9SE, Lymm Lymm
Property 20 has been sold 3 times. The last time it was sold was in 13/07/2001 and the sold price was £299,500.00.
This is a Semi Detached House which was sold as a freehold in 13/07/2001
| Date | Price | Property Type | Tenure | Classification |
|---|---|---|---|---|
| 13/07/2001 | £299,500.00 | Semi Detached House | freehold | Established Building |
| 28/05/1999 | £227,000.00 | Semi Detached House | freehold | Established Building |
| 02/10/1997 | £180,000.00 | Semi Detached House | freehold | Established Building |
Postcodes in Mill Lane, Lymm
Navigate through other locations in Mill Lane, Lymm, Lymm to see more property listings for sale or to rent.
Transport near WA13 9SE, Mill Lane
-
 Glazebrook Station
 -
Irlam Station
-
Birchwood Station
-
Altrincham Station
-
Hale Station
-
Navigation Road Station
-
Flixton Station
-
Padgate Station
House price paid reports for WA13 9SE, Mill Lane
Click on the buttons below to see price paid reports by year or property price:
- Price Paid By Year
Property Price Paid in WA13 9SE, Mill Lane by Year
The average sold property price by year was:
| Year | Average Sold Price | Price Change |
Sold Properties
|
|---|---|---|---|
| 2012 | £390,000 | 23% |
1 Property |
| 2001 | £299,500 | 24% |
1 Property |
| 1999 | £227,000 | 38% |
1 Property |
| 1998 | £140,000 | -29% |
1 Property |
| 1997 | £180,000 | - |
1 Property |