
Houses for sale in Warrington, England
House Prices in Warrington
Properties in Warrington have
an average house price of
£281k
and had 8,961 Property Transactions
within the last 3 years.¹
Warrington is a location in
England with
90,381 households², where the most expensive property was sold for £26.33M.
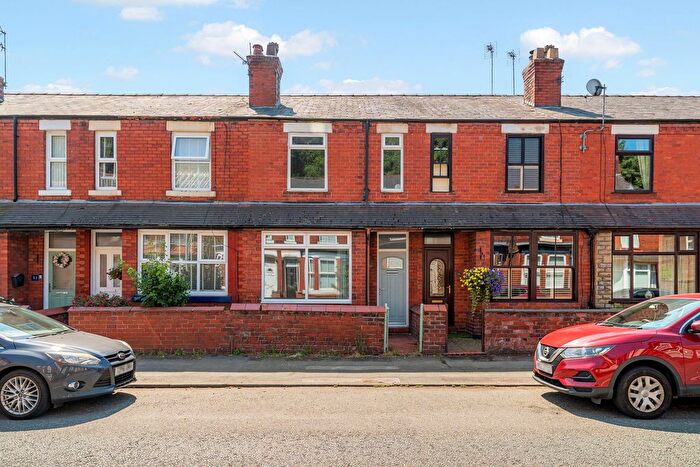
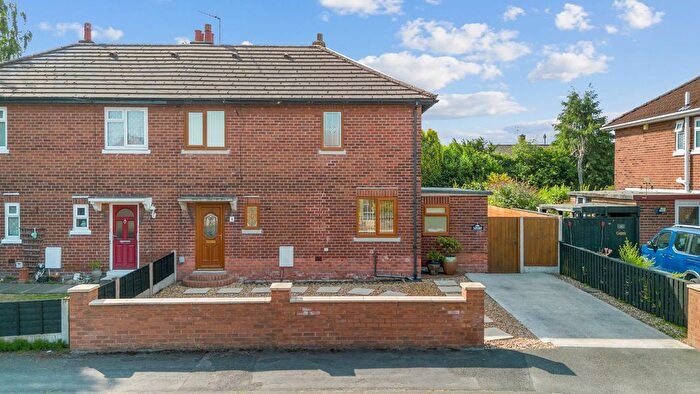
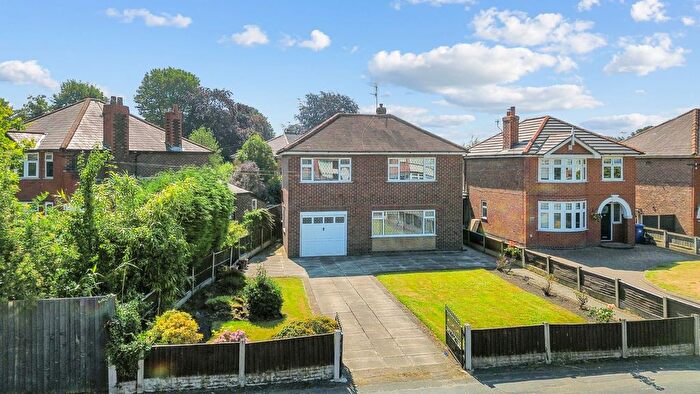
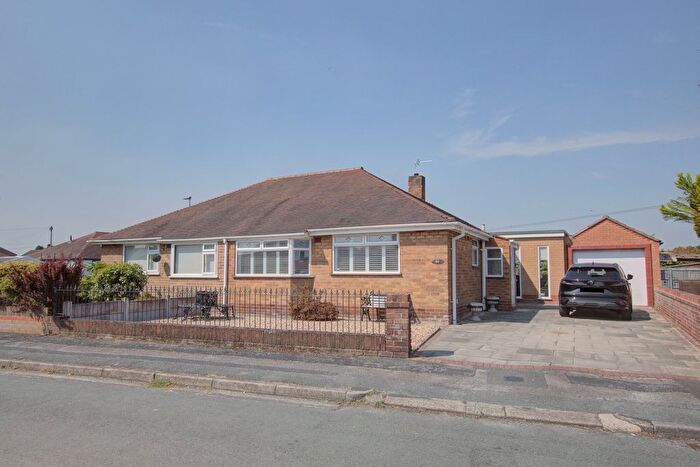
Properties for sale in Warrington
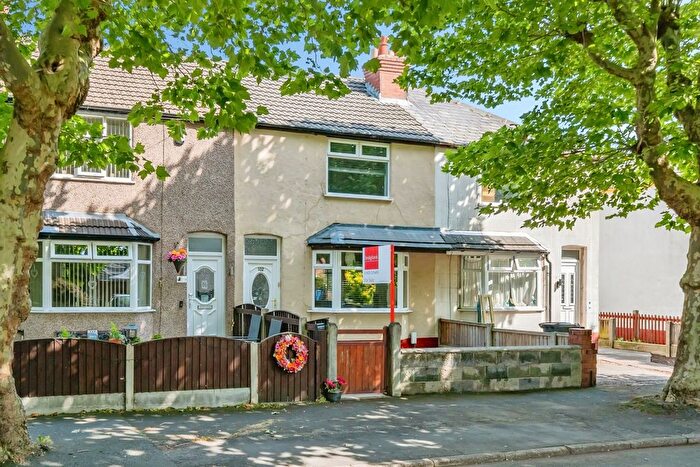
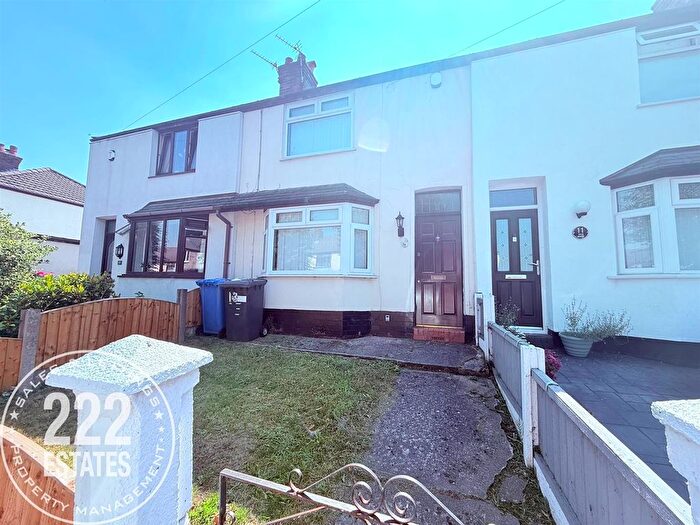
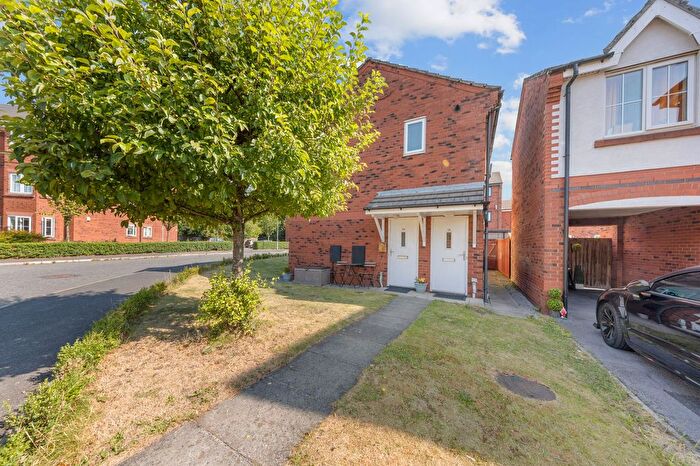
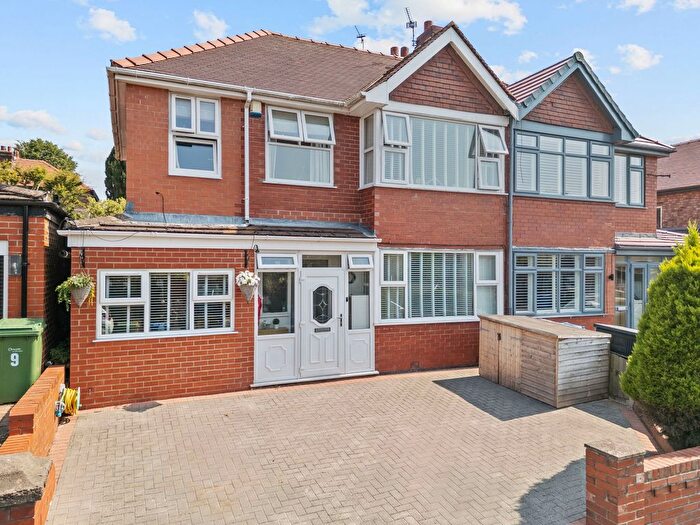
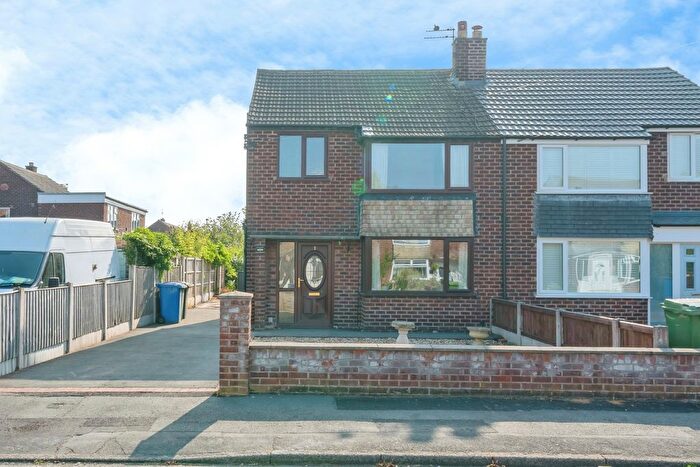
![]()
If you are looking to sell your house, let it out, or receive a property valuation, an expert can help you.
Click the button below to get started.
Towns in Warrington
Navigate through our locations to find the location of your next house in Warrington, England for sale or to rent.
Property price trends in Warrington
According to the latest Land Registry data, the average home in Warrington sold for £285,333 in 2026. That figure comes from a substantial record of 107,903 sales logged over the past 31 years.
Prices have moved up over the last three years. Compared with 2023, when the typical sale came in around £273,546, that's a rise of roughly 4.3%.
Looking back five years, average prices are up about 8.4% since 2021, a gain of around £22,169 in cash terms.
Zoom out to the past decade for the fuller picture. Back in 2016, homes here averaged £201,041, so the typical sold price has climbed about 41.9% since then, roughly 3.6% a year. Stretch the view to fifteen years and that annual pace eases back to about 3%.
Frequently asked questions about Warrington
What is the average price for a property for sale in Warrington?
The average price for a property for sale in Warrington is £281,067. This amount is 22% lower than the average price in England. There are more than 10,000 property listings for sale in Warrington.
What locations have the most expensive properties for sale in Warrington?
The locations with the most expensive properties for sale in Warrington are Lymm at an average of £413,521 and Warrington at an average of £266,616.
What locations have the most affordable properties for sale in Warrington?
The location with the most affordable properties for sale in Warrington is St Helens at an average of £150,000.
Which train stations are available in or near Warrington?
Some of the train stations available in or near Warrington are Padgate, Warrington Central and Warrington Bank Quay.
Property Price Paid in Warrington by Year
The average sold property price by year was:
| Year | Average Sold Price | Price Change |
Sold Properties
|
|---|---|---|---|
| 2026 | £285,333 | -4% |
547 Properties |
| 2025 | £295,574 | 8% |
3,024 Properties |
| 2024 | £271,532 | -1% |
2,813 Properties |
| 2023 | £273,546 | 2% |
2,577 Properties |
| 2022 | £267,541 | 2% |
3,329 Properties |
| 2021 | £263,164 | 9% |
4,128 Properties |
| 2020 | £239,153 | 7% |
3,135 Properties |
| 2019 | £223,474 | 4% |
3,439 Properties |
| 2018 | £215,617 | 4% |
3,286 Properties |
| 2017 | £207,004 | 3% |
3,490 Properties |
Property Price per Property Type in Warrington
Here you can find historic sold price data in order to help with your property search.
The average Property Paid Price for specific property types in the last three years are:
| Property Type | Average Sold Price | Sold Properties |
|---|---|---|
| Semi Detached House | £269,156.00 | 3,503 Semi Detached Houses |
| Terraced House | £193,390.00 | 2,550 Terraced Houses |
| Detached House | £485,218.00 | 1,959 Detached Houses |
| Flat | £139,196.00 | 949 Flats |
Transport in Warrington
Please see below transportation links in this area:
