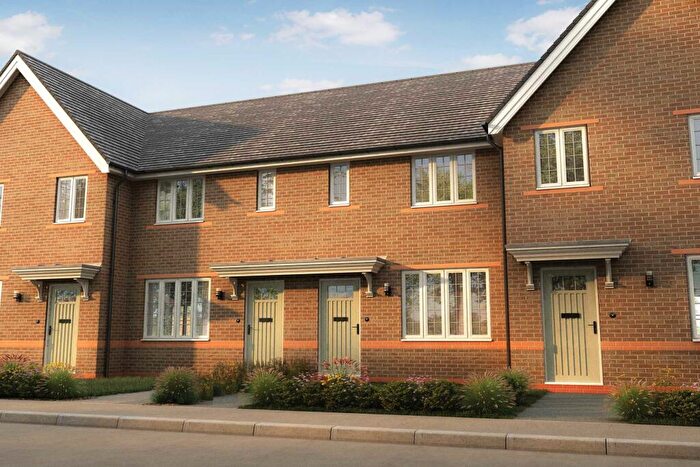
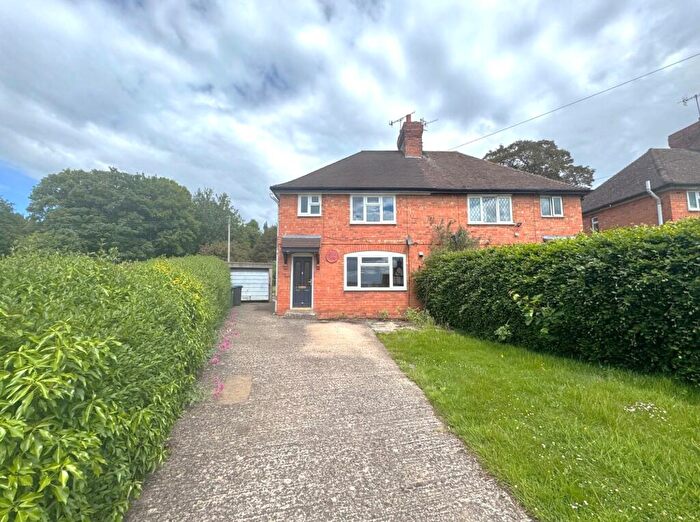
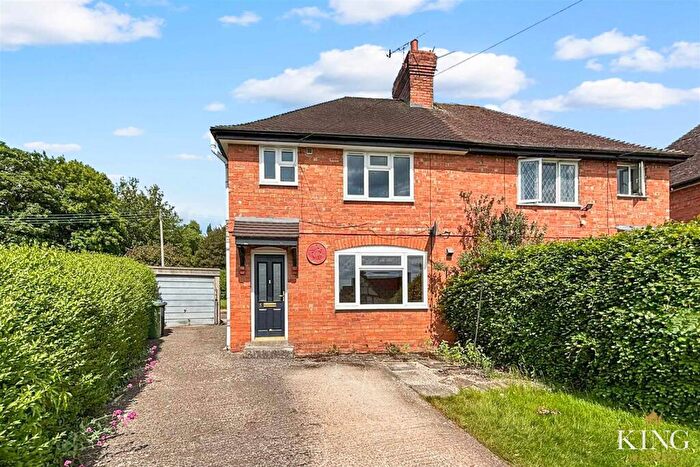
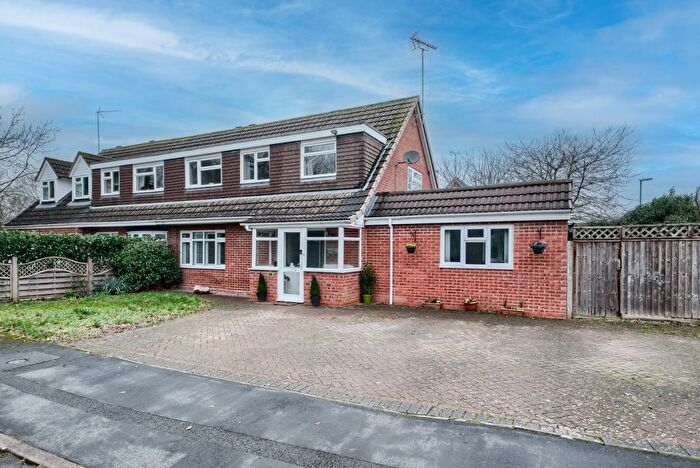
Houses for sale & to rent in Kinwarton, Alcester
House Prices in Kinwarton
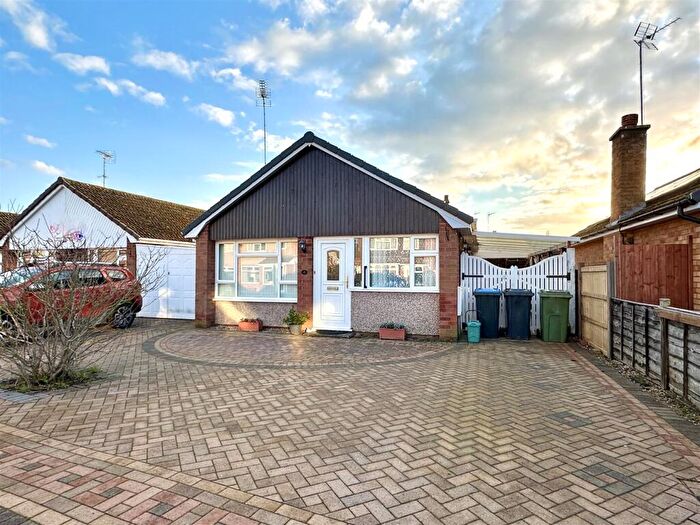
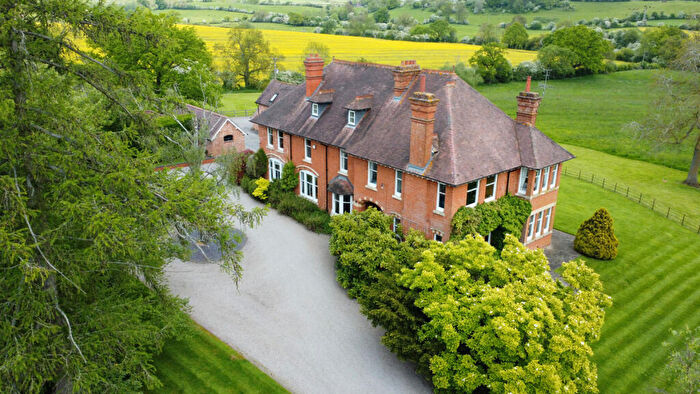
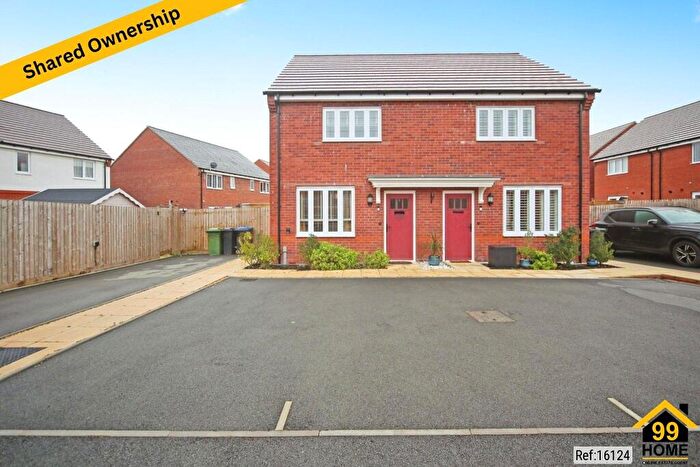
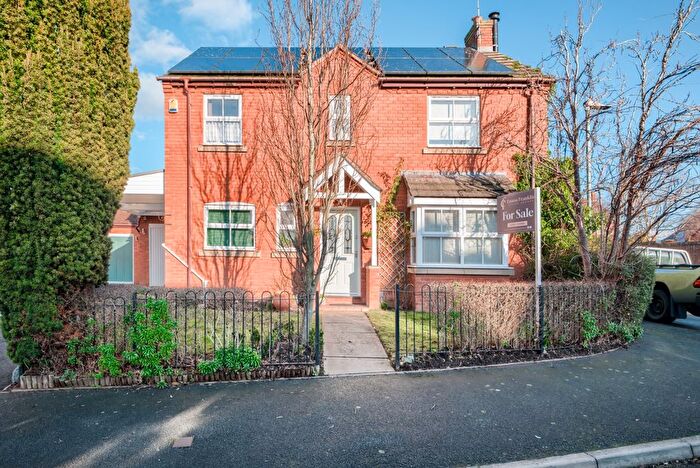
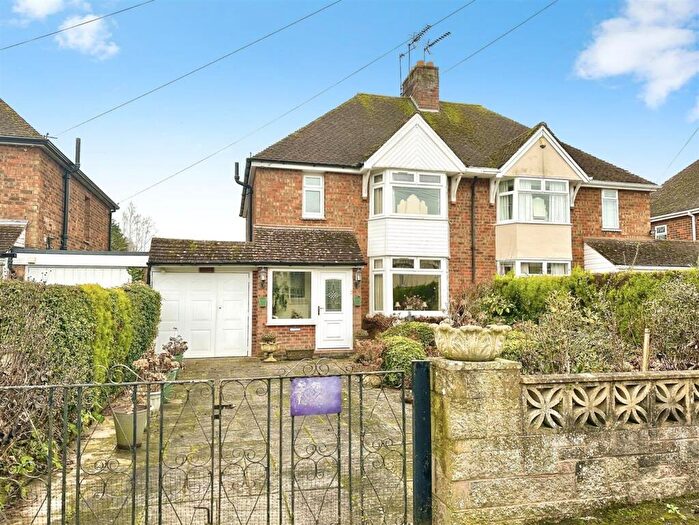
Properties in Kinwarton have an average house price of £443,447.00 and had 107 Property Transactions within the last 3 years¹.
Kinwarton is an area in Alcester, Warwickshire with 836 households², where the most expensive property was sold for £1,200,000.00.
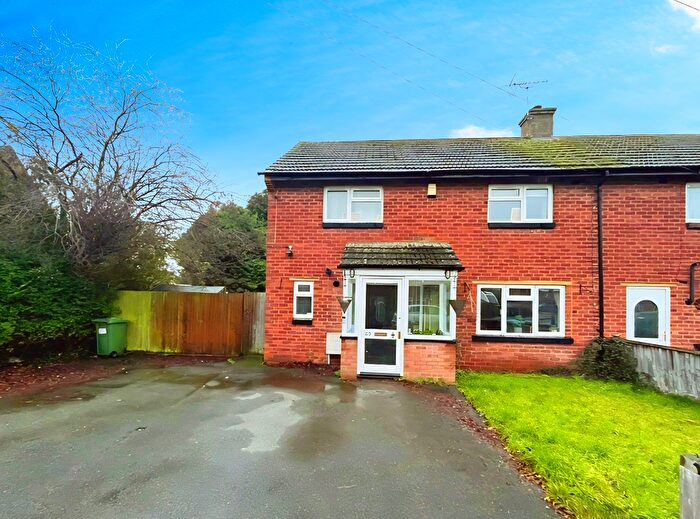
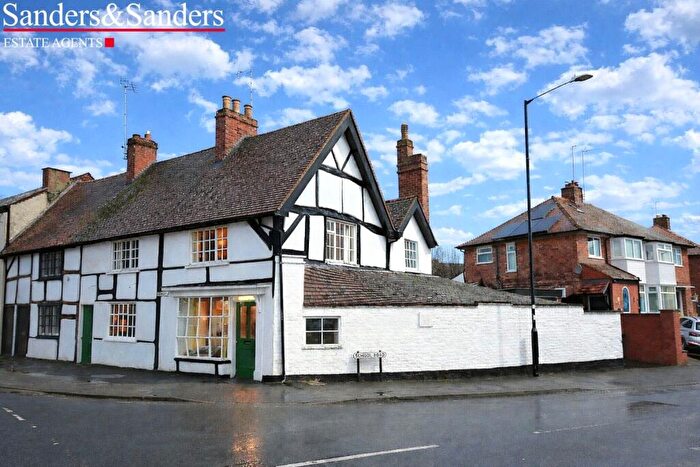
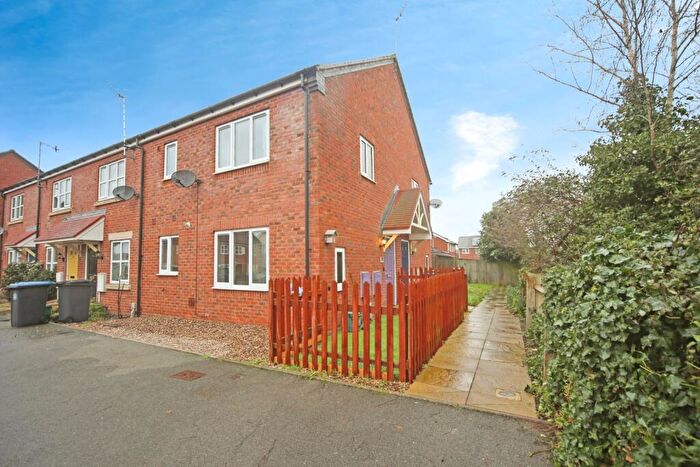
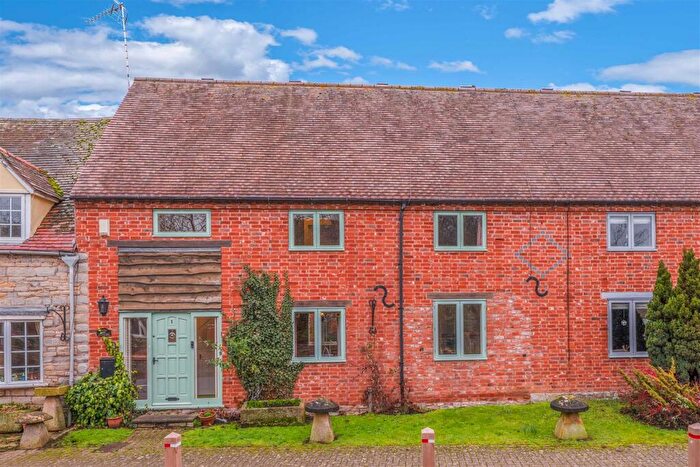
Properties for sale in Kinwarton
Roads and Postcodes in Kinwarton
Navigate through our locations to find the location of your next house in Kinwarton, Alcester for sale or to rent.
| Streets | Postcodes |
|---|---|
| Alcester Heath | B49 5JL |
| Alne End | B49 6HH |
| Alne Hills | B49 6JS B49 6JT B49 6JU B49 6JX |
| Appleby Close | B49 6HJ |
| Barlich Way | B49 6QE |
| Bearley Road | B95 6HR B95 6LD |
| Beech Grove | B49 6FS |
| Boehm Drive | B49 6FG |
| Burford Lane | B49 6JH |
| Captains Hill | B49 6QN B49 6QW |
| Coughton Fields Lane | B49 6BX B49 6BT |
| Coughton Lane | B49 5HW |
| Devonish Close | B49 6EG |
| Elm Drive | B49 6PJ |
| Fenwick Close | B49 6JZ |
| Fisher Road | B49 6FF |
| Gerard Road | B49 6QG B49 6QQ |
| Glebe Road | B49 6FD |
| Haselor Close | B49 6QD |
| Henley Road | B49 6HR B49 6HX |
| Horton Close | B49 6LB |
| Kinnersley Road | B49 6FJ B49 6FL |
| Kinwarton Close | B49 6FE |
| Kinwarton Farm Road | B49 6EH |
| Larch Court | B49 6FQ |
| Linfoot Oaks | B49 6RG |
| Little Alne | B95 6HP B95 6JH |
| Mill Lane | B49 6JA B49 6LF B49 6LQ |
| Nightingale Close | B49 6PE |
| Oversley Green | B49 6LE B49 6PH |
| Park Lane | B49 6HS |
| Poplar Close | B49 6PL |
| Primrose Lane | B49 6LG |
| Purton Close | B49 6EQ |
| Riddell Close | B49 6QP |
| Rufford Close | B49 6EE |
| Salters Lane | B95 6DS |
| School Close | B49 6HE |
| School Road | B49 6HQ |
| Seymour Road | B49 6EF B49 6JY B49 6LD |
| Shelfield Green | B49 6JR |
| Spernal Lane | B49 6JD |
| Spernall Lane | B49 6HY B49 6HZ |
| St Marys Road | B49 6QH |
| Stratford Road | B49 6LN B49 6PG |
| Throckmorton Road | B49 6QA B49 6QB B49 6QJ |
| Tything Road East | B49 6ER B49 6ES B49 6ET B49 6EU B49 6EX |
| Wain Close | B49 6LA |
| Wakefield Way | B49 6FH |
| Wheathills Cottage | B95 6JX |
| Winchcombe Road | B49 6QL |
| Wood Lane | B95 6JT |
| Woodland Drive | B49 6FP B49 6FT B49 6FX B49 6FY B49 6FU B49 6FW |
| B49 6DH B49 6HA B49 6HB B49 6HG B49 6HL B49 6JB B49 6JJ B49 5JA B49 6HP B49 6JL B49 6LT B49 6NA B49 6NB B49 6NW B95 6JU B49 6FR |
Transport near Kinwarton
- FAQ
- Price Paid By Year
- Property Type Price
Frequently asked questions about Kinwarton
What is the average price for a property for sale in Kinwarton?
The average price for a property for sale in Kinwarton is £443,447. This amount is 23% higher than the average price in Alcester. There are 1,722 property listings for sale in Kinwarton.
What streets have the most expensive properties for sale in Kinwarton?
The streets with the most expensive properties for sale in Kinwarton are Burford Lane at an average of £750,000, Henley Road at an average of £747,500 and Mill Lane at an average of £653,333.
What streets have the most affordable properties for sale in Kinwarton?
The streets with the most affordable properties for sale in Kinwarton are Devonish Close at an average of £175,090, Rufford Close at an average of £184,000 and Seymour Road at an average of £186,750.
Which train stations are available in or near Kinwarton?
Some of the train stations available in or near Kinwarton are Wootton Wawen, Wilmcote and Bearley.
Property Price Paid in Kinwarton by Year
The average sold property price by year was:
| Year | Average Sold Price | Price Change |
Sold Properties
|
|---|---|---|---|
| 2025 | £459,524 | 8% |
29 Properties |
| 2024 | £423,789 | -9% |
49 Properties |
| 2023 | £460,585 | 21% |
29 Properties |
| 2022 | £362,678 | -13% |
46 Properties |
| 2021 | £408,539 | 5% |
58 Properties |
| 2020 | £388,788 | -6% |
38 Properties |
| 2019 | £410,424 | 9% |
45 Properties |
| 2018 | £372,960 | -8% |
40 Properties |
| 2017 | £401,314 | 4% |
37 Properties |
| 2016 | £385,084 | 20% |
45 Properties |
| 2015 | £306,142 | 1% |
68 Properties |
| 2014 | £303,208 | 14% |
69 Properties |
| 2013 | £260,622 | -20% |
65 Properties |
| 2012 | £313,468 | 28% |
22 Properties |
| 2011 | £225,986 | -41% |
19 Properties |
| 2010 | £317,848 | 11% |
25 Properties |
| 2009 | £281,954 | 24% |
24 Properties |
| 2008 | £212,903 | -17% |
13 Properties |
| 2007 | £249,081 | -10% |
38 Properties |
| 2006 | £272,761 | 28% |
47 Properties |
| 2005 | £197,565 | -8% |
32 Properties |
| 2004 | £214,281 | 6% |
45 Properties |
| 2003 | £200,666 | 31% |
39 Properties |
| 2002 | £138,552 | 4% |
36 Properties |
| 2001 | £133,233 | 12% |
46 Properties |
| 2000 | £117,138 | -34% |
44 Properties |
| 1999 | £157,043 | 43% |
32 Properties |
| 1998 | £89,908 | -8% |
45 Properties |
| 1997 | £97,444 | 15% |
59 Properties |
| 1996 | £83,116 | 6% |
51 Properties |
| 1995 | £78,492 | - |
41 Properties |
Property Price per Property Type in Kinwarton
Here you can find historic sold price data in order to help with your property search.
The average Property Paid Price for specific property types in the last three years are:
| Property Type | Average Sold Price | Sold Properties |
|---|---|---|
| Semi Detached House | £371,296.00 | 31 Semi Detached Houses |
| Detached House | £618,326.00 | 39 Detached Houses |
| Terraced House | £358,116.00 | 21 Terraced Houses |
| Flat | £268,968.00 | 16 Flats |

