
Houses for sale in Warwickshire, England
House Prices in Warwickshire
Properties in Warwickshire have
an average house price of
£344k
and had 30,155 Property Transactions
within the last 3 years.¹
Warwickshire is a location in
England with
288,065 households², where the most expensive property was sold for £7.95M.
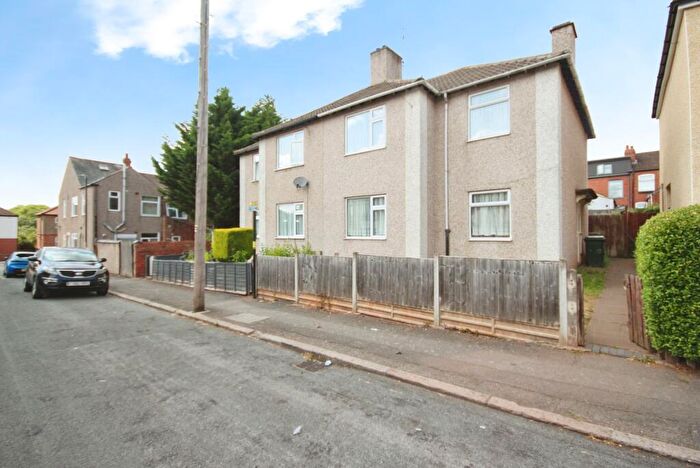
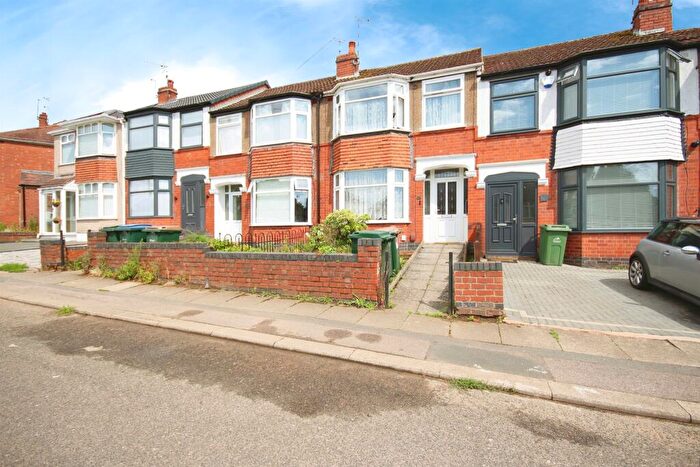
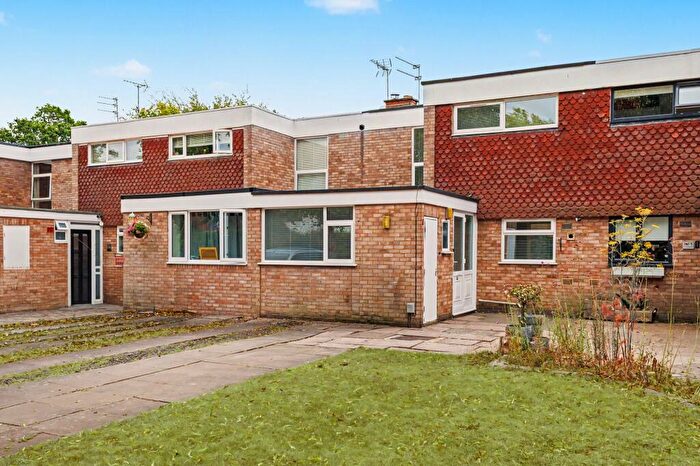
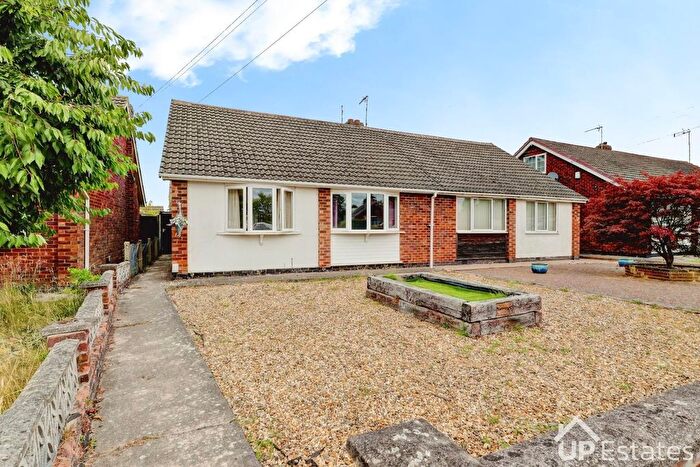
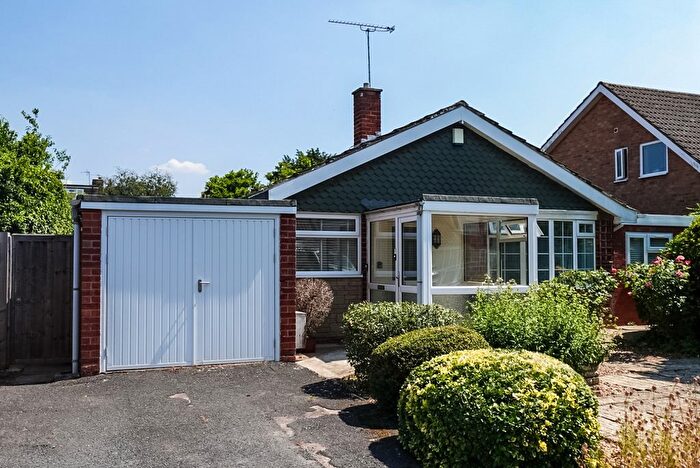
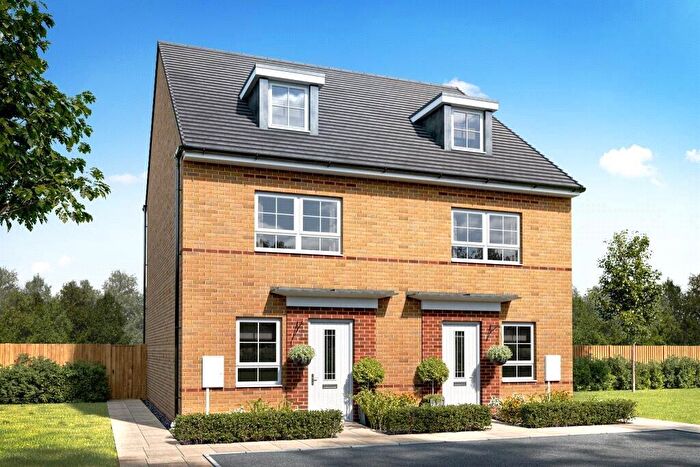
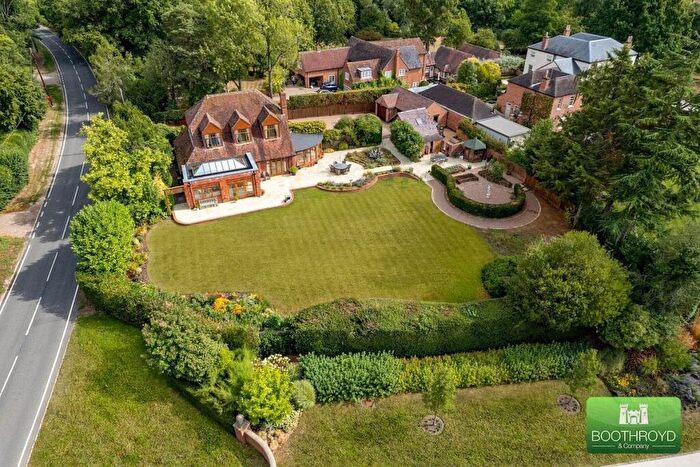
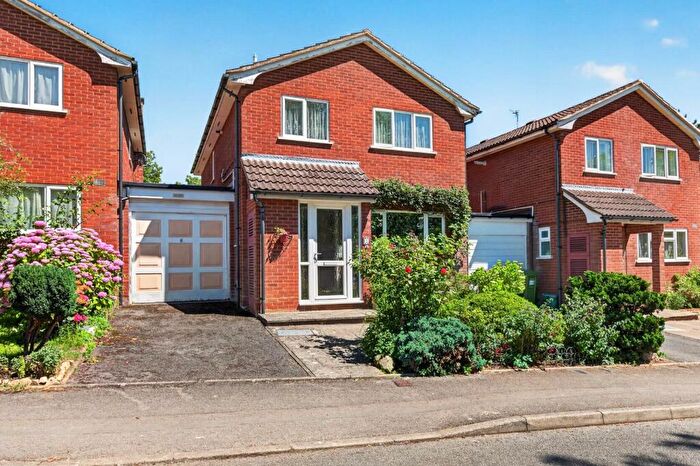
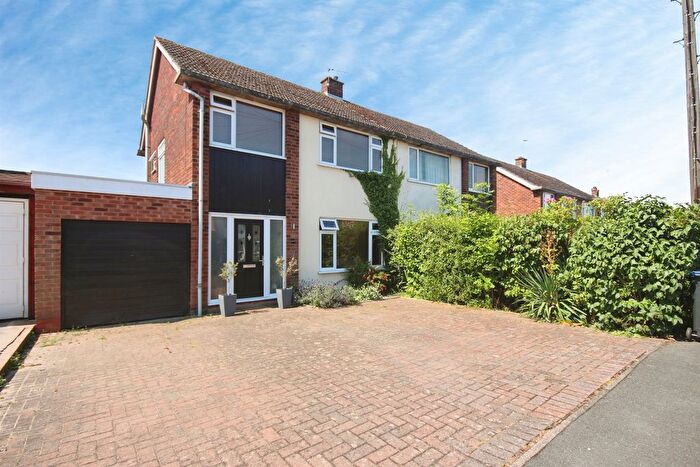
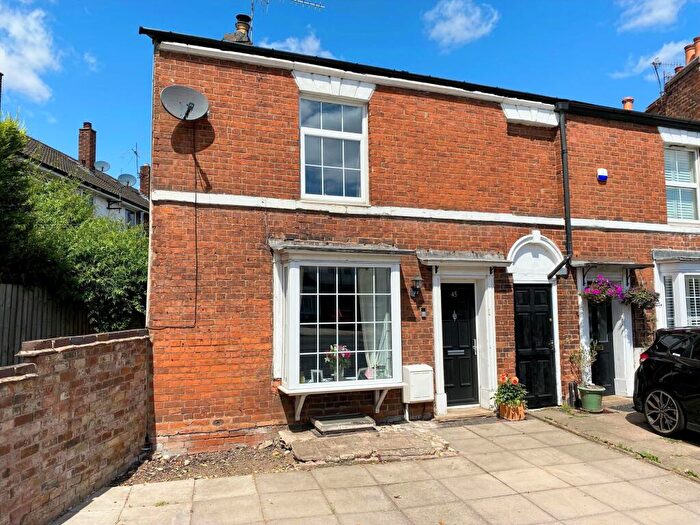
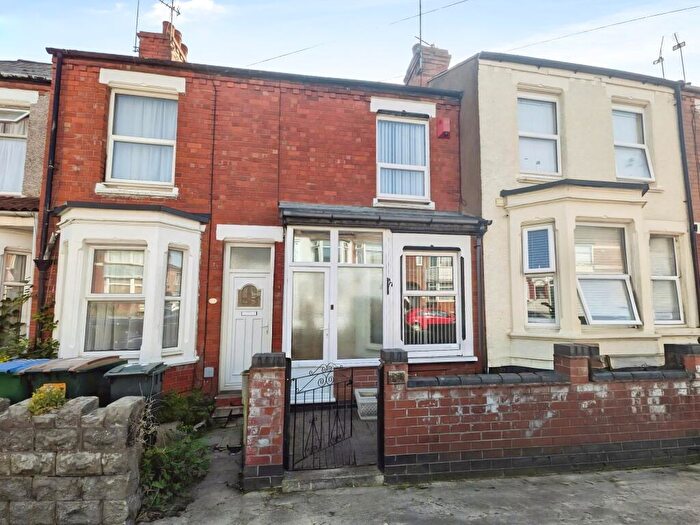
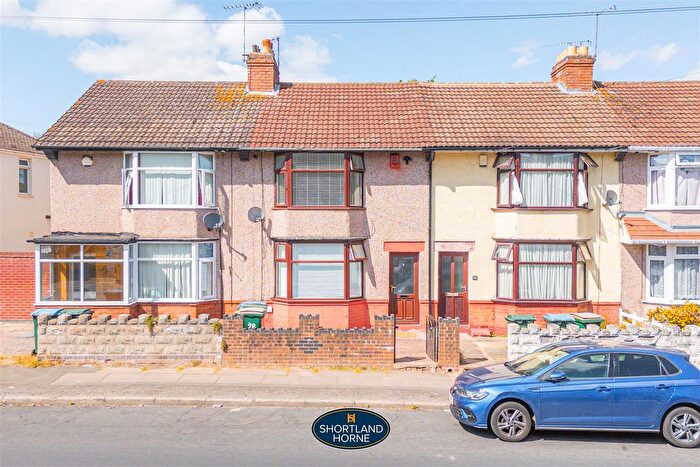
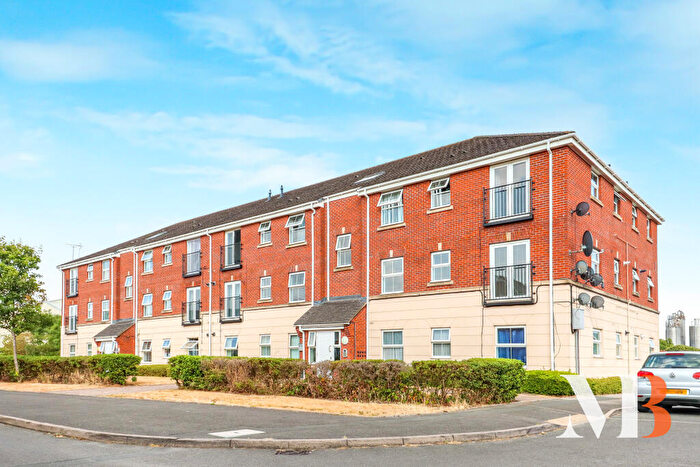
Properties for sale in Warwickshire

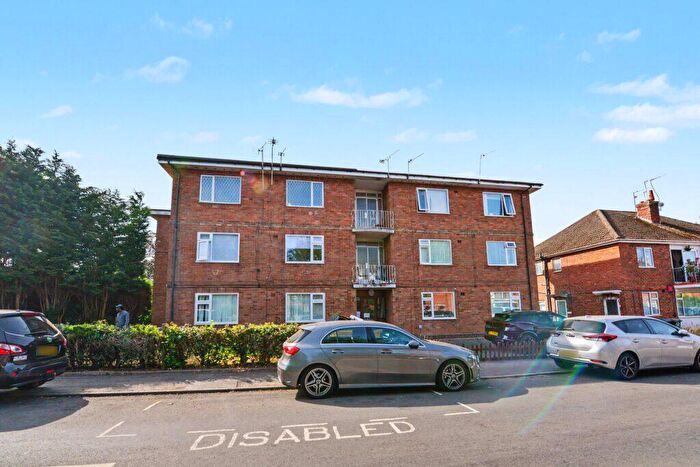
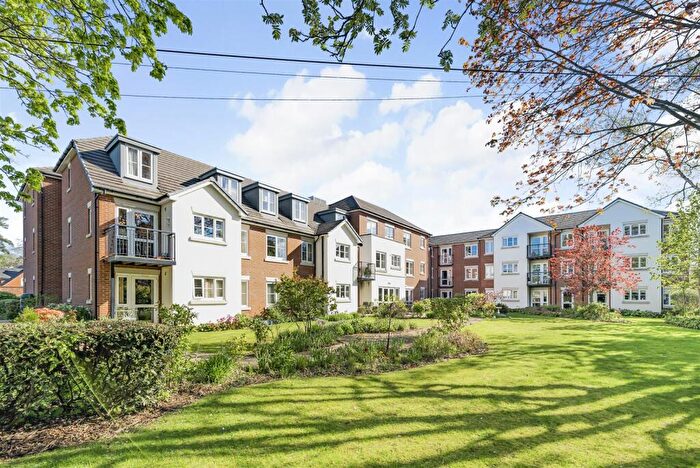
![]()
If you are looking to sell your house, let it out, or receive a property valuation, an expert can help you.
Click the button below to get started.


Towns in Warwickshire
Navigate through our locations to find the location of your next house in Warwickshire, England for sale or to rent.
- Southam
- Lutterworth
- Alcester
- Market Harborough
- Henley-in-arden
- Evesham
- Moreton-in-marsh
- Stratford-upon-avon
- Hinckley
- Coventry
- Bedworth
- Daventry
- Atherstone
- Solihull
- Sutton Coldfield
- Studley
- Birmingham
- Shipston-on-stour
- Warwick
- Leamington Spa
- Chipping Campden
- Rugby
- Tamworth
- Kenilworth
- Nuneaton
- Towcester
- Banbury
- Northampton
- Chipping Norton
- Redditch
Property price trends in Warwickshire
According to the latest Land Registry data, the average home in Warwickshire sold for £333,582 in 2026. That figure comes from a substantial record of 367,379 sales logged over the past 31 years.
Prices have softened over the last three years. Compared with 2023, when the typical sale came in around £340,541, that's a fall of roughly 2%.
Looking back five years, average prices are up about 1.3% since 2021, a gain of around £4,348 in cash terms.
Zoom out to the past decade for the fuller picture. Back in 2016, homes here averaged £267,340, so the typical sold price has climbed about 24.8% since then, roughly 2.2% a year. Stretch the view to fifteen years and that annual pace edges up closer to 3%.
Frequently asked questions about Warwickshire
What is the average price for a property for sale in Warwickshire?
The average price for a property for sale in Warwickshire is £344,061. This amount is 4% lower than the average price in England. There are more than 10,000 property listings for sale in Warwickshire.
What locations have the most expensive properties for sale in Warwickshire?
The locations with the most expensive properties for sale in Warwickshire are Chipping Campden at an average of £1,147,000, Moreton-in-marsh at an average of £888,398 and Lutterworth at an average of £850,000.
What locations have the most affordable properties for sale in Warwickshire?
The locations with the most affordable properties for sale in Warwickshire are Bedworth at an average of £227,953, Nuneaton at an average of £237,445 and Atherstone at an average of £258,402.
Which train stations are available in or near Warwickshire?
Some of the train stations available in or near Warwickshire are Coventry, Leamington Spa and Canley.
Property Price Paid in Warwickshire by Year
The average sold property price by year was:
| Year | Average Sold Price | Price Change |
Sold Properties
|
|---|---|---|---|
| 2026 | £333,582 | -5% |
1,809 Properties |
| 2025 | £350,367 | 2% |
9,911 Properties |
| 2024 | £342,736 | 1% |
9,731 Properties |
| 2023 | £340,541 | -0,4% |
8,704 Properties |
| 2022 | £342,040 | 4% |
10,932 Properties |
| 2021 | £329,234 | 6% |
13,790 Properties |
| 2020 | £309,742 | 6% |
10,497 Properties |
| 2019 | £290,518 | -1% |
12,523 Properties |
| 2018 | £293,110 | 4% |
13,072 Properties |
| 2017 | £281,139 | 5% |
12,805 Properties |
Property Price per Property Type in Warwickshire
Here you can find historic sold price data in order to help with your property search.
The average Property Paid Price for specific property types in the last three years are:
| Property Type | Average Sold Price | Sold Properties |
|---|---|---|
| Semi Detached House | £301,639.00 | 9,872 Semi Detached Houses |
| Terraced House | £262,530.00 | 7,746 Terraced Houses |
| Detached House | £523,186.00 | 8,944 Detached Houses |
| Flat | £190,496.00 | 3,593 Flats |
Transport in Warwickshire
Please see below transportation links in this area:
