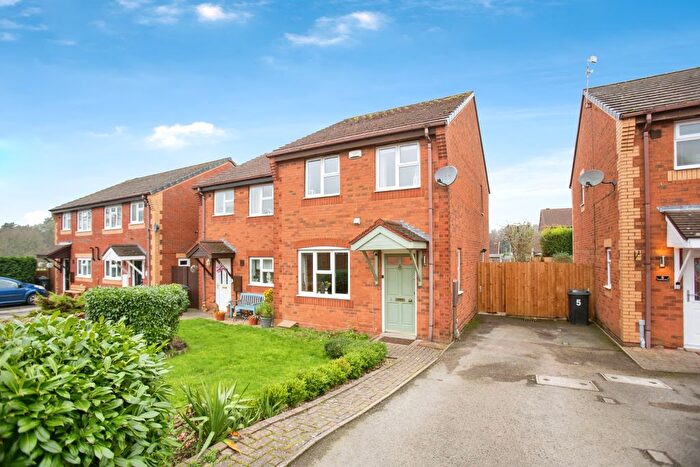
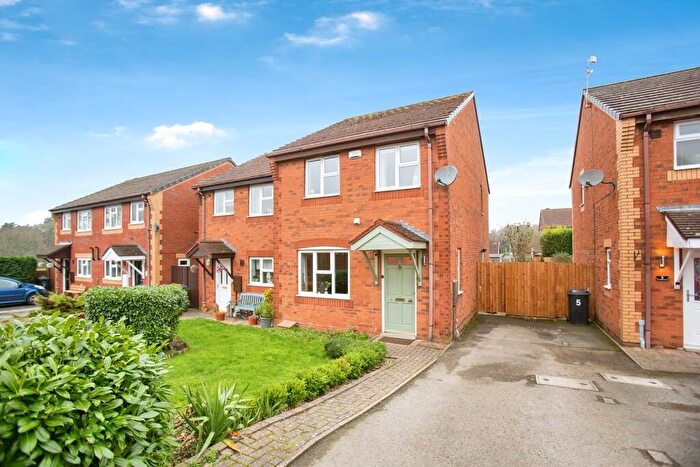
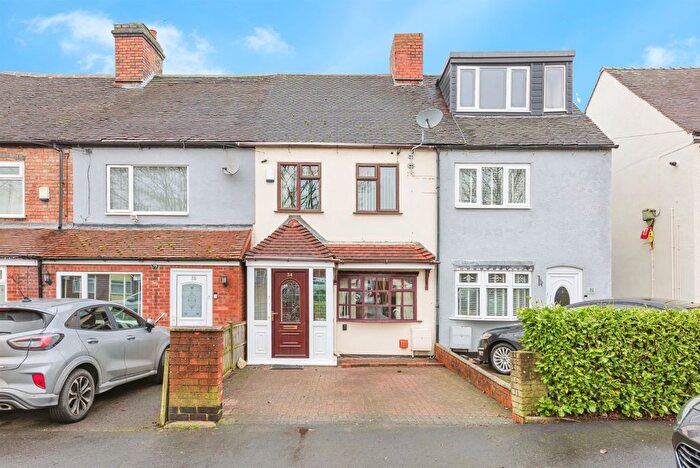
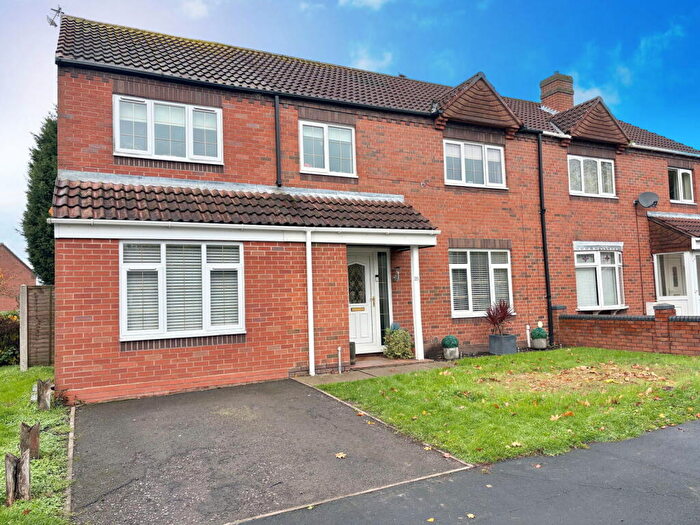
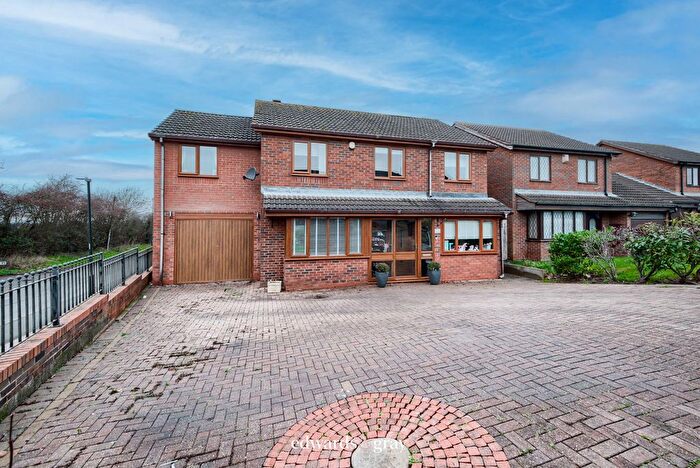
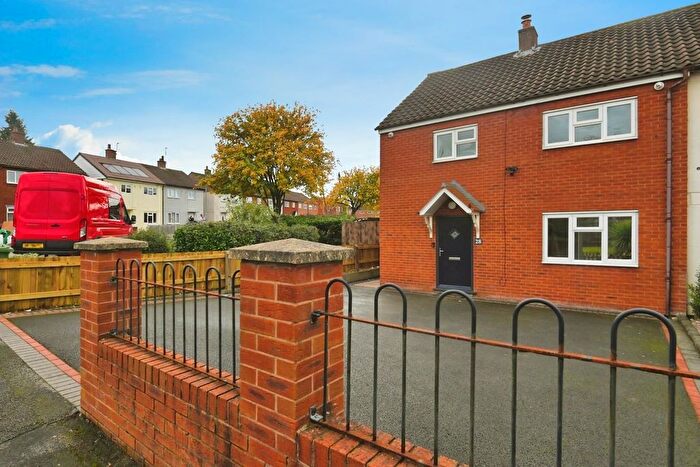
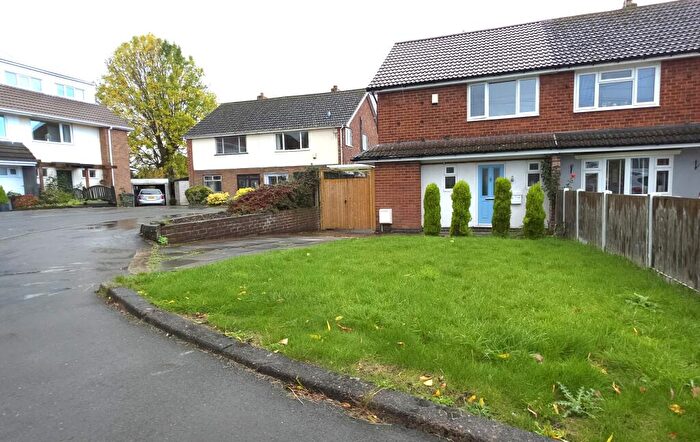
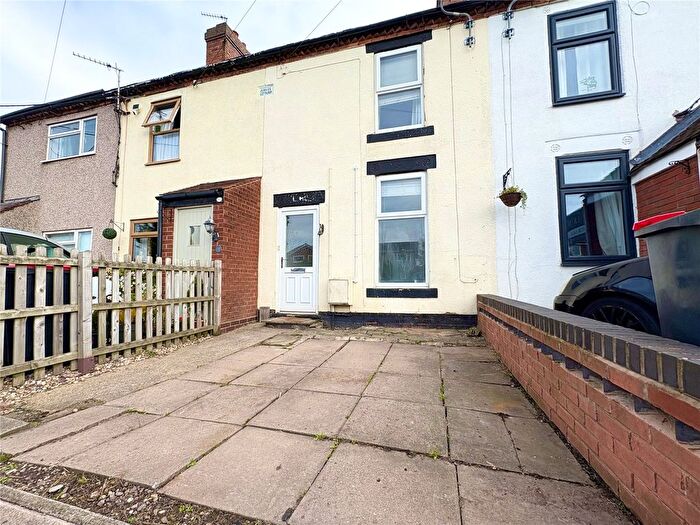
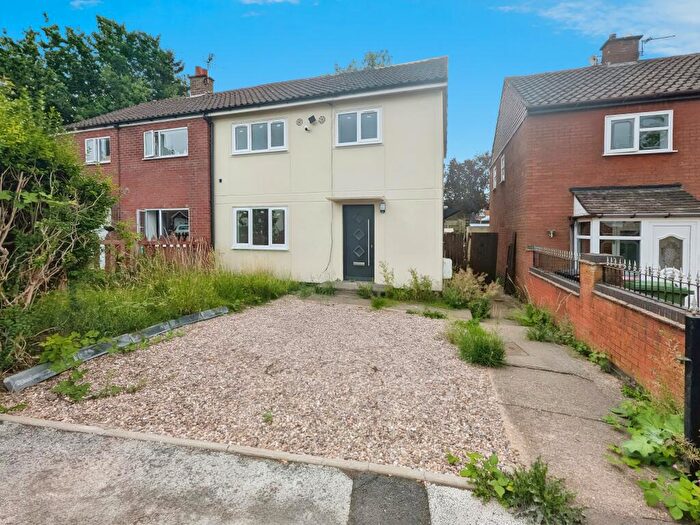
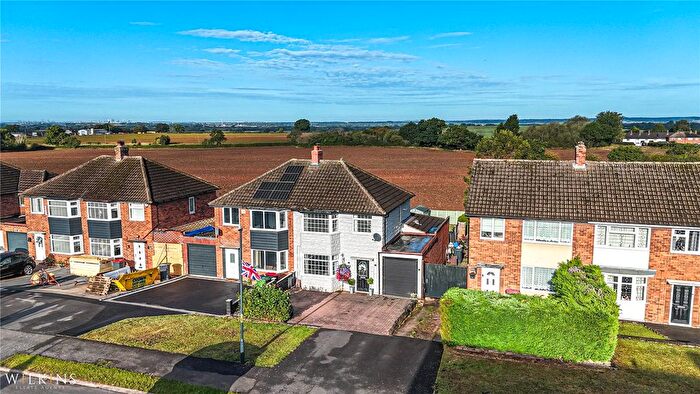
Houses for sale & to rent in Hurley And Wood End, Atherstone
House Prices in Hurley And Wood End
Properties in Hurley And Wood End have an average house price of £261,631.00 and had 83 Property Transactions within the last 3 years¹.
Hurley And Wood End is an area in Atherstone, Warwickshire with 1,306 households², where the most expensive property was sold for £900,000.00.
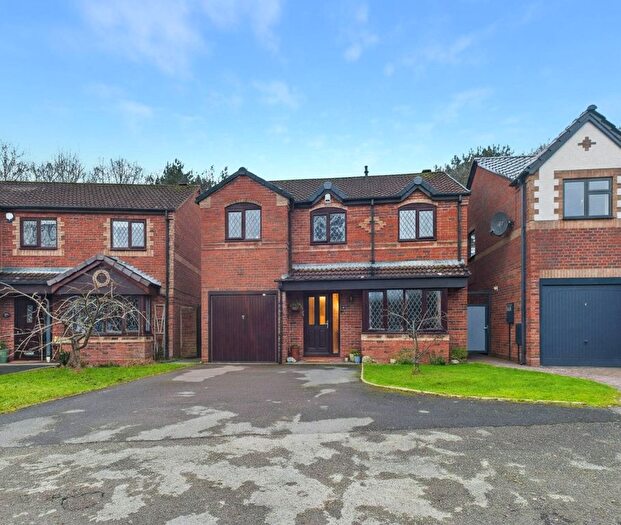
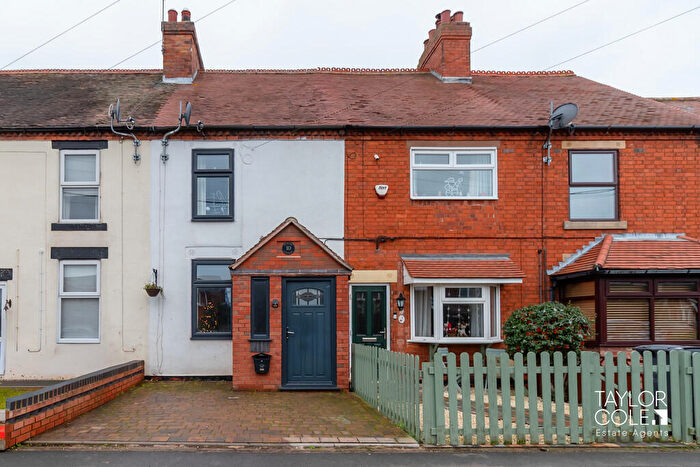
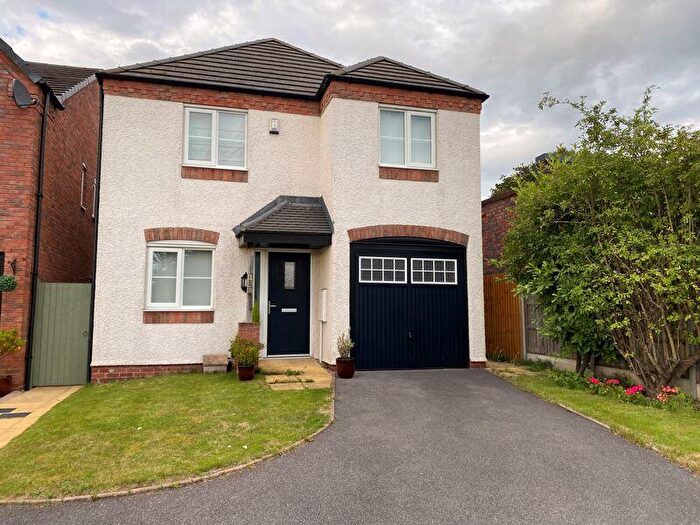
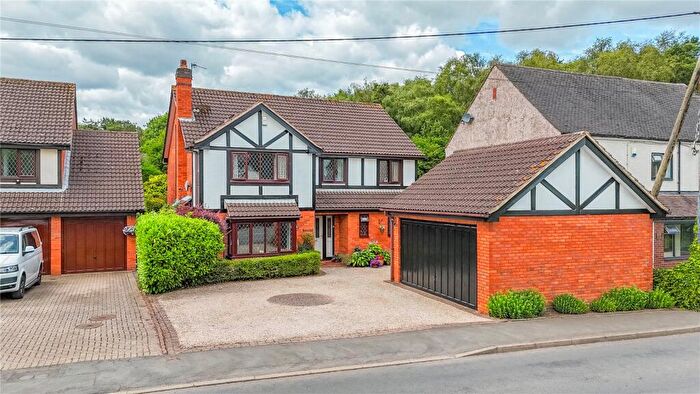
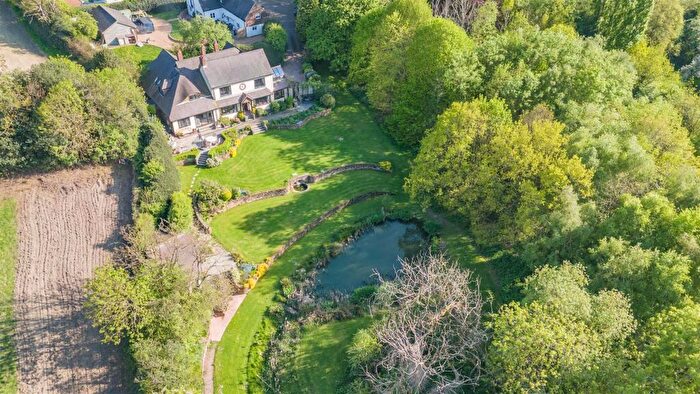
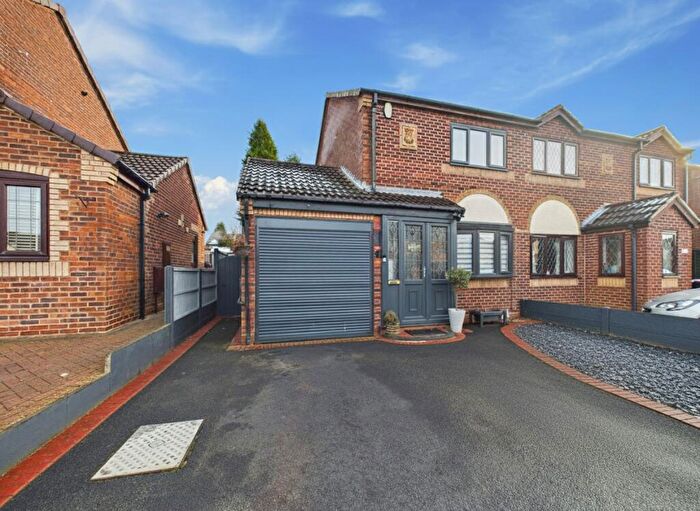
Properties for sale in Hurley And Wood End
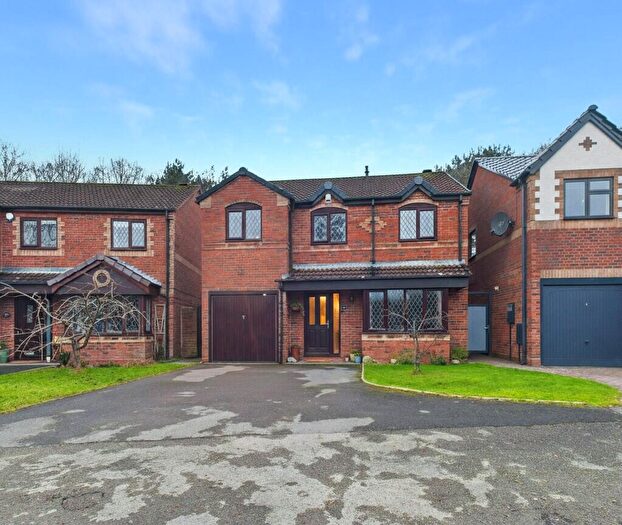
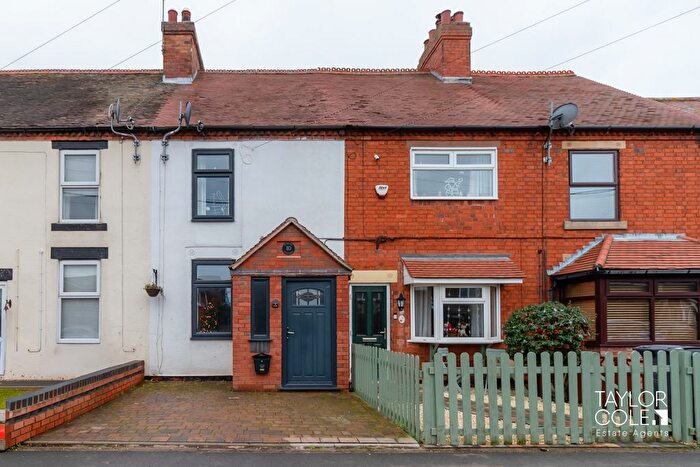
Previously listed properties in Hurley And Wood End
Roads and Postcodes in Hurley And Wood End
Navigate through our locations to find the location of your next house in Hurley And Wood End, Atherstone for sale or to rent.
| Streets | Postcodes |
|---|---|
| Atherstone Lane | CV9 2HT |
| Atherstone Road | CV9 2HU |
| Beech Close | CV9 2NT |
| Birchfield Close | CV9 2QT |
| Boulters Lane | CV9 2QD CV9 2QE |
| Brick Kiln Lane | CV9 2LT CV9 2LU |
| Bridge Street | CV9 2NF |
| Brook End | CV9 2JP |
| Brookfields Close | CV9 2RZ |
| Cherry Close | CV9 2NB |
| Church Close | CV9 2QY |
| Club Drive | CV9 2BF |
| Coronation Road | CV9 2NN CV9 2NW |
| Crown Close | CV9 2SN |
| Delves Crescent | CV9 2QF |
| Dexter Lane | CV9 2JQ CV9 2JG |
| East House Drive | CV9 2HB |
| Edge Hill | CV9 2QR |
| Edinburgh Road | CV9 2NL |
| Elm Grove | CV9 2NE |
| Everglade Road | CV9 2RR |
| Ferndale Close | CV9 2NX |
| Foul End | CV9 2JL CV9 2JW CV9 2JN |
| Glenville Avenue | CV9 2QN |
| Hawthorn Avenue | CV9 2NH |
| Heanley Lane | CV9 2HY CV9 2HZ |
| High Street | CV9 2NQ |
| Highview | CV9 2RP |
| Hipsley Lane | CV9 2HR |
| Holly Drive | CV9 2JY |
| Hurley Common | CV9 2LP CV9 2LR CV9 2LS |
| Hurley Lane | CV9 2GY CV9 2JJ |
| Johnson Street | CV9 2QW |
| Kings Close | CV9 2RE |
| Knowle Hill | CV9 2HX CV9 2JA CV9 2JB CV9 2JD CV9 2JE CV9 2JF CV9 2JZ |
| Lime Grove | CV9 2LY |
| Marlow Road | CV9 2NG |
| Meadow Road | CV9 2NP |
| Meadow View | CV9 2FD |
| Orchard Close | CV9 2LZ |
| Pinewood Avenue | CV9 2RS |
| Princes Road | CV9 2NR CV9 2NS |
| Queens Way | CV9 2LX CV9 2NA CV9 2ND |
| Riversdale Road | CV9 1LP |
| Sherwood Close | CV9 2RT |
| Smith Street | CV9 2QP CV9 2PX |
| St Edmonds Road | CV9 2NJ |
| St Michaels Close | CV9 2RX |
| Tamworth Road | CV9 2FB CV9 2QH CV9 2QQ |
| The Woodlands | CV9 2PT |
| Wakefield Close | CV9 2JH |
| Whateley Villas | CV9 2QS |
| Wood Street | CV9 2QJ CV9 2QL |
| Woodbridge Park | CV9 2GB |
| Woodside Close | CV9 2PS |
| CV9 2FW |
Transport near Hurley And Wood End
- FAQ
- Price Paid By Year
- Property Type Price
Frequently asked questions about Hurley And Wood End
What is the average price for a property for sale in Hurley And Wood End?
The average price for a property for sale in Hurley And Wood End is £261,631. This amount is 2% higher than the average price in Atherstone. There are 241 property listings for sale in Hurley And Wood End.
What streets have the most expensive properties for sale in Hurley And Wood End?
The streets with the most expensive properties for sale in Hurley And Wood End are Atherstone Road at an average of £450,000, Edge Hill at an average of £384,750 and Knowle Hill at an average of £368,797.
What streets have the most affordable properties for sale in Hurley And Wood End?
The streets with the most affordable properties for sale in Hurley And Wood End are Glenville Avenue at an average of £100,000, Delves Crescent at an average of £154,125 and Johnson Street at an average of £216,475.
Which train stations are available in or near Hurley And Wood End?
Some of the train stations available in or near Hurley And Wood End are Wilnecote, Atherstone and Polesworth.
Property Price Paid in Hurley And Wood End by Year
The average sold property price by year was:
| Year | Average Sold Price | Price Change |
Sold Properties
|
|---|---|---|---|
| 2025 | £265,285 | 9% |
32 Properties |
| 2024 | £240,159 | -17% |
27 Properties |
| 2023 | £280,916 | 13% |
24 Properties |
| 2022 | £244,618 | -3% |
37 Properties |
| 2021 | £251,879 | -0,1% |
56 Properties |
| 2020 | £252,066 | 7% |
36 Properties |
| 2019 | £234,168 | 14% |
52 Properties |
| 2018 | £202,010 | -8% |
46 Properties |
| 2017 | £217,856 | -2% |
49 Properties |
| 2016 | £222,265 | 19% |
33 Properties |
| 2015 | £181,105 | 3% |
57 Properties |
| 2014 | £174,890 | 19% |
54 Properties |
| 2013 | £141,806 | -39% |
36 Properties |
| 2012 | £197,644 | 32% |
18 Properties |
| 2011 | £134,595 | -14% |
23 Properties |
| 2010 | £153,801 | 0,3% |
35 Properties |
| 2009 | £153,383 | 31% |
31 Properties |
| 2008 | £106,046 | -43% |
20 Properties |
| 2007 | £151,859 | -13% |
43 Properties |
| 2006 | £171,896 | -18% |
39 Properties |
| 2005 | £202,433 | 22% |
55 Properties |
| 2004 | £158,638 | 8% |
43 Properties |
| 2003 | £146,695 | 17% |
51 Properties |
| 2002 | £122,092 | 23% |
54 Properties |
| 2001 | £94,510 | 25% |
63 Properties |
| 2000 | £71,295 | -7% |
34 Properties |
| 1999 | £76,596 | 2% |
34 Properties |
| 1998 | £75,361 | 12% |
48 Properties |
| 1997 | £66,118 | -2% |
47 Properties |
| 1996 | £67,563 | 9% |
33 Properties |
| 1995 | £61,173 | - |
33 Properties |
Property Price per Property Type in Hurley And Wood End
Here you can find historic sold price data in order to help with your property search.
The average Property Paid Price for specific property types in the last three years are:
| Property Type | Average Sold Price | Sold Properties |
|---|---|---|
| Semi Detached House | £269,242.00 | 33 Semi Detached Houses |
| Detached House | £384,323.00 | 17 Detached Houses |
| Terraced House | £200,764.00 | 30 Terraced Houses |
| Flat | £91,333.00 | 3 Flats |

