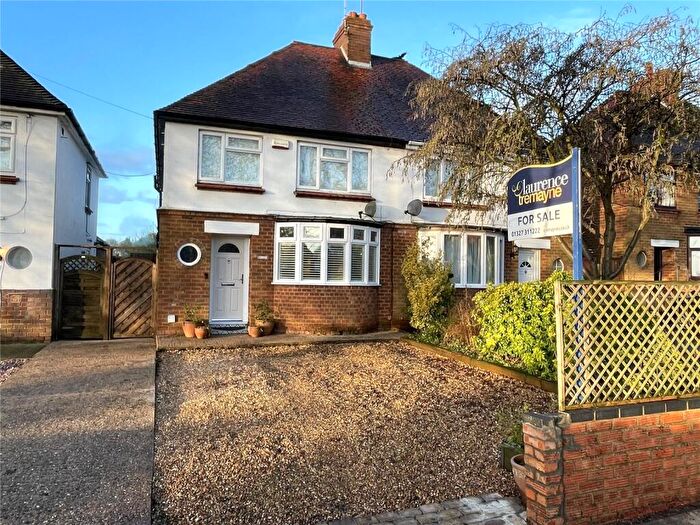
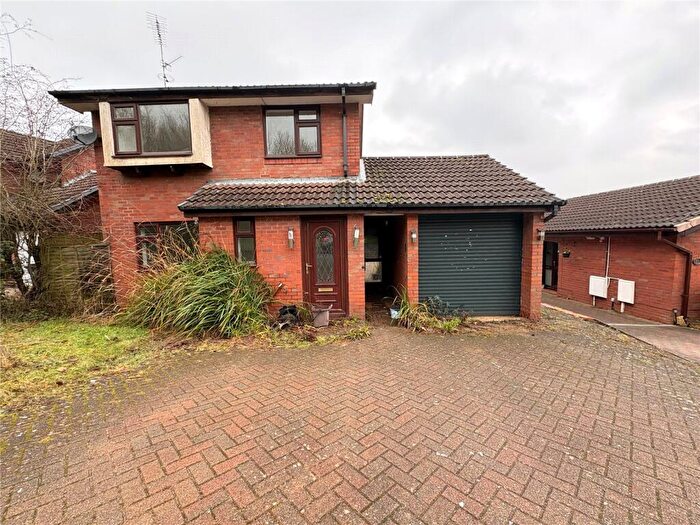
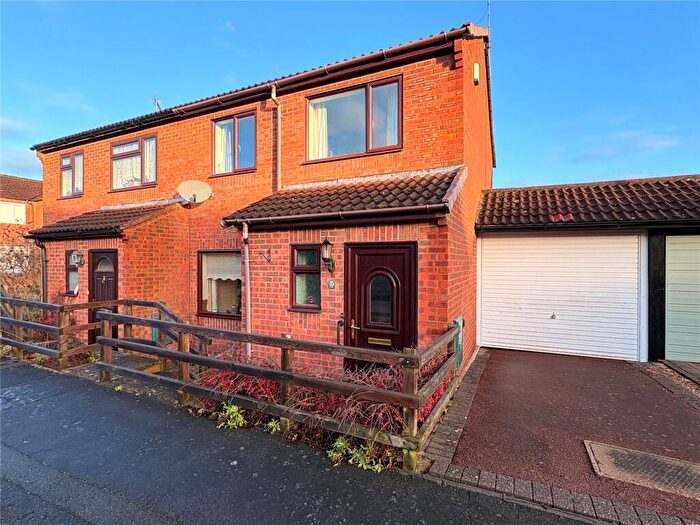
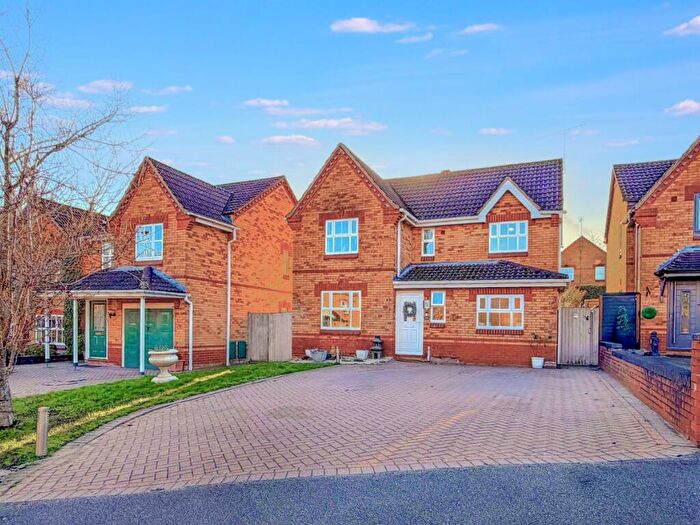
Houses for sale & to rent in Abbey South, Daventry
House Prices in Abbey South
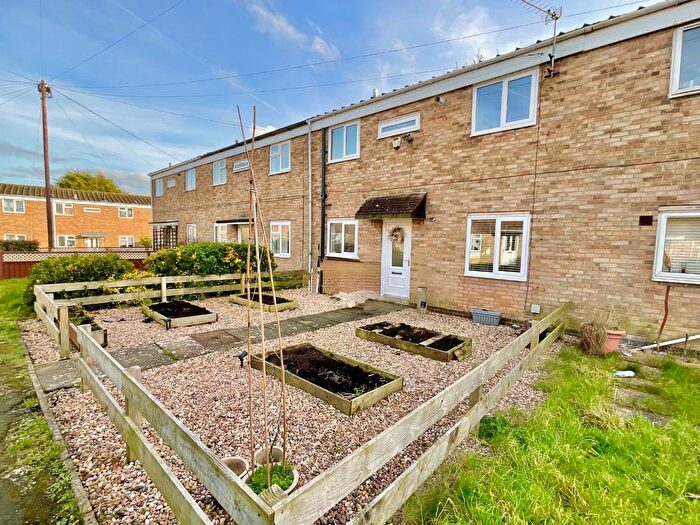
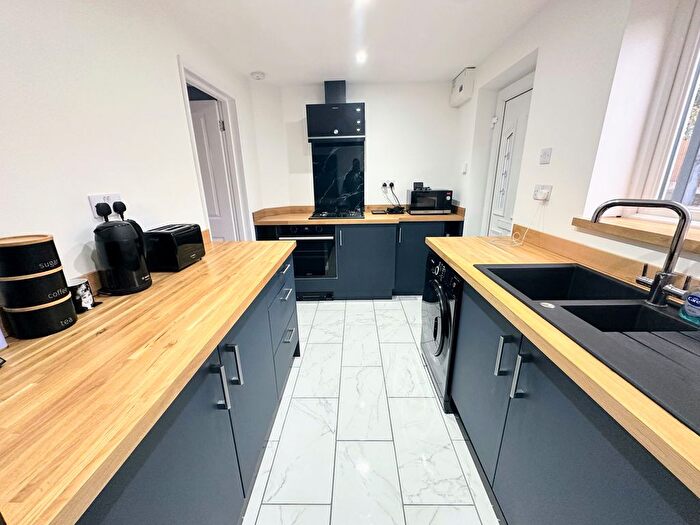
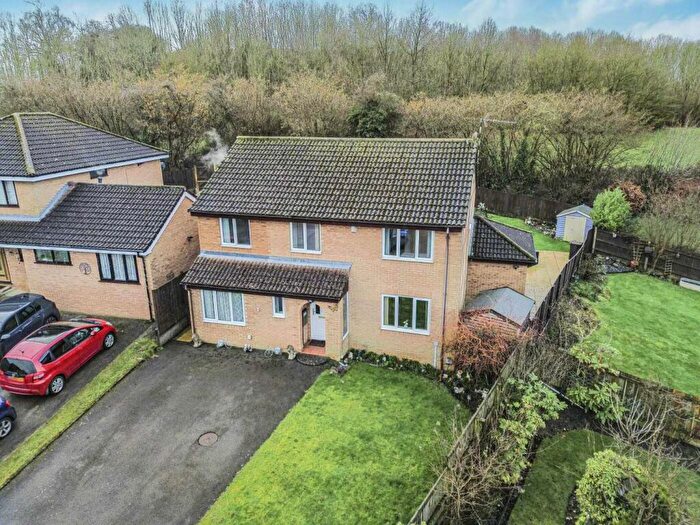
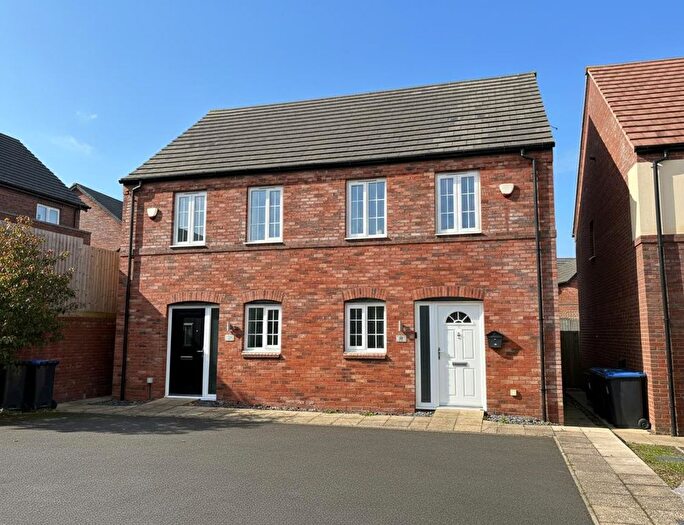
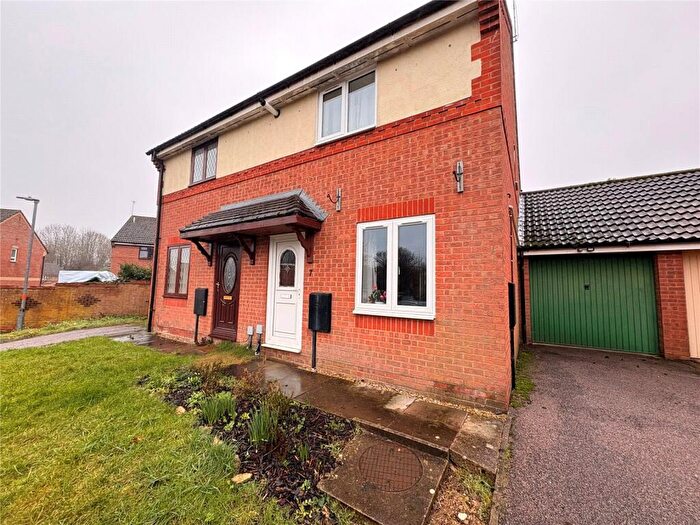
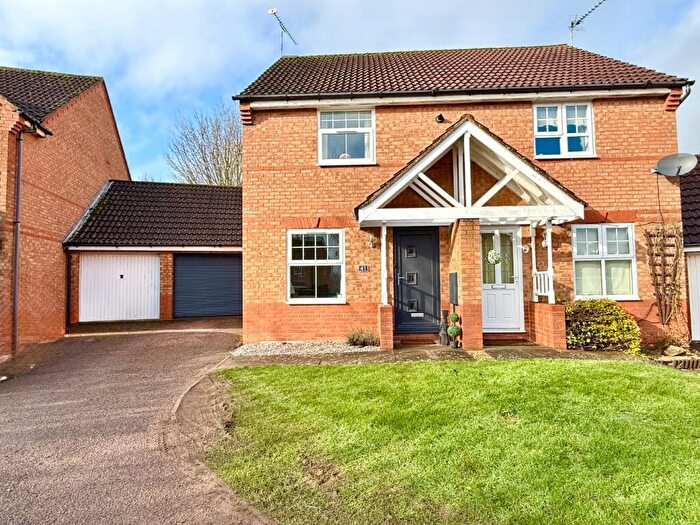
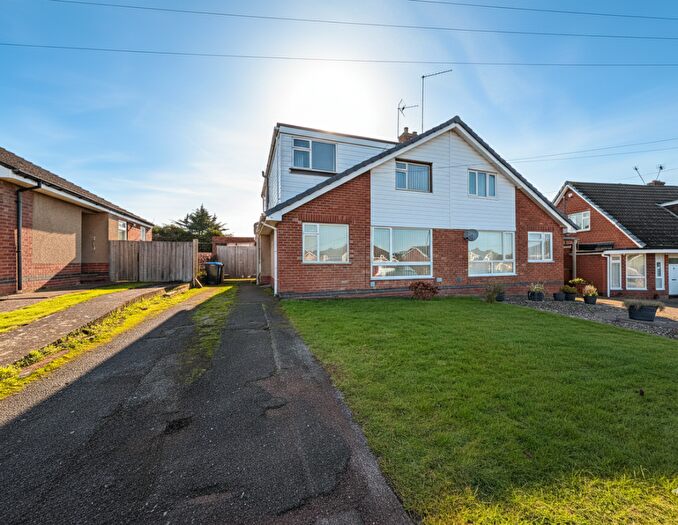
Properties in Abbey South have an average house price of £249,458.00 and had 265 Property Transactions within the last 3 years¹.
Abbey South is an area in Daventry, Warwickshire with 2,851 households², where the most expensive property was sold for £680,000.00.
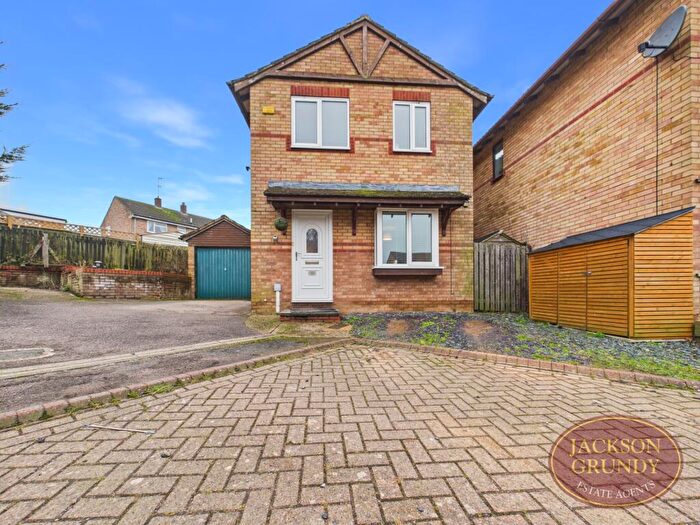
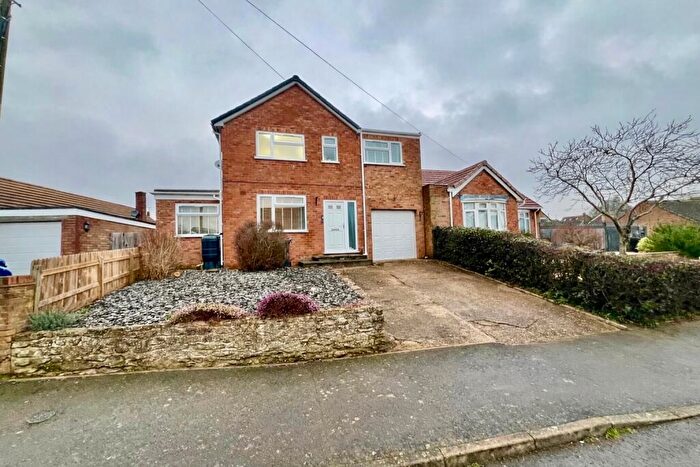
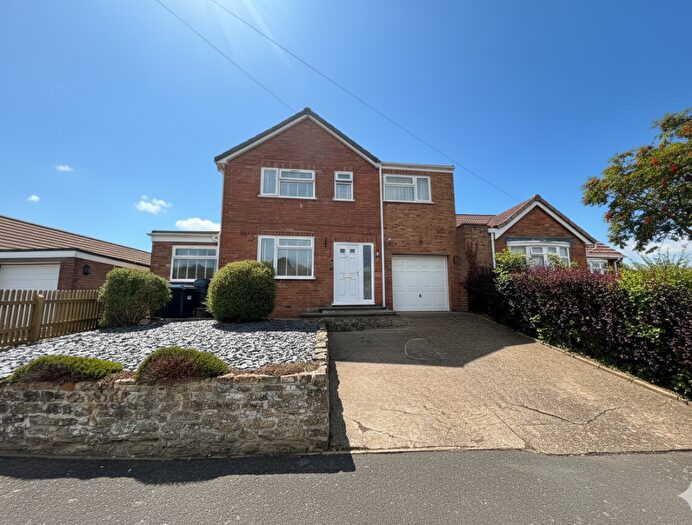
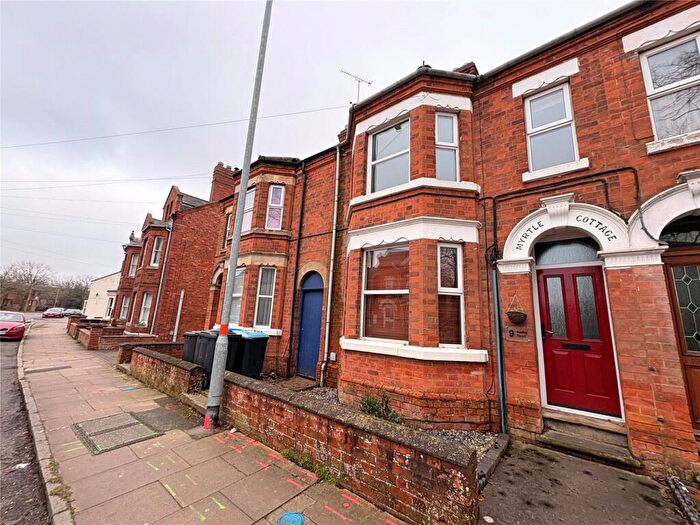
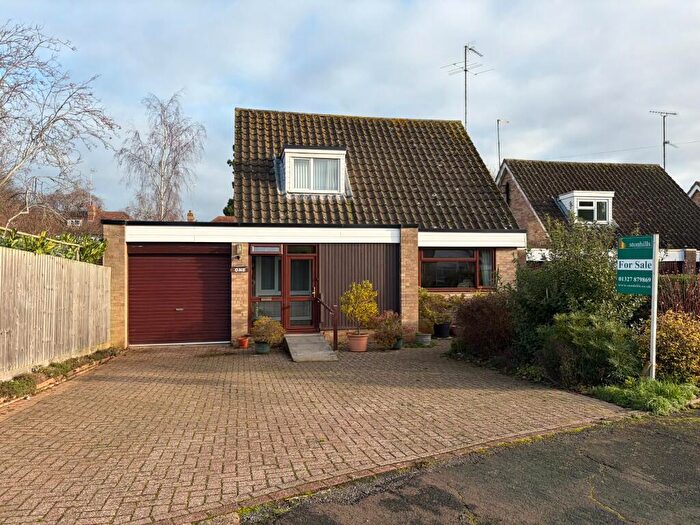
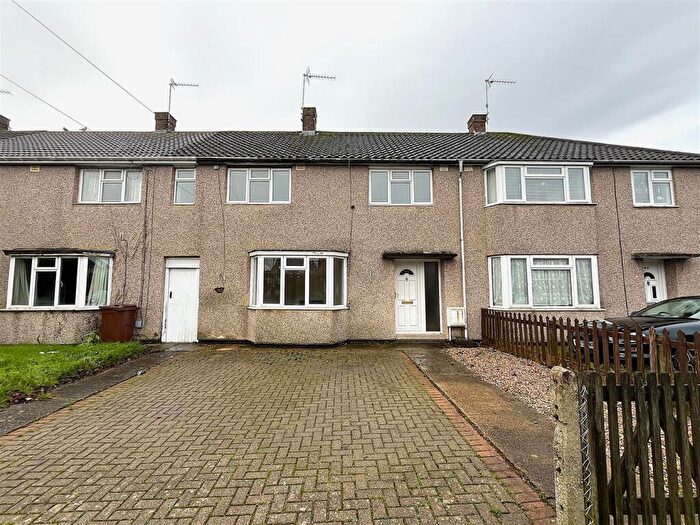
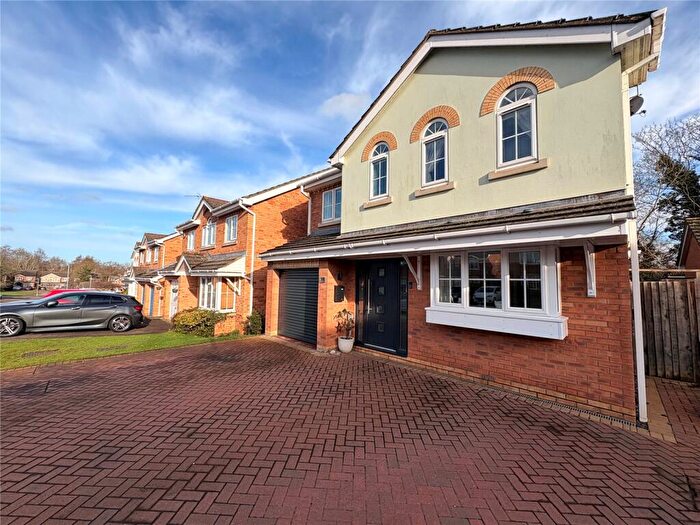
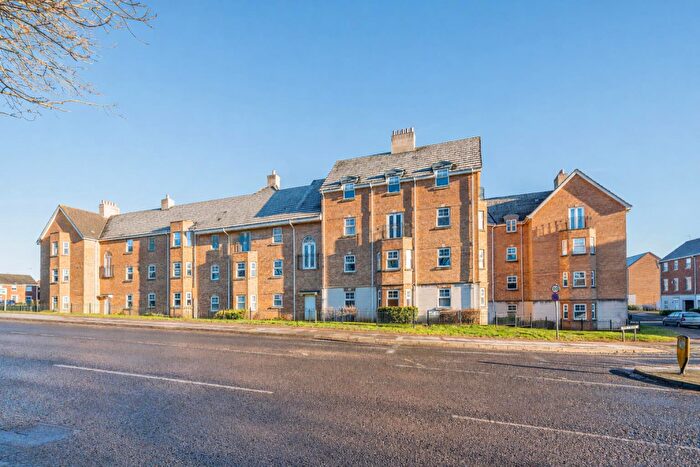
Properties for sale in Abbey South
Roads and Postcodes in Abbey South
Navigate through our locations to find the location of your next house in Abbey South, Daventry for sale or to rent.
| Streets | Postcodes |
|---|---|
| Abbot Close | NN11 4EW |
| Amundsen Close | NN11 0TJ |
| Ash Close | NN11 0XH |
| Ashby Park | NN11 0QW |
| Ashby Road | NN11 0QE NN11 0LD NN11 0QF |
| Ashdown Road | NN11 0PZ |
| Ashworth Street | NN11 4AR NN11 4GN |
| Astbury Close | NN11 4RL |
| Astbury Terrace | NN11 4EB |
| Badby Road | NN11 4AP NN11 4AW |
| Belmont Road | NN11 4AF |
| Bishops Court | NN11 4NP |
| Bowen Square | NN11 4DR NN11 4ER |
| Braunston Road | NN11 9BY |
| Broad March | NN11 4HE |
| Brook Street | NN11 4GG NN11 9YA NN11 9YB |
| Brooklands Close | NN11 4AT |
| Burton Close | NN11 0TX |
| Cabot Close | NN11 0TR |
| Castle Hill | NN11 4AQ |
| Cedar Close | NN11 0TY |
| Charles Terrace | NN11 4RP |
| Church Walk | NN11 4BL |
| Columbus Court | NN11 0TL |
| Cook Close | NN11 0SF |
| Coppice Close | NN11 4BD |
| Curlew Way | NN11 0XS |
| Daneholme Avenue | NN11 0PT |
| Daneholme Close | NN11 0PN |
| Eastern Way | NN11 0QB |
| Eider Close | NN11 0XR |
| Elder Drive | NN11 0XE |
| Ericsson Close | NN11 0TP |
| Falconers Close | NN11 0PR |
| Fiennes Court | NN11 0SL |
| Foundry Court | NN11 4RH |
| Foundry Place | NN11 4DX NN11 4FS |
| Foundry Walk | NN11 4PN |
| Franklin Way | NN11 0TF NN11 0TH |
| Friary Close | NN11 4FL |
| Golding Close | NN11 4FF NN11 4FB NN11 4FE NN11 4FH |
| Hawthorn Drive | NN11 0PU |
| Heron Court | NN11 0XT |
| High Street | NN11 4BG NN11 4BQ NN11 4BW NN11 4HT NN11 4HU |
| Hillary Close | NN11 0SN |
| Homefield | NN11 4BA |
| Hudson Close | NN11 0TU |
| Inlands Close | NN11 4DG |
| Inlands Rise | NN11 4DQ |
| Joseph Priestley Court | NN11 4HD |
| Jubilee Road | NN11 9HB |
| Kenilworth Close | NN11 4AH |
| Kingsley Avenue | NN11 4AN NN11 4BF |
| Larch Drive | NN11 0XJ |
| Livingstone Road | NN11 0RG |
| Lodge Road | NN11 4FP NN11 4GP |
| London Road | NN11 4DA NN11 4DB NN11 4DT NN11 4EA NN11 4BZ NN11 4DS NN11 4DY |
| Long March | NN11 4NR |
| Magellan Close | NN11 0TT |
| Magnolia Drive | NN11 0XA |
| Mallory Way | NN11 0UN |
| Manor Road | NN11 4EF |
| Market Square | NN11 4BH NN11 4XG |
| May Bank | NN11 4BB |
| Nansen Close | NN11 0TQ |
| New Street | NN11 4BS NN11 4BT NN11 4BU |
| Newlands | NN11 4DU |
| North Street | NN11 4GJ NN11 4WL NN11 4GH |
| Oak Grove | NN11 0XG |
| Osprey Drive | NN11 0XP |
| Oxford Close | NN11 4XZ |
| Oxford Street | NN11 4AD |
| Park Leys | NN11 4AS |
| Peartree Close | NN11 0XB |
| Poplar Close | NN11 0XF |
| Primrose Hill | NN11 4GE NN11 4GF |
| Priory Close | NN11 4EH |
| Raleigh Court | NN11 0TN |
| Rhodes Close | NN11 0TS |
| Roche Close | NN11 4AZ |
| Roman Way | NN11 0RW |
| Rose Court | NN11 4FQ |
| Rosewood Close | NN11 0UA |
| Scott Close | NN11 0RH |
| Shackleton Drive | NN11 0RE NN11 0RF |
| Sharman Close | NN11 0UL |
| Sheaf Street | NN11 4AA NN11 4AB |
| South Place | NN11 9HR |
| South Way | NN11 4GL |
| Spinney Rise | NN11 4DL |
| Spring Close | NN11 4HG |
| Spring Gardens | NN11 4XY |
| St Augustin Way | NN11 4EG NN11 4EQ |
| St James Close | NN11 4XF |
| St James Street | NN11 4AG |
| St Johns Square | NN11 4FG |
| Stanley Way | NN11 0SD NN11 0SE |
| Station Close | NN11 4FJ |
| Swann Dale | NN11 4DF |
| Swann Dale Close | NN11 4DZ |
| Sycamore Close | NN11 0TZ |
| Tavern Lane | NN11 4ET |
| Teal Close | NN11 0XQ |
| The Croft | NN11 4EL |
| The Dingle | NN11 4DJ |
| The Firs | NN11 0PX |
| The Glebe | NN11 4HR |
| The Greenway | NN11 4EE |
| The Inlands | NN11 4DD NN11 4DE |
| The Maples | NN11 4BY |
| The Pasture | NN11 4AU |
| The Pyghtles | NN11 9HP |
| The Rowans | NN11 0QA |
| The Slade | NN11 4HH NN11 4HP |
| The Westway | NN11 4ED |
| The Willows | NN11 0PY |
| Thomas Webb Close | NN11 4BE NN11 4BP |
| Vicar Lane | NN11 4GB NN11 4GA NN11 4GD |
| Warwick Street | NN11 4AJ NN11 4AL NN11 4NE NN11 4XB |
| Welton Road | NN11 0PP NN11 0PQ NN11 0PS NN11 0PW NN11 0JA |
| West View | NN11 9HS |
| Western Avenue | NN11 9EZ |
| Western Close | NN11 9RS |
| Western Row | NN11 4UD |
| Williams Terrace | NN11 9EP |
| Wimborne Place | NN11 0XY NN11 0XZ NN11 0YP |
| Windsor Close | NN11 4AX |
| NN11 4YP |
Transport near Abbey South
- FAQ
- Price Paid By Year
- Property Type Price
Frequently asked questions about Abbey South
What is the average price for a property for sale in Abbey South?
The average price for a property for sale in Abbey South is £249,458. This amount is 15% lower than the average price in Daventry. There are 1,991 property listings for sale in Abbey South.
What streets have the most expensive properties for sale in Abbey South?
The streets with the most expensive properties for sale in Abbey South are Ashby Park at an average of £680,000, Astbury Close at an average of £446,750 and Kingsley Avenue at an average of £432,500.
What streets have the most affordable properties for sale in Abbey South?
The streets with the most affordable properties for sale in Abbey South are Nansen Close at an average of £105,000, Vicar Lane at an average of £112,200 and Station Close at an average of £135,000.
Which train stations are available in or near Abbey South?
Some of the train stations available in or near Abbey South are Long Buckby, Rugby and Northampton.
Property Price Paid in Abbey South by Year
The average sold property price by year was:
| Year | Average Sold Price | Price Change |
Sold Properties
|
|---|---|---|---|
| 2025 | £246,544 | -2% |
82 Properties |
| 2024 | £252,355 | 1% |
105 Properties |
| 2023 | £248,624 | -2% |
78 Properties |
| 2022 | £252,930 | 9% |
124 Properties |
| 2021 | £229,078 | 5% |
123 Properties |
| 2020 | £218,282 | 7% |
99 Properties |
| 2019 | £202,214 | -8% |
94 Properties |
| 2018 | £218,392 | 9% |
128 Properties |
| 2017 | £198,531 | -2% |
107 Properties |
| 2016 | £202,391 | 14% |
110 Properties |
| 2015 | £173,463 | 4% |
116 Properties |
| 2014 | £166,696 | 6% |
137 Properties |
| 2013 | £156,459 | -1% |
92 Properties |
| 2012 | £157,647 | 4% |
90 Properties |
| 2011 | £151,726 | 5% |
99 Properties |
| 2010 | £143,508 | -1% |
80 Properties |
| 2009 | £144,782 | -2% |
74 Properties |
| 2008 | £147,614 | -8% |
87 Properties |
| 2007 | £159,302 | 2% |
192 Properties |
| 2006 | £156,401 | 4% |
192 Properties |
| 2005 | £150,521 | 7% |
141 Properties |
| 2004 | £139,815 | 7% |
183 Properties |
| 2003 | £130,136 | 17% |
196 Properties |
| 2002 | £107,954 | 9% |
186 Properties |
| 2001 | £97,925 | 19% |
245 Properties |
| 2000 | £79,045 | 9% |
199 Properties |
| 1999 | £71,614 | 9% |
237 Properties |
| 1998 | £65,322 | 3% |
198 Properties |
| 1997 | £63,250 | 5% |
318 Properties |
| 1996 | £60,153 | 8% |
316 Properties |
| 1995 | £55,346 | - |
215 Properties |
Property Price per Property Type in Abbey South
Here you can find historic sold price data in order to help with your property search.
The average Property Paid Price for specific property types in the last three years are:
| Property Type | Average Sold Price | Sold Properties |
|---|---|---|
| Flat | £127,292.00 | 32 Flats |
| Semi Detached House | £231,267.00 | 118 Semi Detached Houses |
| Detached House | £357,495.00 | 72 Detached Houses |
| Terraced House | £209,395.00 | 43 Terraced Houses |


