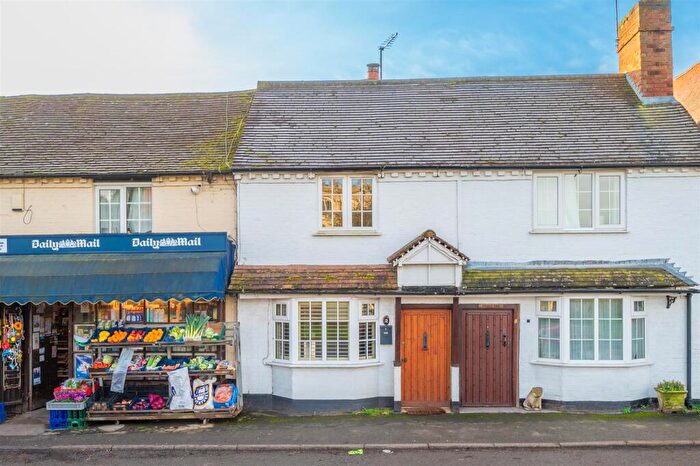
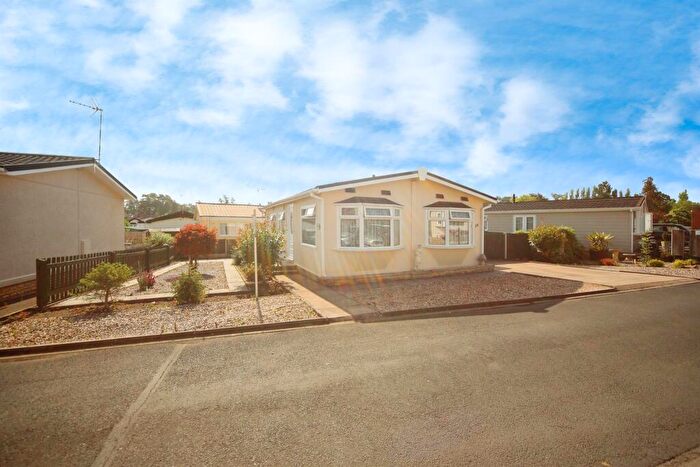
Houses for sale & to rent in Henley, Henley-in-arden
House Prices in Henley
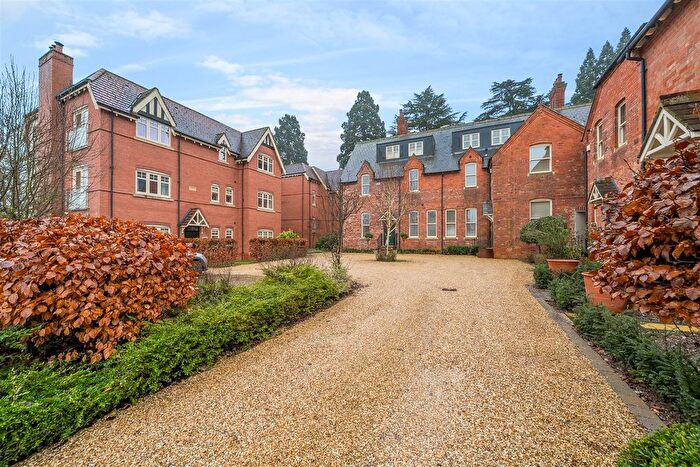
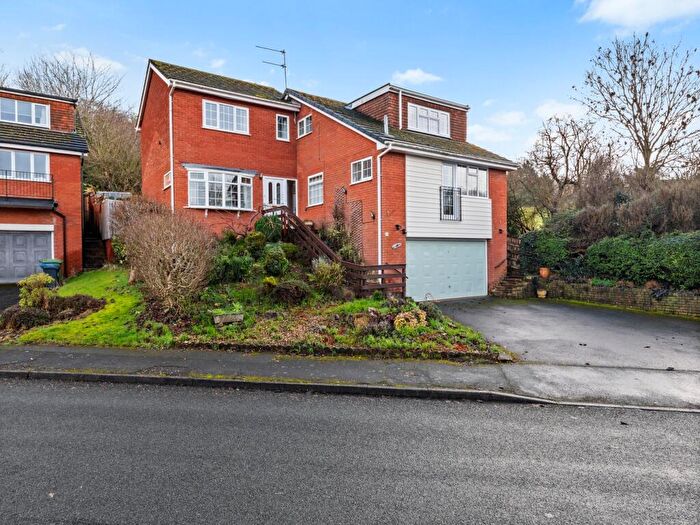
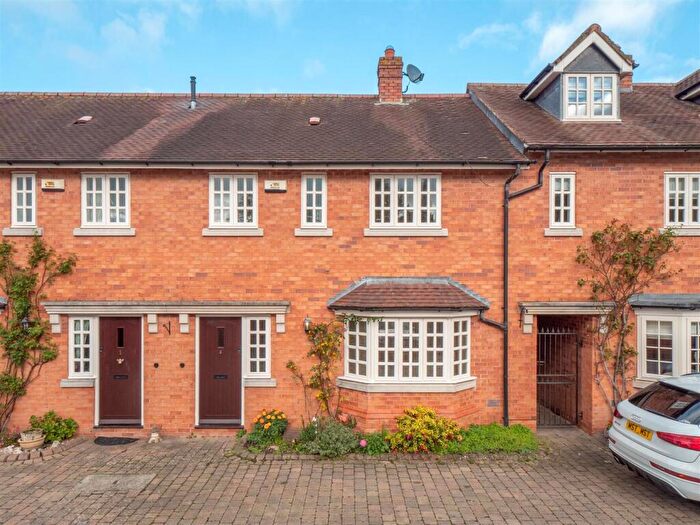
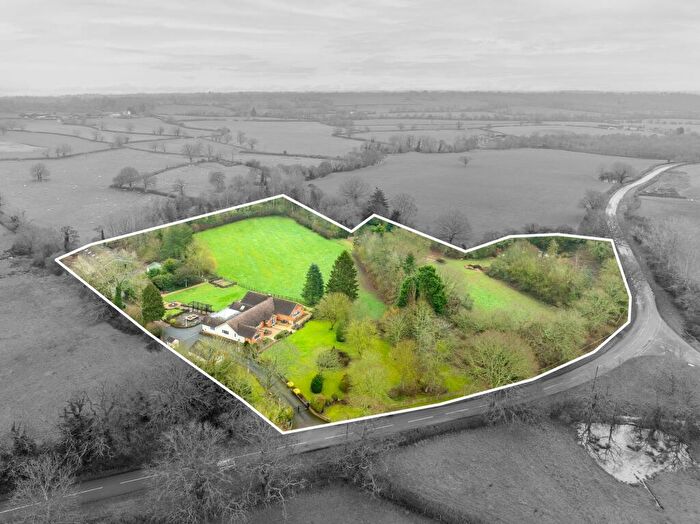
Properties in Henley have an average house price of £442,517.00 and had 204 Property Transactions within the last 3 years¹.
Henley is an area in Henley-in-arden, Warwickshire with 1,756 households², where the most expensive property was sold for £1,670,000.00.
Properties for sale in Henley
Roads and Postcodes in Henley
Navigate through our locations to find the location of your next house in Henley, Henley-in-arden for sale or to rent.
| Streets | Postcodes |
|---|---|
| Alcester Road | B95 6AY B95 6BG B95 6BQ |
| Alne Close | B95 5JZ |
| Arden Close | B95 5LW |
| Arden Road | B95 5LE B95 5LF B95 5LH B95 5LN B95 5LT |
| Ashbury Court | B95 5AF |
| Back Lane | B95 5SS |
| Barley Close | B95 5HU |
| Bear Close | B95 5HS |
| Bear Lane | B95 5HR B95 5JJ |
| Beaudesert Lane | B95 5JY |
| Beaudesert Place | B95 5BF |
| Becks Croft | B95 5FS |
| Beechcroft | B95 5AQ |
| Beldesert Close | B95 5JU |
| Birmingham Road | B95 5QA B95 5QB B95 5QR |
| Blackford Hill | B95 5DG B95 5DQ |
| Brook End Close | B95 5JE |
| Brook End Drive | B95 5JA B95 5JD B95 5JF |
| Buckley Green | B95 5QE B95 5QF |
| Camp Lane | B95 5QG B95 5QJ B95 5QP B95 5QQ |
| Castle Close | B95 5LR |
| Castle Road | B95 5LP B95 5LS |
| Cherry Orchard | B95 5JW |
| Chestnut Walk | B95 5GN B95 5GP B95 5JN |
| Chingley Bank | B95 5LX |
| De Montfort Court | B95 5BL B95 5HX |
| Doctors Lane | B95 5AW |
| Edge Lane | B95 5DS B95 5DT |
| Edstone | B95 6DB B95 6DD B95 6DL |
| Fieldhouse Close | B95 5DF |
| Glenhurst Road | B95 5HZ |
| Gorse Lane | B95 6BL |
| Greengates | B95 5FR |
| Grey Mill Lane | B95 6HL |
| Harris Close | B95 5DE |
| Harris Mews | B95 5DN |
| High Street | B95 5AA B95 5AG B95 5AN B95 5AT B95 5AU B95 5BA B95 5BG B95 5BN B95 5BS B95 5BX B95 5BY B95 5FH |
| Johnson Place | B95 5AE |
| Littleworth | B95 6AG |
| Liveridge Hill | B95 5QX |
| Market Close | B95 5FE |
| Market Way | B95 5FD |
| Mayfield Drive | B95 5JG |
| Mayswood Road | B95 6AT B95 6AU B95 6AX |
| Meadow Road | B95 5LA B95 5LB B95 5LD |
| Millfield Court | B95 5AD |
| Mount Road | B95 5LU |
| New Road | B95 5HY |
| Orchard Rise | B95 5FL |
| Pennyford Lane | B95 6EY B95 6EZ B95 6HB B95 6HE |
| Pettiford Lane | B95 6AH |
| Pound Field | B95 6AQ |
| Prince Harry Road | B95 5DD |
| Riverside Gardens | B95 5JX |
| Rose Avenue | B95 5JR |
| Salters Lane | B95 6DN |
| School House Mews | B95 5FP |
| School Road | B95 5BP |
| St Johns Close | B95 5JB |
| St Nicholas Road | B95 5LL |
| Station Road | B95 5JL B95 5JP B95 5JQ |
| Stratford Road | B95 6AB B95 6AE B95 6AP B95 6AR B95 6AS B95 6BB B95 6BD B95 6BE B95 6BY B95 6BZ B95 6DE B95 6DF B95 6DG |
| The Coach Houses | B95 5FN |
| The Crescent | B95 6DW |
| The Croft | B95 5DY |
| The Dale | B95 6AZ |
| The Horsefair | B95 5BE |
| The Square | B95 6BA |
| The Tanyard | B95 5AJ |
| The White House | B95 5GA |
| The Yew Trees | B95 5BQ |
| Tudor Court | B95 5AP |
| Warwick Road | B95 5BH B95 5BJ B95 5FF |
| Wawensmere Road | B95 6BN B95 6BS B95 6BW |
| Whitley Hill | B95 5DJ B95 5DL |
| Whitley Road | B95 5LJ |
| William James Way | B95 5GB |
| Wootton Rise | B95 6BJ B95 6BU |
| Yew Tree Gardens | B95 5HP |
| B95 5QU |
Transport near Henley
-
Henley-In-Arden Station
-
Wootton Wawen Station
-
Bearley Station
-
Danzey Station
-
Claverdon Station
-
Wilmcote Station
-
Hatton Station
-
Lapworth Station
-
Wood End Station
- FAQ
- Price Paid By Year
- Property Type Price
Frequently asked questions about Henley
What is the average price for a property for sale in Henley?
The average price for a property for sale in Henley is £442,517. This amount is 15% lower than the average price in Henley-in-arden. There are 428 property listings for sale in Henley.
What streets have the most expensive properties for sale in Henley?
The streets with the most expensive properties for sale in Henley are Whitley Hill at an average of £1,425,000, Birmingham Road at an average of £1,005,000 and Edstone at an average of £950,000.
What streets have the most affordable properties for sale in Henley?
The streets with the most affordable properties for sale in Henley are Beechcroft at an average of £140,000, William James Way at an average of £150,500 and Warwick Road at an average of £162,600.
Which train stations are available in or near Henley?
Some of the train stations available in or near Henley are Henley-In-Arden, Wootton Wawen and Bearley.
Property Price Paid in Henley by Year
The average sold property price by year was:
| Year | Average Sold Price | Price Change |
Sold Properties
|
|---|---|---|---|
| 2025 | £455,531 | 3% |
59 Properties |
| 2024 | £442,571 | 3% |
79 Properties |
| 2023 | £430,819 | -14% |
66 Properties |
| 2022 | £490,122 | 15% |
81 Properties |
| 2021 | £414,374 | 4% |
109 Properties |
| 2020 | £397,738 | 1% |
72 Properties |
| 2019 | £394,722 | -16% |
63 Properties |
| 2018 | £457,212 | 10% |
75 Properties |
| 2017 | £412,281 | 20% |
103 Properties |
| 2016 | £329,386 | -2% |
74 Properties |
| 2015 | £334,799 | 10% |
102 Properties |
| 2014 | £300,552 | 0,2% |
104 Properties |
| 2013 | £299,910 | 4% |
100 Properties |
| 2012 | £289,232 | -1% |
97 Properties |
| 2011 | £291,572 | -2% |
70 Properties |
| 2010 | £296,402 | 13% |
73 Properties |
| 2009 | £257,698 | -12% |
76 Properties |
| 2008 | £288,620 | -11% |
48 Properties |
| 2007 | £319,306 | 3% |
111 Properties |
| 2006 | £311,026 | 21% |
103 Properties |
| 2005 | £244,517 | -2% |
80 Properties |
| 2004 | £248,424 | -1% |
120 Properties |
| 2003 | £252,042 | 15% |
109 Properties |
| 2002 | £213,434 | 13% |
120 Properties |
| 2001 | £186,003 | 24% |
118 Properties |
| 2000 | £142,228 | 2% |
112 Properties |
| 1999 | £139,939 | 2% |
116 Properties |
| 1998 | £137,524 | 9% |
146 Properties |
| 1997 | £124,854 | 29% |
124 Properties |
| 1996 | £89,089 | 6% |
100 Properties |
| 1995 | £83,638 | - |
116 Properties |
Property Price per Property Type in Henley
Here you can find historic sold price data in order to help with your property search.
The average Property Paid Price for specific property types in the last three years are:
| Property Type | Average Sold Price | Sold Properties |
|---|---|---|
| Semi Detached House | £409,619.00 | 52 Semi Detached Houses |
| Detached House | £766,629.00 | 47 Detached Houses |
| Terraced House | £382,117.00 | 66 Terraced Houses |
| Flat | £198,001.00 | 39 Flats |

