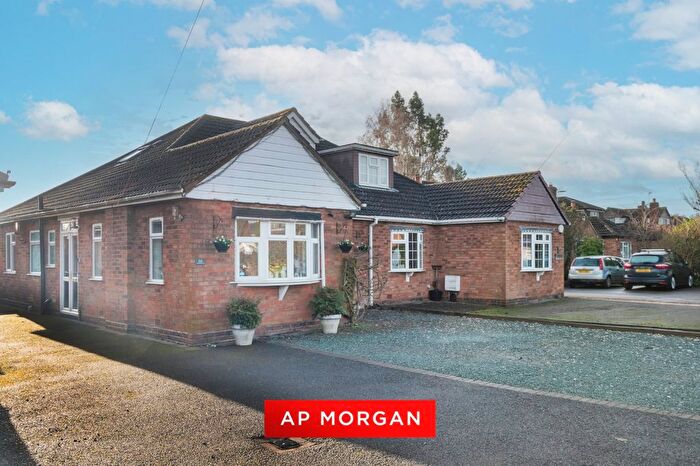
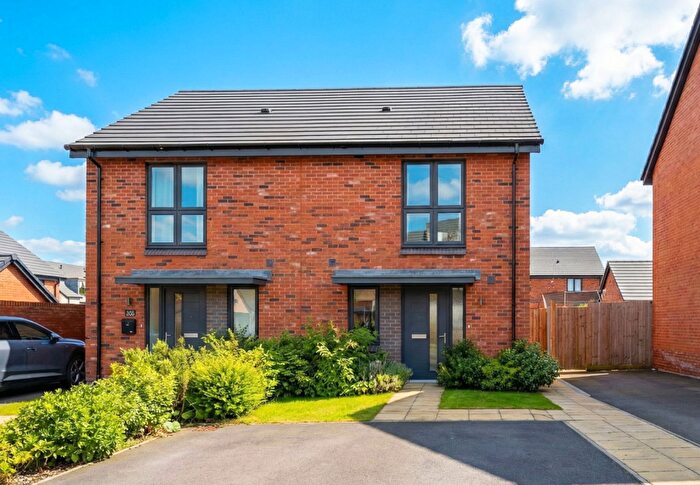
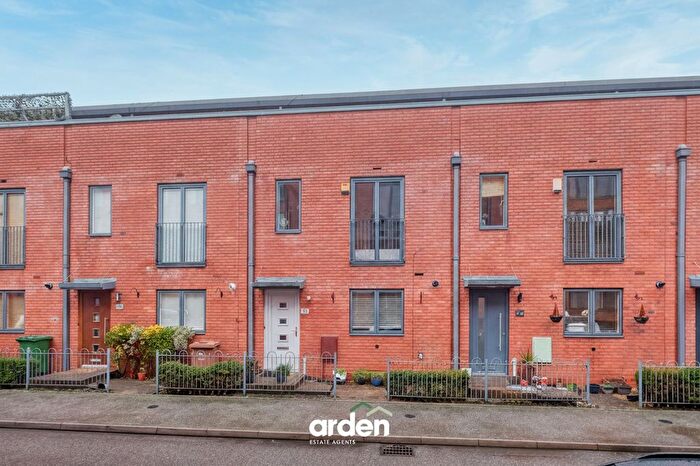
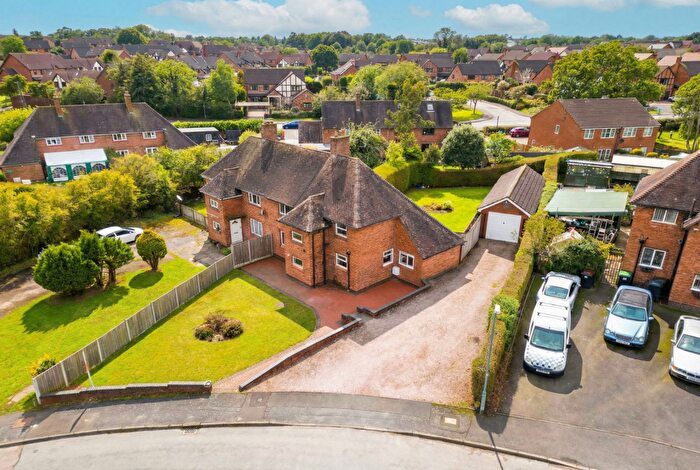
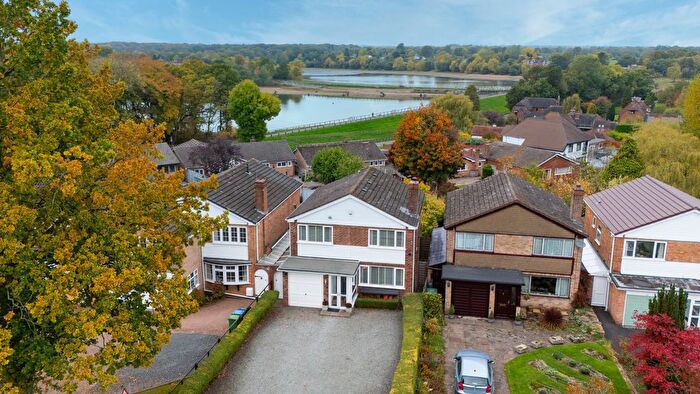
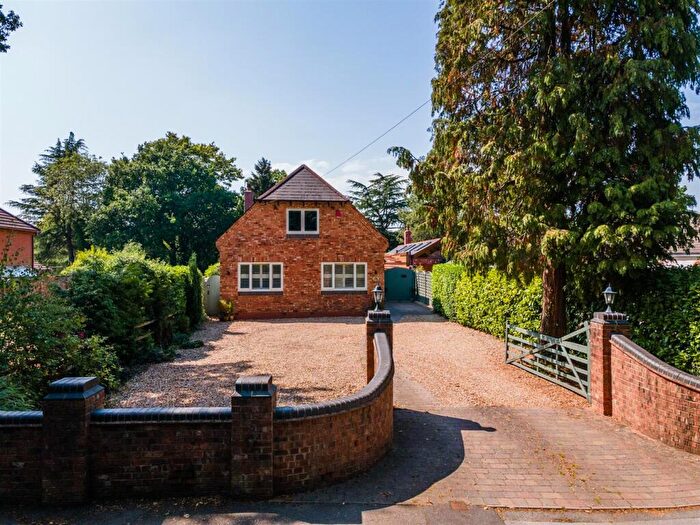
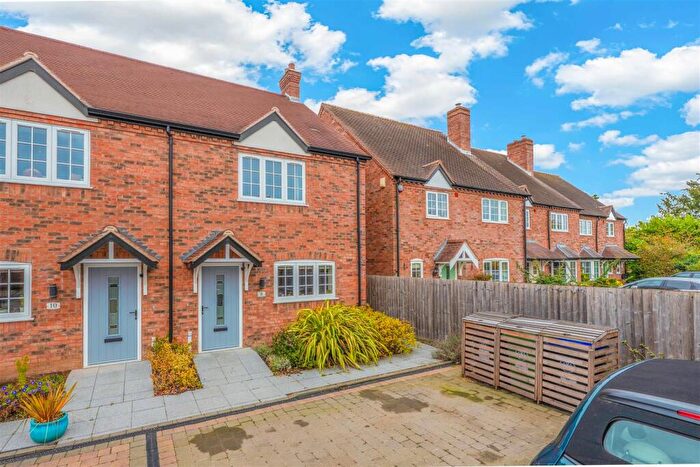
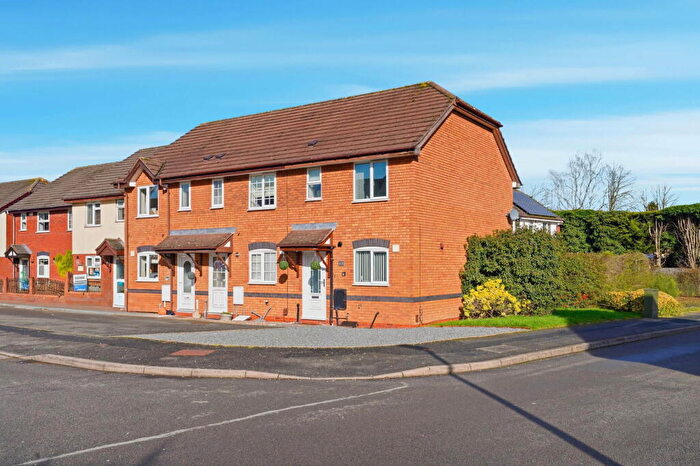
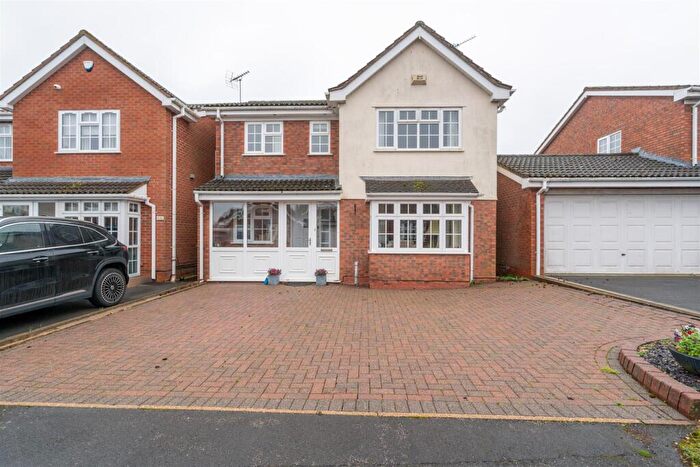
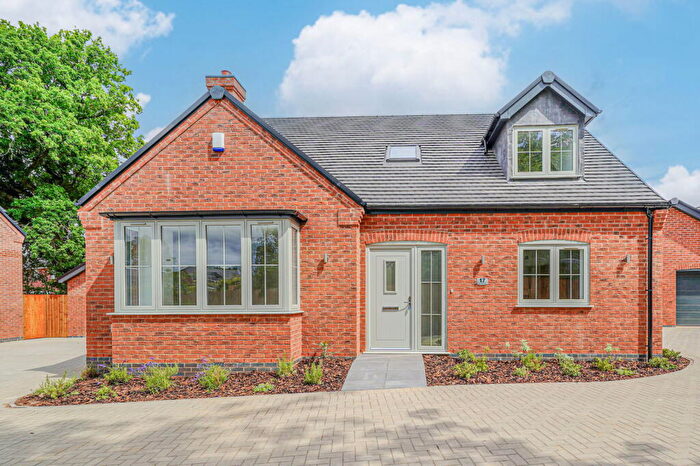
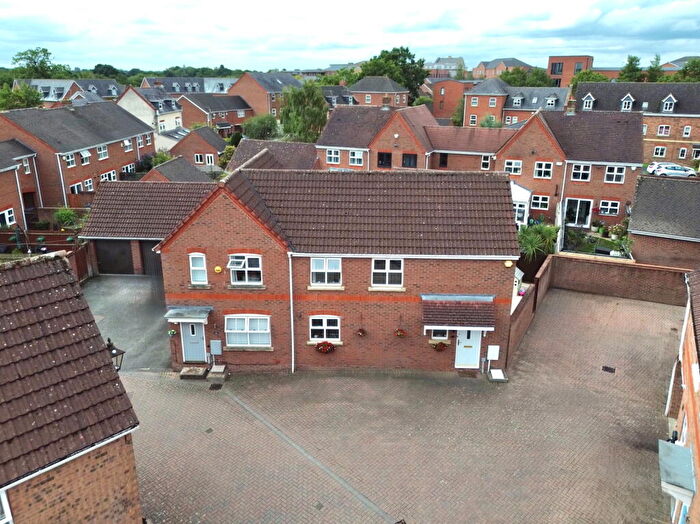
Houses for sale & to rent in Tanworth, Solihull
House Prices in Tanworth
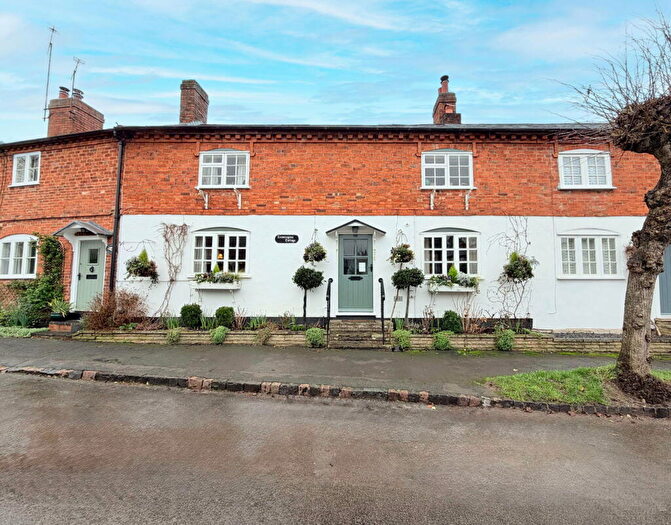
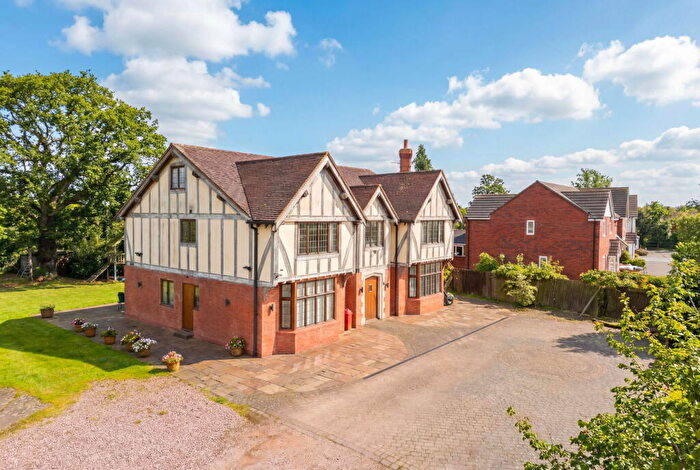
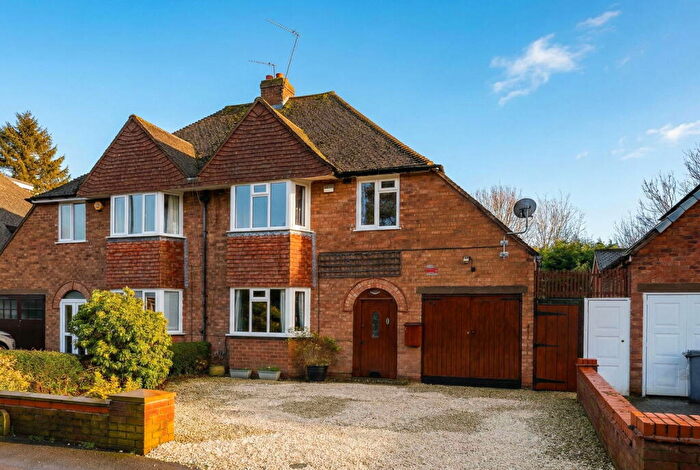
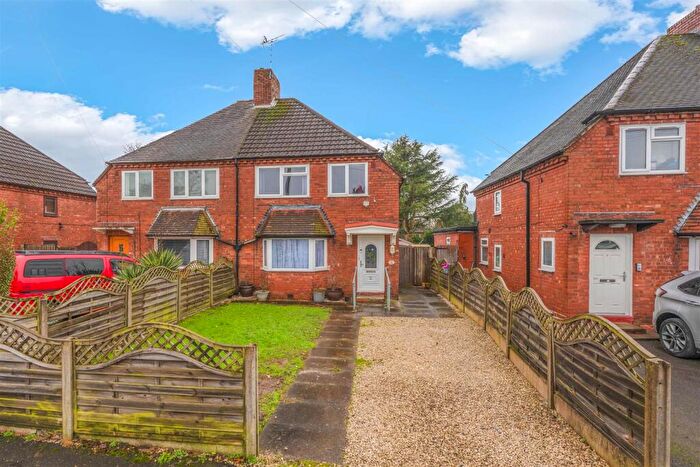
Properties in Tanworth have an average house price of £744,896.00 and had 96 Property Transactions within the last 3 years¹.
Tanworth is an area in Solihull, Warwickshire with 1,174 households², where the most expensive property was sold for £4,000,000.00.
Properties for sale in Tanworth
Roads and Postcodes in Tanworth
Navigate through our locations to find the location of your next house in Tanworth, Solihull for sale or to rent.
| Streets | Postcodes |
|---|---|
| Arden Leys | B94 5JE |
| Aspley Heath Lane | B94 5HU |
| Bates Lane | B94 5AP B94 5AR B94 5AS |
| Bell Field | B94 5AW |
| Biddles Hill | B94 5EN |
| Blind Lane | B94 5HS B94 5HT |
| Broad Lane | B94 5AA B94 5DP B94 5DY B94 5DZ B94 5HQ B94 5HR B94 5HX B94 5JA |
| Butts Lane | B94 5AQ |
| Cloweswood Lane | B94 5SE |
| Cut Throat Lane | B94 6SE B94 6SF |
| Danzey Green | B94 5BG B94 5BH B94 5BJ B94 5BQ |
| Doctors Close | B94 5AY |
| Doctors Hill | B94 5BS |
| Earlsmere | B94 6AJ |
| Earlswood Common | B94 5SJ B94 5SL B94 5SQ |
| Forde Hall Lane | B94 5AX B94 5AZ |
| Forshaw Heath Lane | B94 5LA B94 5LB B94 5LD B94 5LJ |
| Forshaw Heath Road | B94 5JU B94 5JX B94 5JZ |
| Juggins Lane | B94 5LL |
| Kemps Green Road | B94 5PN |
| Knowlebury Cross | B94 5AF |
| Leafy Lane | B94 6SQ |
| Malthouse Lane | B94 5DU B94 5DX B94 5RX B94 5RY B94 5RZ B94 5SA B94 5SB B94 5SD |
| Mile End | B94 5AG |
| Mill Lane | B94 5BB |
| Mows Hill Road | B94 5PP |
| Nuthurst Grange Lane | B94 5NL |
| Nuthurst Lane | B94 5PR |
| Penn Lane | B94 5HH B94 5HJ B94 5HL |
| Poolhead Lane | B94 5ED B94 5EH B94 5ES B94 5ET |
| Rams Hill Lane | B94 5BA |
| Rotherhams Oak Lane | B94 6RW |
| Rushbrook Lane | B94 5HP B94 5HW |
| Salter Street | B94 6BX B94 6BY |
| Shutt Lane | B94 6BZ B94 6DA |
| Small Lane | B94 5EJ |
| Springbrook Lane | B94 5SF B94 5SG |
| Station Cottages | B94 5BE |
| Stratford Road | B94 5NH B94 5NJ B94 5NN B94 5NW B94 5PB B94 5PD |
| The Common | B94 5SH |
| The Green | B94 5AJ B94 5AL B94 5AN |
| The Maltings | B94 5RU |
| The Mews | B94 5DF |
| Tinkers Lane | B94 6BH |
| Tithe Barn Lane | B94 5DJ |
| Tom Hill | B94 5AB |
| Umberslade | B94 5DB B94 5DQ |
| Umberslade Road | B94 5PY B94 5QA |
| Valley Road | B94 6AA |
| Vicarage Hill | B94 5EA B94 5EB |
| Warings Green Road | B94 6BL |
| Warren Close | B94 5RW |
| Well Lane | B94 5AH |
| Wood End Lane | B94 5DT |
Transport near Tanworth
- FAQ
- Price Paid By Year
- Property Type Price
Frequently asked questions about Tanworth
What is the average price for a property for sale in Tanworth?
The average price for a property for sale in Tanworth is £744,896. This amount is 6% lower than the average price in Solihull. There are 3,924 property listings for sale in Tanworth.
What streets have the most expensive properties for sale in Tanworth?
The streets with the most expensive properties for sale in Tanworth are Bates Lane at an average of £2,181,666, Tithe Barn Lane at an average of £1,400,000 and Umberslade Road at an average of £1,227,000.
What streets have the most affordable properties for sale in Tanworth?
The streets with the most affordable properties for sale in Tanworth are Aspley Heath Lane at an average of £427,000, Biddles Hill at an average of £502,333 and Doctors Close at an average of £507,500.
Which train stations are available in or near Tanworth?
Some of the train stations available in or near Tanworth are Wood End, The Lakes and Danzey.
Property Price Paid in Tanworth by Year
The average sold property price by year was:
| Year | Average Sold Price | Price Change |
Sold Properties
|
|---|---|---|---|
| 2025 | £665,603 | -16% |
30 Properties |
| 2024 | £772,145 | -2% |
34 Properties |
| 2023 | £790,281 | -18% |
32 Properties |
| 2022 | £936,251 | 17% |
37 Properties |
| 2021 | £774,017 | 3% |
77 Properties |
| 2020 | £753,051 | -4% |
39 Properties |
| 2019 | £781,773 | 25% |
44 Properties |
| 2018 | £582,555 | 2% |
35 Properties |
| 2017 | £570,529 | 4% |
51 Properties |
| 2016 | £549,793 | -8% |
39 Properties |
| 2015 | £592,111 | 15% |
44 Properties |
| 2014 | £506,080 | 1% |
51 Properties |
| 2013 | £498,674 | 11% |
37 Properties |
| 2012 | £443,302 | -32% |
24 Properties |
| 2011 | £586,462 | 9% |
28 Properties |
| 2010 | £531,468 | 31% |
33 Properties |
| 2009 | £366,416 | -19% |
18 Properties |
| 2008 | £434,559 | -39% |
33 Properties |
| 2007 | £602,999 | 20% |
50 Properties |
| 2006 | £481,836 | 15% |
50 Properties |
| 2005 | £409,415 | -20% |
40 Properties |
| 2004 | £491,528 | 24% |
50 Properties |
| 2003 | £375,077 | 8% |
45 Properties |
| 2002 | £344,559 | 7% |
63 Properties |
| 2001 | £321,713 | 24% |
51 Properties |
| 2000 | £245,565 | 15% |
48 Properties |
| 1999 | £209,084 | 9% |
52 Properties |
| 1998 | £189,467 | 5% |
47 Properties |
| 1997 | £179,345 | 16% |
60 Properties |
| 1996 | £149,958 | -6% |
37 Properties |
| 1995 | £159,008 | - |
54 Properties |
Property Price per Property Type in Tanworth
Here you can find historic sold price data in order to help with your property search.
The average Property Paid Price for specific property types in the last three years are:
| Property Type | Average Sold Price | Sold Properties |
|---|---|---|
| Semi Detached House | £472,247.00 | 24 Semi Detached Houses |
| Detached House | £878,438.00 | 65 Detached Houses |
| Terraced House | £439,657.00 | 7 Terraced Houses |

