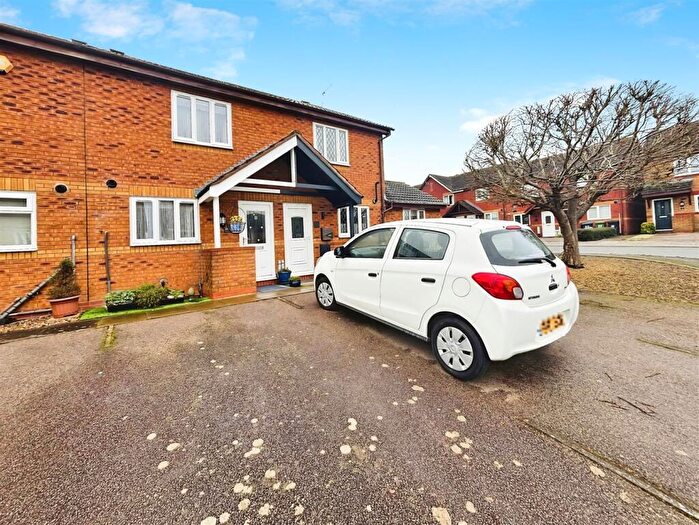
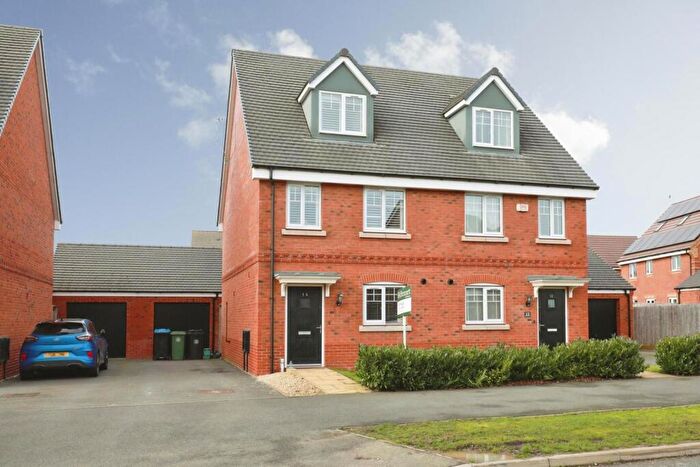
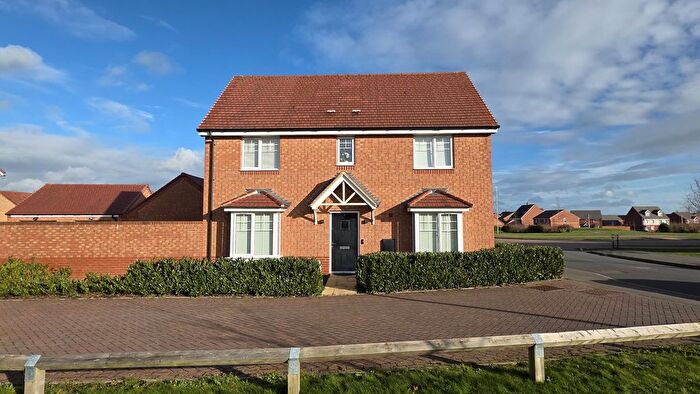
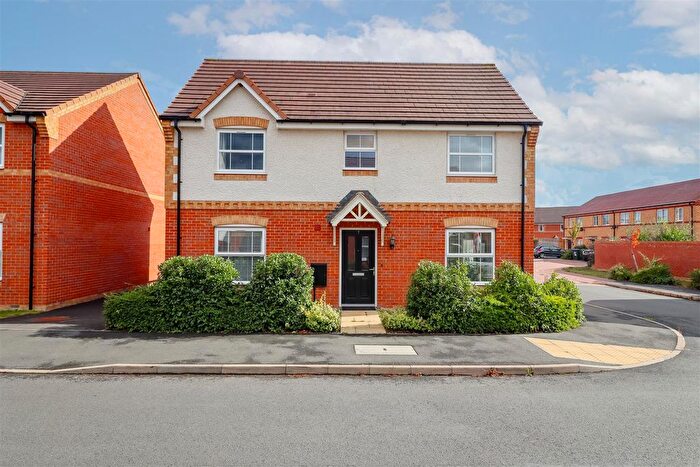
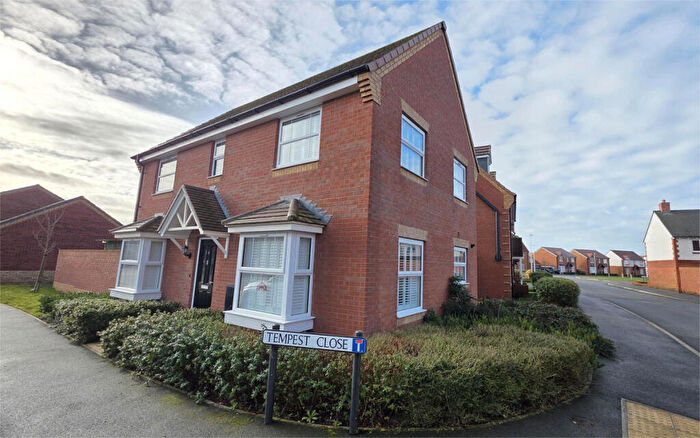
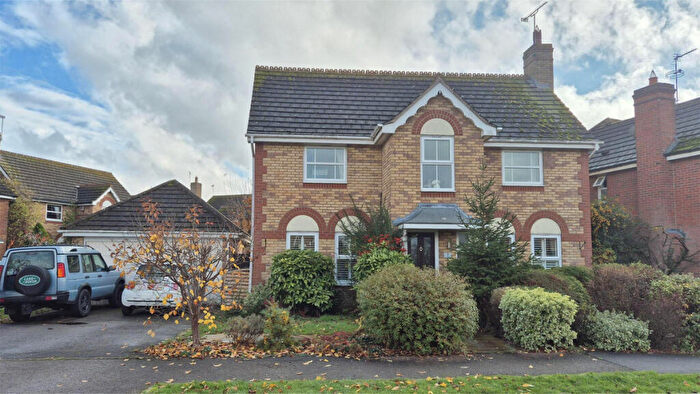
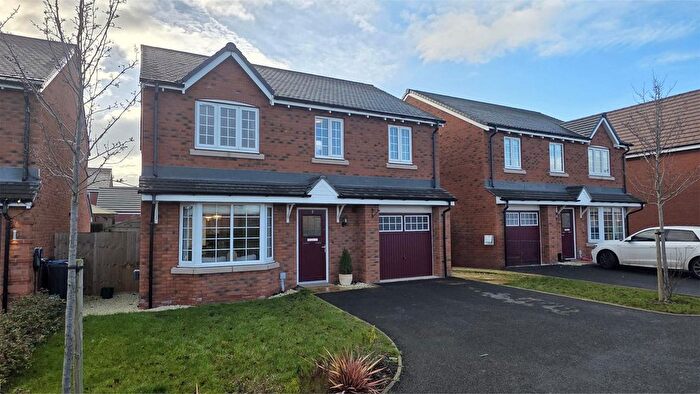
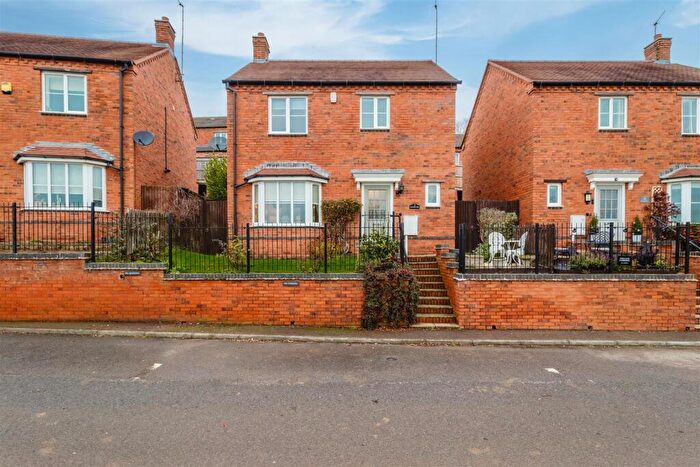
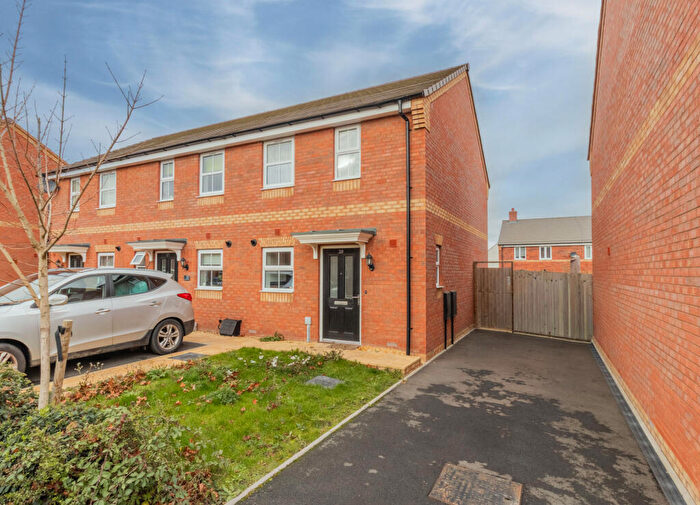
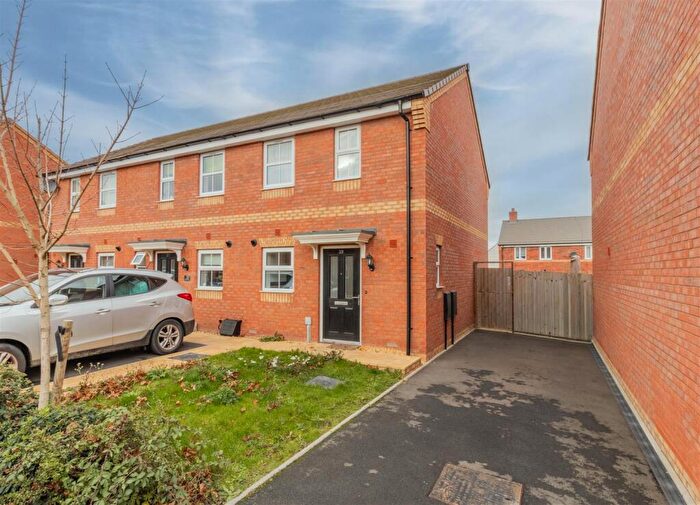
Houses for sale & to rent in Stockton And Napton, Southam
House Prices in Stockton And Napton
Properties in Stockton And Napton have an average house price of £418,319.00 and had 74 Property Transactions within the last 3 years¹.
Stockton And Napton is an area in Southam, Warwickshire with 905 households², where the most expensive property was sold for £1,350,000.00.
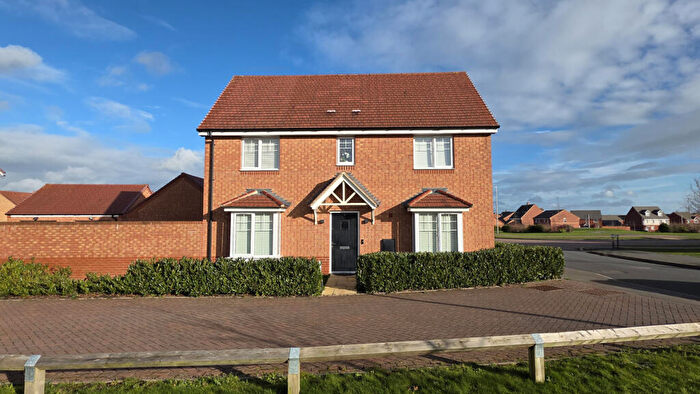
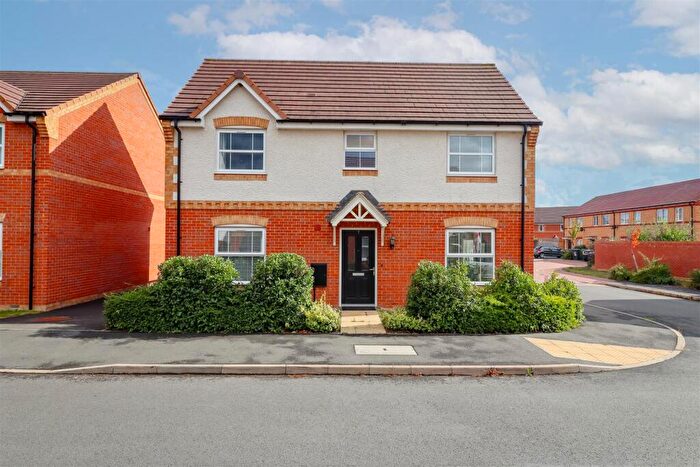
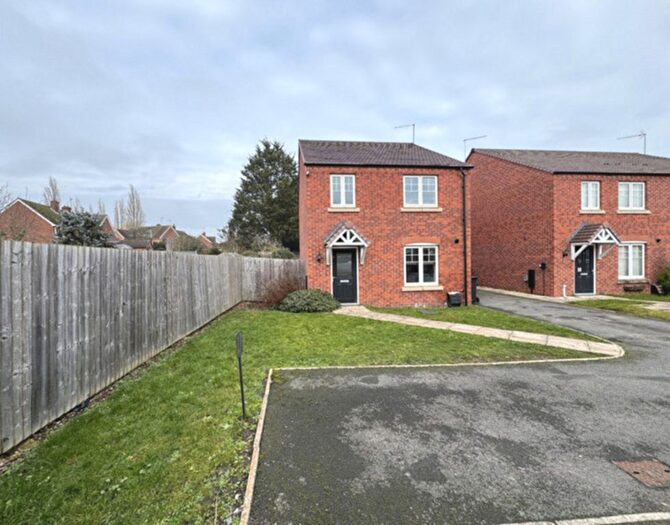
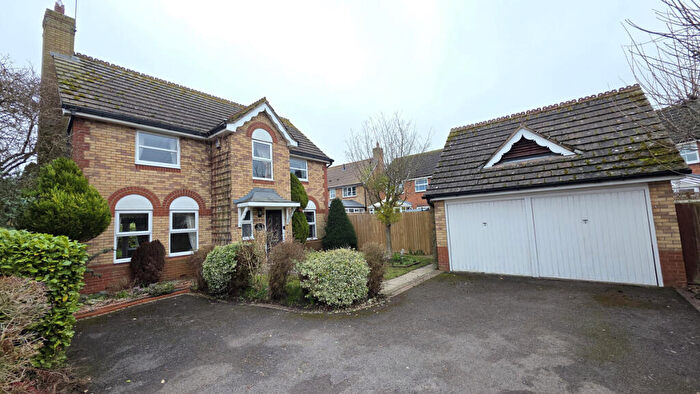
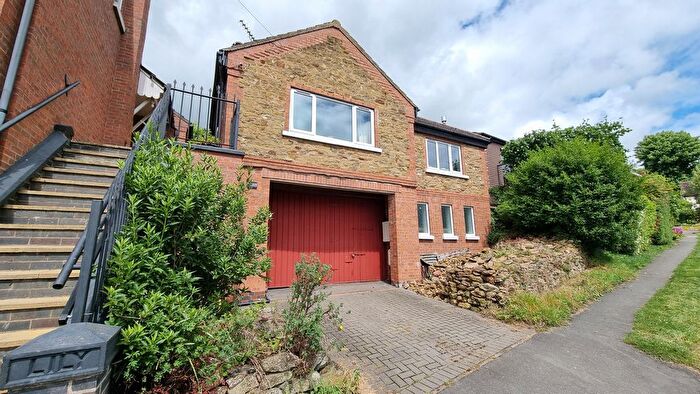
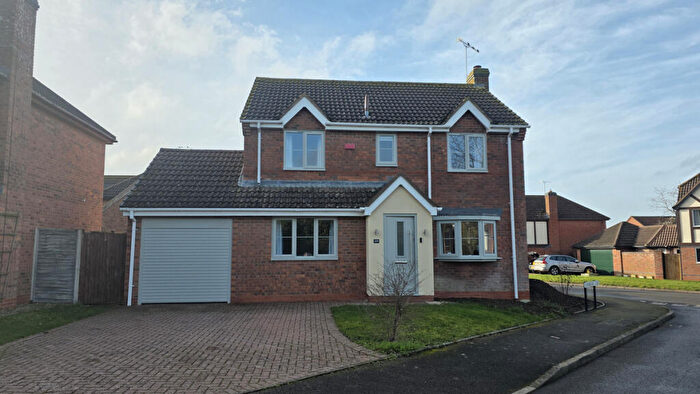
Properties for sale in Stockton And Napton
Roads and Postcodes in Stockton And Napton
Navigate through our locations to find the location of your next house in Stockton And Napton, Southam for sale or to rent.
| Streets | Postcodes |
|---|---|
| Becks Close | CV47 8JL |
| Becks Lane | CV47 8JJ |
| Brickyard Road | CV47 8NT |
| Butt Hill | CV47 8NE |
| Chapel Green | CV47 8PA |
| Chapel Lane | CV47 8PB |
| Church Street | CV47 8JG |
| Coxs Lane | CV47 8LW |
| Daventry Road | CV47 1NN |
| Dog Lane | CV47 8LT |
| Earles Close | CV47 8JQ |
| Elm Row | CV47 8JY |
| Fells Lane | CV47 8ND |
| Folly Lane | CV47 8NZ |
| George Street | CV47 8JS CV47 8JT |
| Glebe Close | CV47 8LG |
| Godsons Lane | CV47 8LX |
| Grange Farm Drive | CV47 8FT |
| Hackwell Bank | CV47 8FH |
| Hackwell Street | CV47 8LY |
| High Street | CV47 8JZ CV47 8LP CV47 8LZ CV47 8NB |
| Hillside | CV47 8NH |
| Hillside Croft | CV47 8NU |
| Holt Road | CV47 1AJ |
| Howcombe | CV47 8NP |
| Howcombe Gardens | CV47 8PD |
| Howcombe Lane | CV47 8NX |
| Laurel Drive | CV47 8FB |
| Manor Road | CV47 8JF |
| Mount Pleasant | CV47 8JW |
| Mount Pleasant Close | CV47 8JD |
| Napton Road | CV47 8JX CV47 8LA |
| New Street | CV47 8LR |
| Orchard Grove | CV47 8FN |
| Paddock Close | CV47 8JA |
| Pillory Green | CV47 8LN |
| Poplar Gardens | CV47 8PG |
| Poplar Road | CV47 8NS |
| Post Office Lane | CV47 8JR |
| Rectory Close | CV47 8LE |
| Rugby Road | CV47 8LB CV47 8LJ |
| School Hill | CV47 8FL CV47 8NN |
| School Street | CV47 8JE |
| Southam Road | CV47 8NG |
| St Lawrence Close | CV47 8LU |
| St Michaels Crescent | CV47 8JH |
| Stockton Road | CV47 8LD |
| Sycamore Close | CV47 8FD |
| The Butts | CV47 8NW |
| The Crescent | CV47 8LS |
| The Square | CV47 8JN |
| Tomlow Road | CV47 8HX |
| Top Lock Cottage | CV47 8LH |
| Tuckwell Close | CV47 8JP |
| Vicarage Place | CV47 8FJ |
| Vicarage Road | CV47 8NA |
| Victoria Terrace | CV47 8FG |
| CV47 8NR |
Transport near Stockton And Napton
-
Leamington Spa Station
-
Rugby Station
-
Warwick Station
-
Long Buckby Station
-
Warwick Parkway Station
-
Coventry Station
-
Canley Station
-
Banbury Station
-
Hatton Station
-
Tile Hill Station
- FAQ
- Price Paid By Year
- Property Type Price
Frequently asked questions about Stockton And Napton
What is the average price for a property for sale in Stockton And Napton?
The average price for a property for sale in Stockton And Napton is £418,319. This amount is 13% higher than the average price in Southam. There are 526 property listings for sale in Stockton And Napton.
What streets have the most expensive properties for sale in Stockton And Napton?
The streets with the most expensive properties for sale in Stockton And Napton are Daventry Road at an average of £800,000, Howcombe Gardens at an average of £787,500 and Vicarage Road at an average of £632,500.
What streets have the most affordable properties for sale in Stockton And Napton?
The streets with the most affordable properties for sale in Stockton And Napton are Elm Row at an average of £239,583, Hillside Croft at an average of £249,250 and George Street at an average of £251,500.
Which train stations are available in or near Stockton And Napton?
Some of the train stations available in or near Stockton And Napton are Leamington Spa, Rugby and Warwick.
Property Price Paid in Stockton And Napton by Year
The average sold property price by year was:
| Year | Average Sold Price | Price Change |
Sold Properties
|
|---|---|---|---|
| 2025 | £465,606 | 17% |
30 Properties |
| 2024 | £385,582 | -0,3% |
23 Properties |
| 2023 | £386,619 | 2% |
21 Properties |
| 2022 | £380,212 | 13% |
40 Properties |
| 2021 | £331,287 | 4% |
56 Properties |
| 2020 | £319,655 | -18% |
29 Properties |
| 2019 | £378,592 | 16% |
36 Properties |
| 2018 | £318,514 | -6% |
34 Properties |
| 2017 | £336,073 | 10% |
41 Properties |
| 2016 | £301,928 | -2% |
58 Properties |
| 2015 | £308,428 | 27% |
40 Properties |
| 2014 | £226,284 | -10% |
36 Properties |
| 2013 | £249,531 | -4% |
30 Properties |
| 2012 | £259,925 | 3% |
29 Properties |
| 2011 | £251,814 | 10% |
35 Properties |
| 2010 | £225,375 | -11% |
28 Properties |
| 2009 | £251,207 | 6% |
19 Properties |
| 2008 | £236,073 | -9% |
27 Properties |
| 2007 | £256,245 | 1% |
34 Properties |
| 2006 | £252,725 | 10% |
59 Properties |
| 2005 | £227,909 | 14% |
37 Properties |
| 2004 | £194,922 | -11% |
48 Properties |
| 2003 | £215,927 | 25% |
48 Properties |
| 2002 | £161,431 | 11% |
57 Properties |
| 2001 | £143,110 | 30% |
47 Properties |
| 2000 | £100,519 | -56% |
31 Properties |
| 1999 | £156,394 | 32% |
56 Properties |
| 1998 | £105,984 | 9% |
73 Properties |
| 1997 | £96,786 | 20% |
43 Properties |
| 1996 | £77,773 | -6% |
55 Properties |
| 1995 | £82,324 | - |
58 Properties |
Property Price per Property Type in Stockton And Napton
Here you can find historic sold price data in order to help with your property search.
The average Property Paid Price for specific property types in the last three years are:
| Property Type | Average Sold Price | Sold Properties |
|---|---|---|
| Semi Detached House | £348,888.00 | 18 Semi Detached Houses |
| Detached House | £535,160.00 | 37 Detached Houses |
| Terraced House | £269,891.00 | 16 Terraced Houses |
| Flat | £185,466.00 | 3 Flats |

