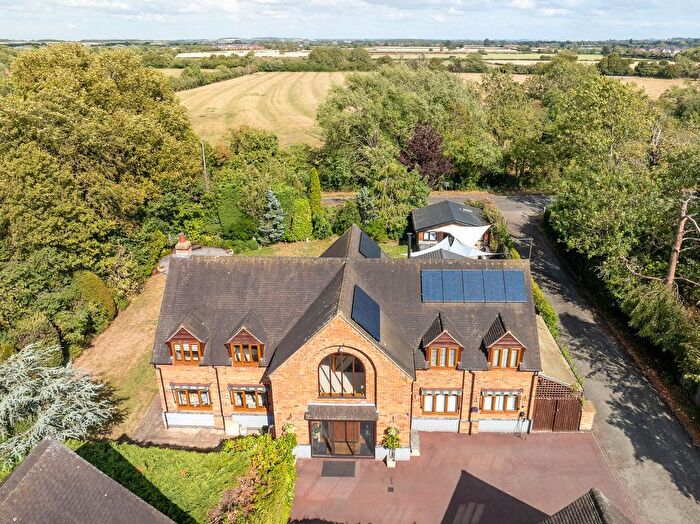
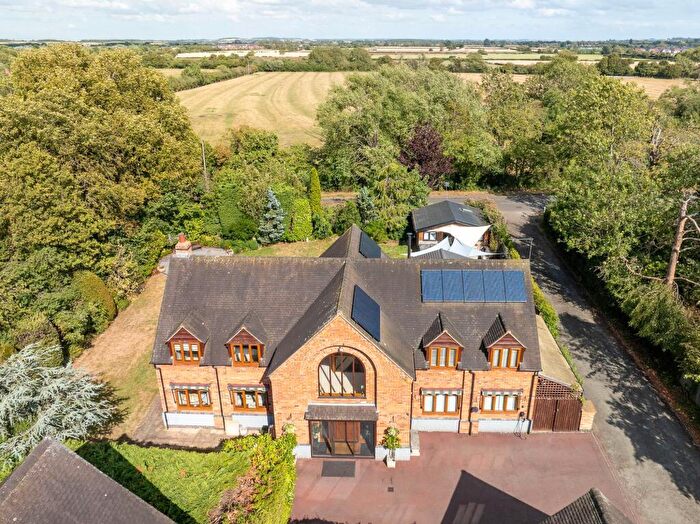
Houses for sale & to rent in Welford, Stratford-upon-avon
House Prices in Welford
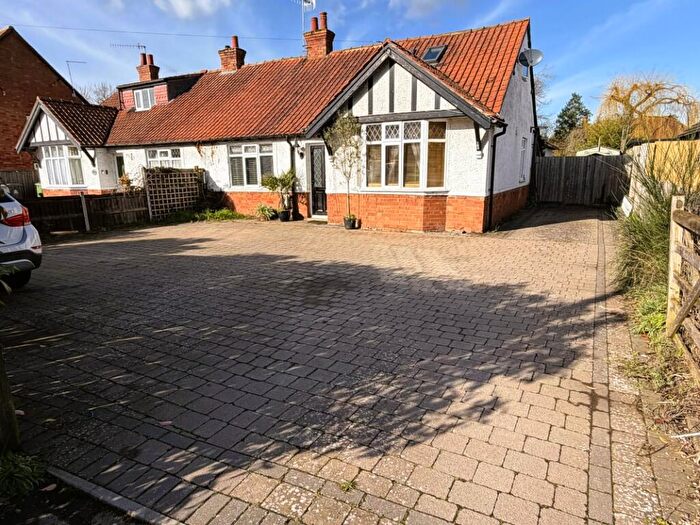
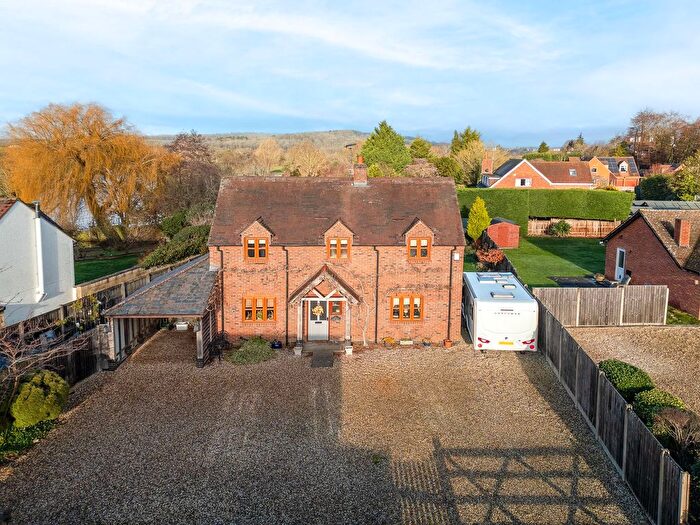
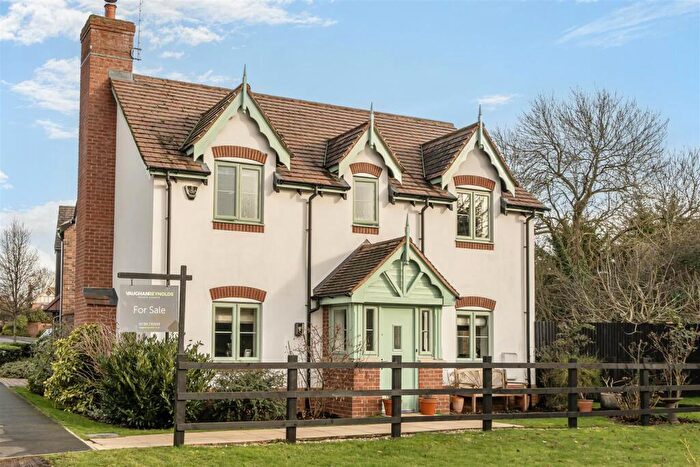
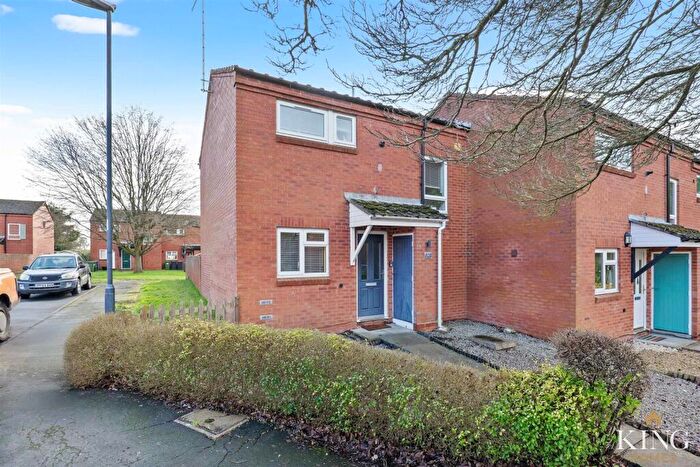
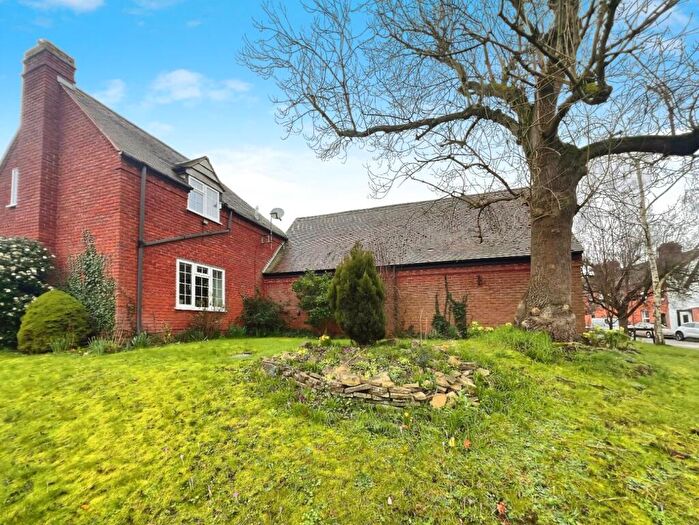
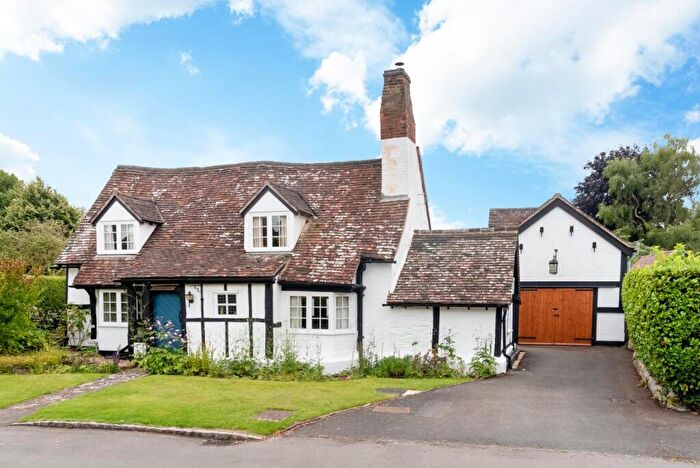
Properties in Welford have an average house price of £713,391.00 and had 81 Property Transactions within the last 3 years¹.
Welford is an area in Stratford-upon-avon, Warwickshire with 805 households², where the most expensive property was sold for £2,300,000.00.
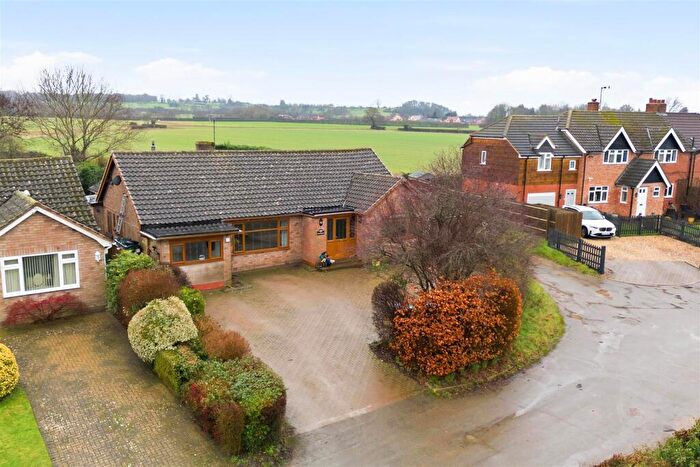
Properties for sale in Welford
Roads and Postcodes in Welford
Navigate through our locations to find the location of your next house in Welford, Stratford-upon-avon for sale or to rent.
| Streets | Postcodes |
|---|---|
| Barton Fields | CV37 8HH |
| Barton Road | CV37 8AT CV37 8BF CV37 8EY CV37 8EZ CV37 8HD CV37 8HG CV37 8HQ |
| Binton Road | CV37 8EB CV37 8PP CV37 8PT |
| Blundells Croft | CV37 8EP |
| Boat Lane | CV37 8EN |
| Braggington Lane | CV37 8BD |
| Campden Road | CV37 8JA CV37 8JF CV37 8LB CV37 8LN CV37 8LW |
| Chapel Close | CV37 8QJ |
| Chapel Row | CV37 8PZ |
| Chapel Street | CV37 8PX CV37 8QA CV37 8QE CV37 8QF |
| Church Bank | CV37 8PS |
| Church Field | CV37 8ES |
| Church Lane | CV37 8EL |
| Church Street | CV37 8EJ |
| Dighton Close | CV37 8HL |
| Duck Lane | CV37 8QD |
| Frog Lane | CV37 8EQ |
| Glebe Cottages | CV37 8AZ |
| Headland Close | CV37 8EU |
| Headland Rise | CV37 8ET |
| Headland Road | CV37 8ER CV37 8EX |
| High Street | CV37 8EA CV37 8EF |
| Holland Meadow | CV37 8JD |
| Hunt Hall Lane | CV37 8HE |
| Long Marston Road | CV37 8AE CV37 8EG |
| Milcote Road | CV37 8AD CV37 8JN CV37 8JX |
| Mill Lane | CV37 8EW |
| Millers Close | CV37 8QG |
| Orchard Close | CV37 8HA |
| Orchard Place | CV37 8HZ |
| Pools Close | CV37 8QB |
| Quineys Leys | CV37 8PU |
| Rainsford Close | CV37 8HY |
| Shipston Road | CV37 8LZ |
| Station Road | CV37 8JW |
| The Bungalows | CV37 8JE |
| The Close | CV37 8HS |
| The Nashes | CV37 8JB |
| The Square | CV37 8HT |
| The Terrace | CV37 8PY |
| Willicote Pastures | CV37 8JT CV37 8JU |
| Willow Bank | CV37 8HB |
| CV37 8AA CV37 8AB CV37 8AR CV37 8AU CV37 8AX CV37 8AY CV37 8BB CV37 8HR CV37 8HU CV37 8HX CV37 8JR CV37 8JY CV37 8JZ CV37 8LA CV37 8LD |
Transport near Welford
- FAQ
- Price Paid By Year
- Property Type Price
Frequently asked questions about Welford
What is the average price for a property for sale in Welford?
The average price for a property for sale in Welford is £713,391. This amount is 61% higher than the average price in Stratford-upon-avon. There are 2,552 property listings for sale in Welford.
What streets have the most expensive properties for sale in Welford?
The streets with the most expensive properties for sale in Welford are The Close at an average of £1,925,000, Church Bank at an average of £1,625,000 and Frog Lane at an average of £1,532,500.
What streets have the most affordable properties for sale in Welford?
The streets with the most affordable properties for sale in Welford are Willicote Pastures at an average of £223,333, The Square at an average of £270,000 and Headland Rise at an average of £318,300.
Which train stations are available in or near Welford?
Some of the train stations available in or near Welford are Stratford-Upon-Avon, Stratford Pkway and Wilmcote.
Property Price Paid in Welford by Year
The average sold property price by year was:
| Year | Average Sold Price | Price Change |
Sold Properties
|
|---|---|---|---|
| 2025 | £768,263 | 8% |
19 Properties |
| 2024 | £707,341 | 3% |
35 Properties |
| 2023 | £682,622 | -13% |
27 Properties |
| 2022 | £773,985 | 9% |
28 Properties |
| 2021 | £705,161 | 9% |
39 Properties |
| 2020 | £640,030 | 11% |
33 Properties |
| 2019 | £567,812 | 4% |
39 Properties |
| 2018 | £547,087 | 1% |
36 Properties |
| 2017 | £539,085 | 6% |
41 Properties |
| 2016 | £506,131 | -0,1% |
41 Properties |
| 2015 | £506,447 | -14% |
39 Properties |
| 2014 | £577,377 | 17% |
29 Properties |
| 2013 | £479,952 | -18% |
21 Properties |
| 2012 | £567,312 | 0,1% |
32 Properties |
| 2011 | £566,470 | 6% |
17 Properties |
| 2010 | £534,210 | 15% |
23 Properties |
| 2009 | £456,375 | -4% |
24 Properties |
| 2008 | £475,786 | 14% |
23 Properties |
| 2007 | £408,922 | 7% |
34 Properties |
| 2006 | £382,040 | -13% |
38 Properties |
| 2005 | £432,832 | 14% |
29 Properties |
| 2004 | £372,535 | 20% |
39 Properties |
| 2003 | £299,390 | -8% |
39 Properties |
| 2002 | £322,091 | 26% |
49 Properties |
| 2001 | £239,053 | -2% |
48 Properties |
| 2000 | £244,815 | 29% |
36 Properties |
| 1999 | £174,597 | 11% |
46 Properties |
| 1998 | £155,577 | -5% |
35 Properties |
| 1997 | £163,661 | 24% |
49 Properties |
| 1996 | £125,101 | -20% |
39 Properties |
| 1995 | £149,929 | - |
33 Properties |
Property Price per Property Type in Welford
Here you can find historic sold price data in order to help with your property search.
The average Property Paid Price for specific property types in the last three years are:
| Property Type | Average Sold Price | Sold Properties |
|---|---|---|
| Semi Detached House | £446,164.00 | 17 Semi Detached Houses |
| Detached House | £913,509.00 | 50 Detached Houses |
| Terraced House | £346,708.00 | 12 Terraced Houses |
| Flat | £182,000.00 | 2 Flats |

