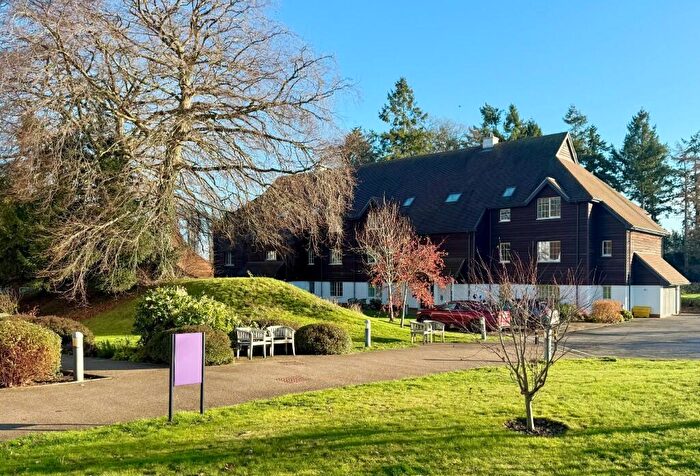
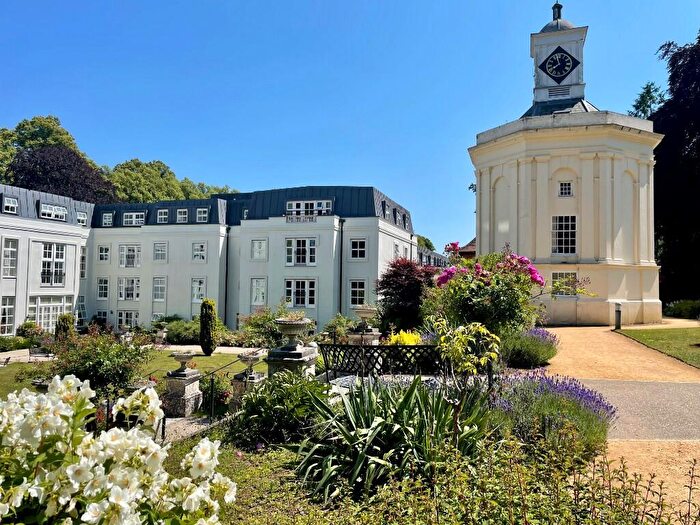
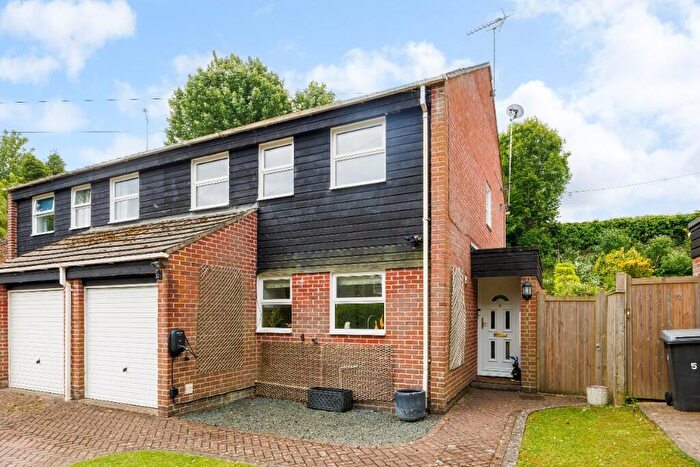
Houses for sale & to rent in Kintbury, Hungerford
House Prices in Kintbury
Properties in Kintbury have an average house price of £704,546.00 and had 114 Property Transactions within the last 3 years¹.
Kintbury is an area in Hungerford, West Berkshire with 1,281 households², where the most expensive property was sold for £4,300,000.00.
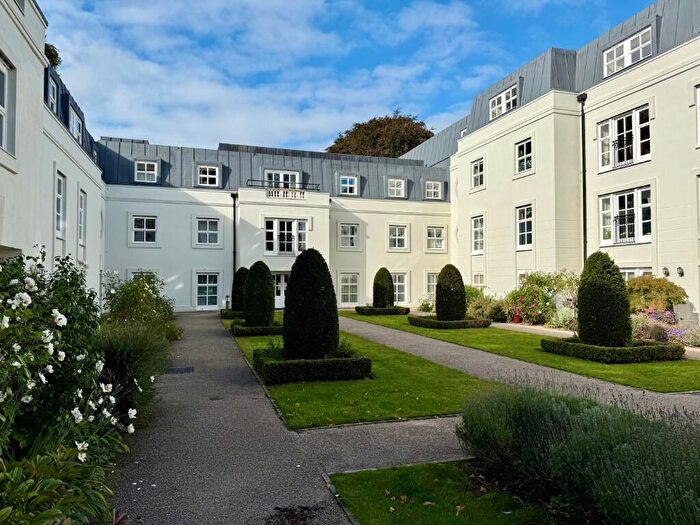
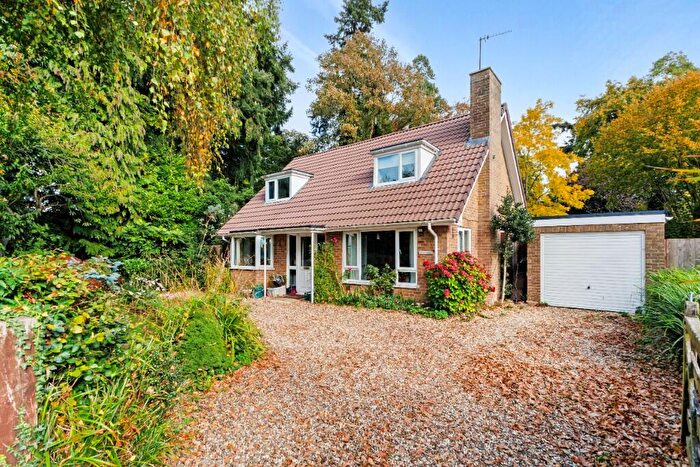
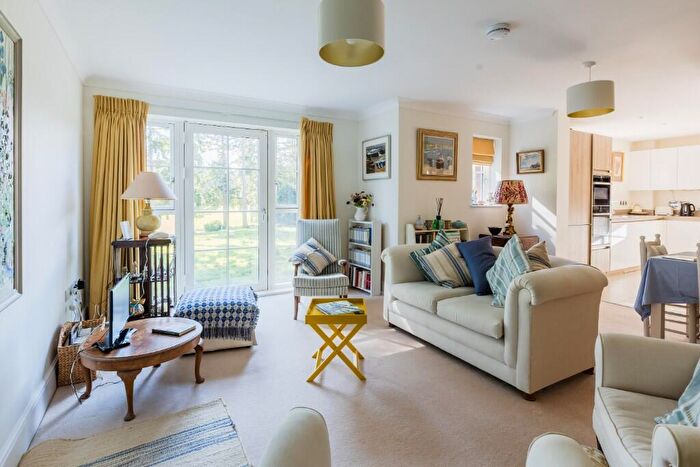
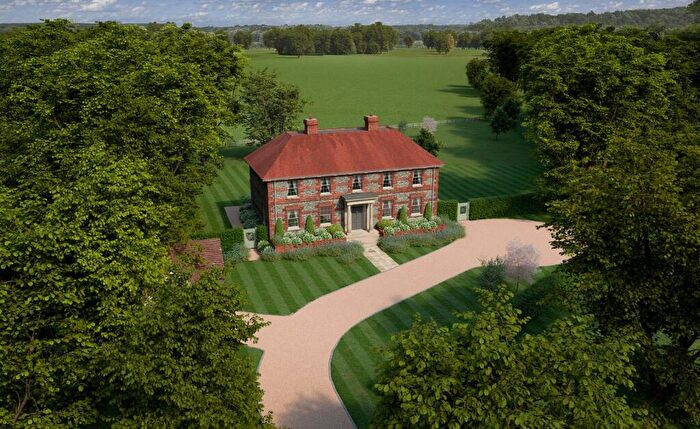
Properties for sale in Kintbury
Roads and Postcodes in Kintbury
Navigate through our locations to find the location of your next house in Kintbury, Hungerford for sale or to rent.
| Streets | Postcodes |
|---|---|
| Ashton Place | RG17 9XS |
| Barn Close | RG17 9YU |
| Bath Road | RG17 9SD |
| Blandys Hill | RG17 9UE RG17 9UF |
| Bradley Close | RG17 9UJ |
| Burtons Hill | RG17 9XJ RG17 9XL |
| Church Street | RG17 9TR |
| Clapton | RG17 9RP |
| Craven Close | RG17 9XF |
| Craven Road | RG17 9DX RG17 9DY RG17 9DZ |
| Craven Way | RG17 9XG |
| Crossways | RG17 9ST RG17 9SU |
| Dunn Crescent | RG17 9UH |
| Elizabeth Gardens | RG17 9TB |
| Folly Road | RG17 9QB |
| Forge Close | RG17 9XX |
| Gainsborough Avenue | RG17 9XN |
| Gladstone Close | RG17 9XU |
| Great Common | RG17 9QR |
| Great Severals | RG17 9SN |
| Harold Road | RG17 9UZ |
| Heads Lane | RG17 9QS |
| High Street | RG17 9TJ RG17 9TL RG17 9TN RG17 9TW |
| Holt Road | RG17 9UY |
| Hop Gardens | RG17 9AB |
| Hungerford Park | RG17 0UR |
| Ingles Edge | RG17 9PW |
| Inkpen Common | RG17 9QP RG17 9QT RG17 9QU |
| Inkpen Road | RG17 9TU RG17 9TX RG17 9UA |
| Irish Hill Road | RG17 9XA |
| Kennet Road | RG17 9XP RG17 9XW |
| Kintbury Square | RG17 9US |
| Lawrence Mead | RG17 9XT |
| Laylands Green | RG17 9UB RG17 9UD RG17 9UL RG17 9XH |
| Long Close | RG17 9XQ |
| Lower Green | RG17 9DN RG17 9DP RG17 9DS RG17 9DT RG17 9DW RG17 9QG |
| Mill Bank | RG17 9UW |
| Morrish Grove | RG17 9AD |
| Newbury Street | RG17 9UU RG17 9UX |
| Post Office Road | RG17 9PU RG17 9PX RG17 9PY |
| Pottery Lane | RG17 9QA |
| Queens Way | RG17 9XD RG17 9XE |
| Robins Hill | RG17 9QD |
| Sadlers Road | RG17 9EB |
| Station Road | RG17 9UN RG17 9UP RG17 9UR RG17 9UT |
| Templeton Road | RG17 9AA RG17 9SG RG17 9SH RG17 9SL RG17 9TH |
| The Cliffs | RG17 9TT |
| The Crescent | RG17 9TZ |
| The Croft | RG17 9TS |
| The Firs | RG17 9PT |
| The Green | RG17 9DD RG17 9XR |
| The Haven | RG17 9TY |
| The Old Sawmills | RG17 9EF |
| The Pentlands | RG17 9XB |
| Titcombe Lane | RG17 9SZ |
| Titcombe Way | RG17 9UG |
| Trapps Hill | RG17 9QN |
| Upper Denford Cottages | RG17 0PE |
| Upper Green | RG17 9PZ RG17 9QH RG17 9QJ RG17 9QL RG17 9QX |
| Wallingtons Road | RG17 9SP RG17 9SS RG17 9TP |
| Weavers Lane | RG17 9DL RG17 9QE |
| Winding Wood | RG17 9RJ RG17 9RN |
| RG17 0PD RG17 0PH RG17 0UN RG17 9DE RG17 9EH RG17 9QY RG17 9SX RG17 9SY |
Transport near Kintbury
-
Kintbury Station
-
Hungerford Station
-
Newbury Station
-
Bedwyn Station
-
Newbury Racecourse Station
-
Thatcham Station
- FAQ
- Price Paid By Year
- Property Type Price
Frequently asked questions about Kintbury
What is the average price for a property for sale in Kintbury?
The average price for a property for sale in Kintbury is £704,546. This amount is 43% higher than the average price in Hungerford. There are 241 property listings for sale in Kintbury.
What streets have the most expensive properties for sale in Kintbury?
The streets with the most expensive properties for sale in Kintbury are Inkpen Common at an average of £3,400,000, Lower Green at an average of £3,075,000 and Winding Wood at an average of £2,500,000.
What streets have the most affordable properties for sale in Kintbury?
The streets with the most affordable properties for sale in Kintbury are The Cliffs at an average of £240,000, The Haven at an average of £250,000 and Ashton Place at an average of £296,000.
Which train stations are available in or near Kintbury?
Some of the train stations available in or near Kintbury are Kintbury, Hungerford and Newbury.
Property Price Paid in Kintbury by Year
The average sold property price by year was:
| Year | Average Sold Price | Price Change |
Sold Properties
|
|---|---|---|---|
| 2025 | £662,707 | -14% |
35 Properties |
| 2024 | £757,499 | 8% |
35 Properties |
| 2023 | £695,705 | 26% |
44 Properties |
| 2022 | £515,041 | -15% |
52 Properties |
| 2021 | £594,783 | 16% |
64 Properties |
| 2020 | £502,191 | -31% |
28 Properties |
| 2019 | £656,022 | 26% |
44 Properties |
| 2018 | £484,446 | -13% |
43 Properties |
| 2017 | £549,341 | 13% |
56 Properties |
| 2016 | £478,027 | 16% |
43 Properties |
| 2015 | £402,249 | -21% |
46 Properties |
| 2014 | £486,188 | 9% |
90 Properties |
| 2013 | £443,490 | 11% |
45 Properties |
| 2012 | £396,296 | -10% |
38 Properties |
| 2011 | £434,022 | -2% |
34 Properties |
| 2010 | £442,420 | 5% |
39 Properties |
| 2009 | £418,912 | 3% |
34 Properties |
| 2008 | £406,826 | 11% |
39 Properties |
| 2007 | £362,129 | 6% |
69 Properties |
| 2006 | £339,300 | 1% |
53 Properties |
| 2005 | £335,239 | 2% |
54 Properties |
| 2004 | £327,907 | -6% |
69 Properties |
| 2003 | £346,735 | 32% |
57 Properties |
| 2002 | £234,120 | -22% |
68 Properties |
| 2001 | £286,699 | 21% |
72 Properties |
| 2000 | £226,870 | 11% |
53 Properties |
| 1999 | £201,710 | 19% |
85 Properties |
| 1998 | £162,879 | 23% |
61 Properties |
| 1997 | £125,355 | 2% |
68 Properties |
| 1996 | £123,367 | -3% |
46 Properties |
| 1995 | £127,644 | - |
57 Properties |
Property Price per Property Type in Kintbury
Here you can find historic sold price data in order to help with your property search.
The average Property Paid Price for specific property types in the last three years are:
| Property Type | Average Sold Price | Sold Properties |
|---|---|---|
| Semi Detached House | £446,981.00 | 26 Semi Detached Houses |
| Detached House | £1,037,764.00 | 52 Detached Houses |
| Terraced House | £319,684.00 | 19 Terraced Houses |
| Flat | £509,352.00 | 17 Flats |

