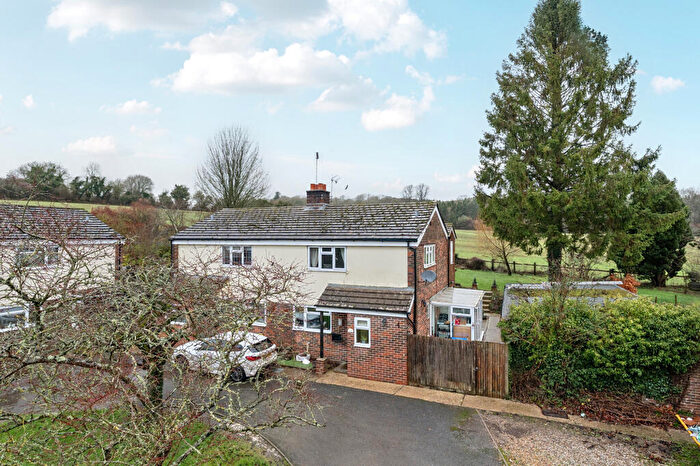
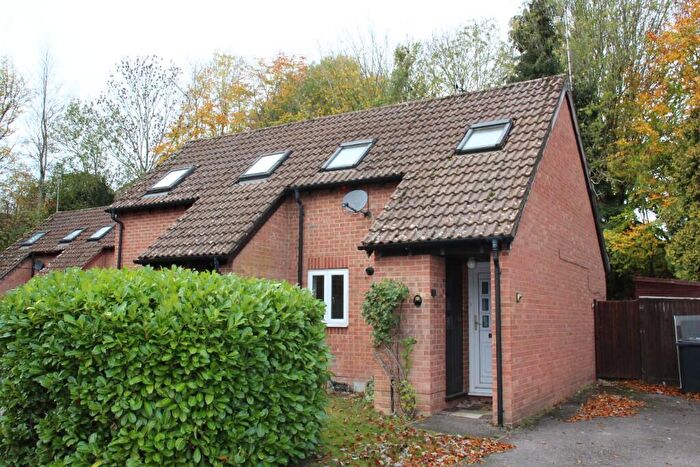
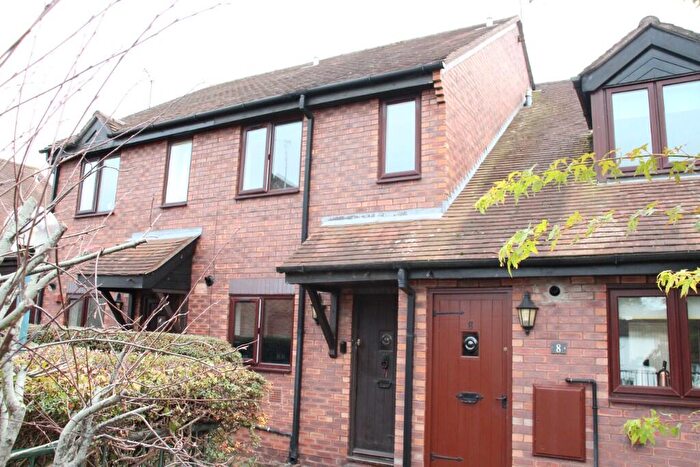
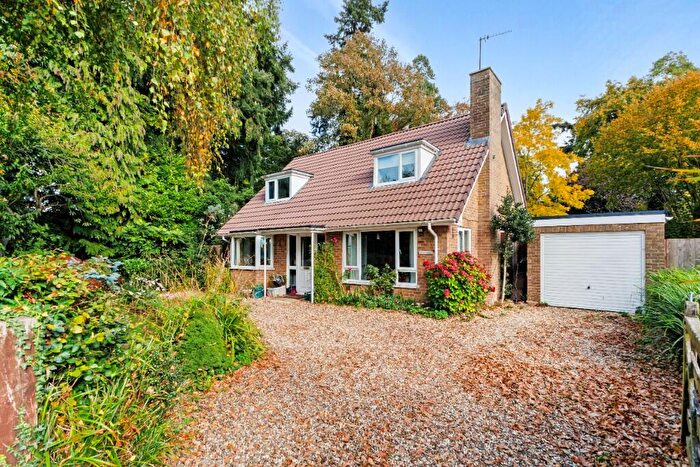
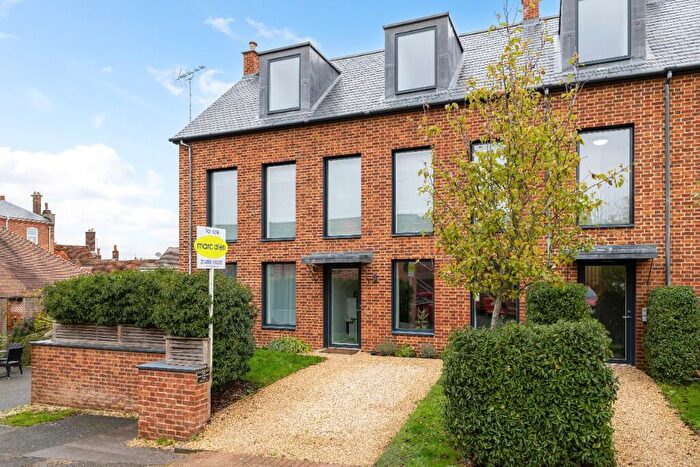
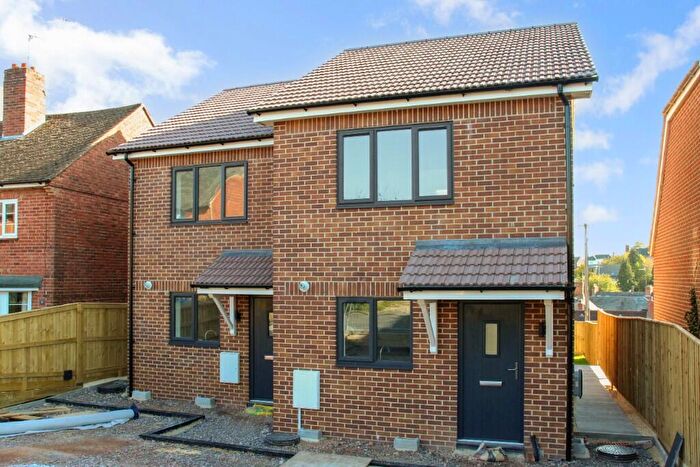
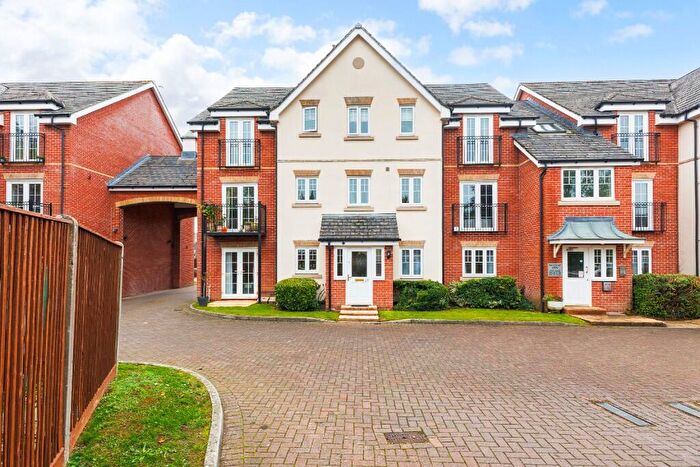
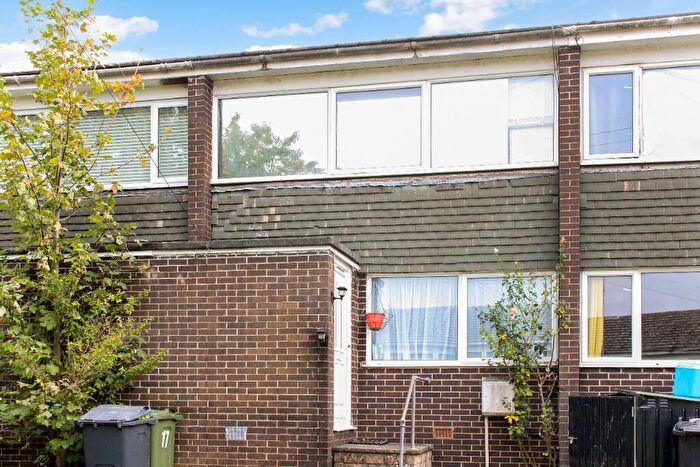
Houses for sale & to rent in Hungerford, Hungerford
House Prices in Hungerford
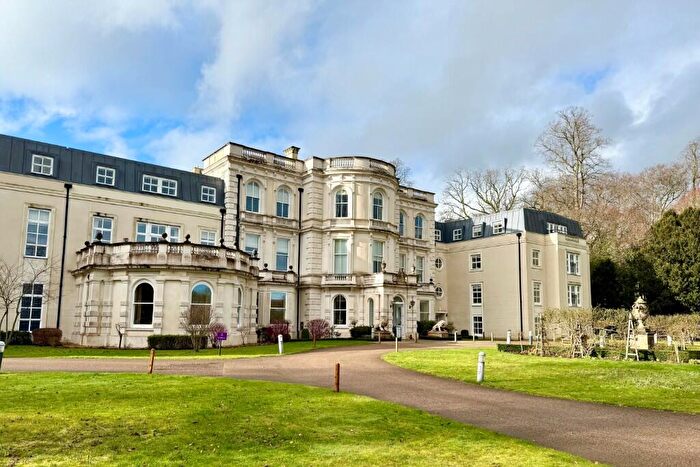
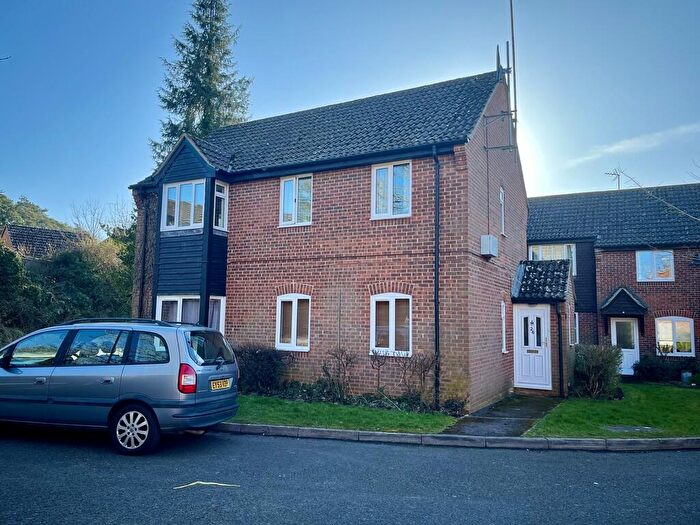
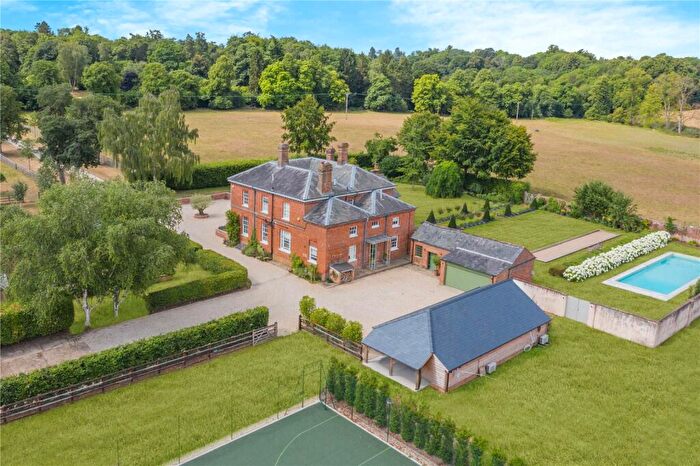
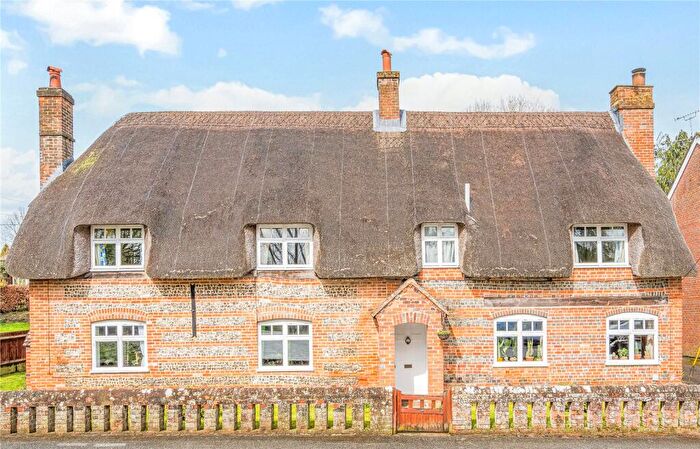
Properties in Hungerford have an average house price of £380,274.00 and had 255 Property Transactions within the last 3 years¹.
Hungerford is an area in Hungerford, West Berkshire with 2,445 households², where the most expensive property was sold for £1,450,000.00.
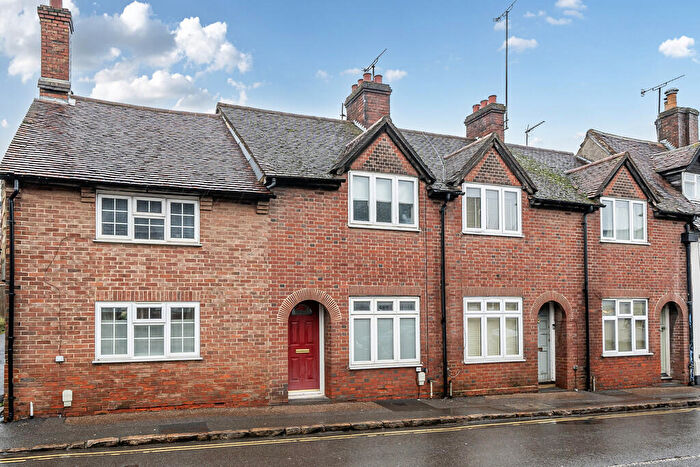
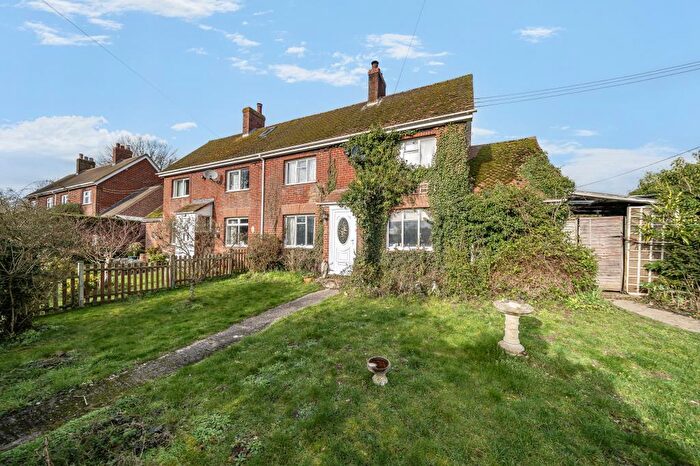
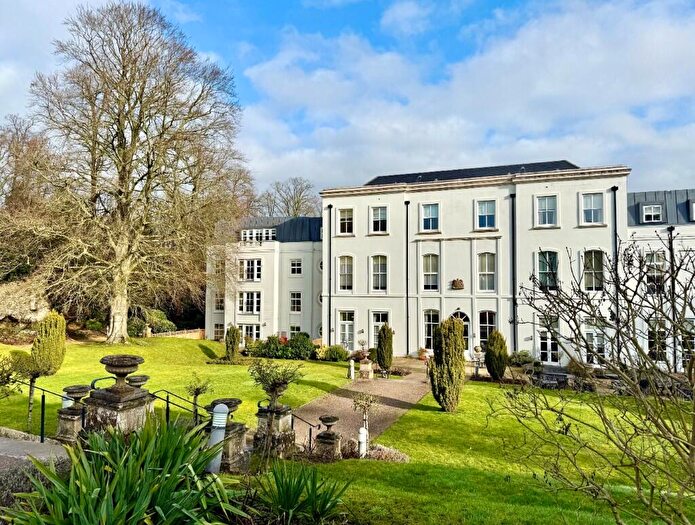
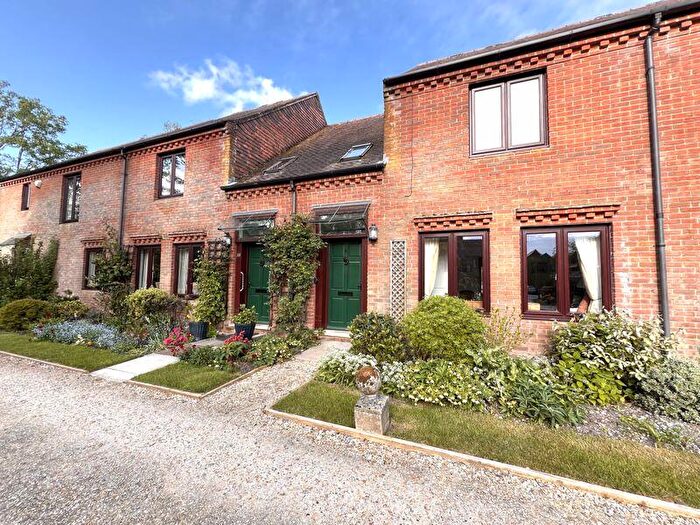
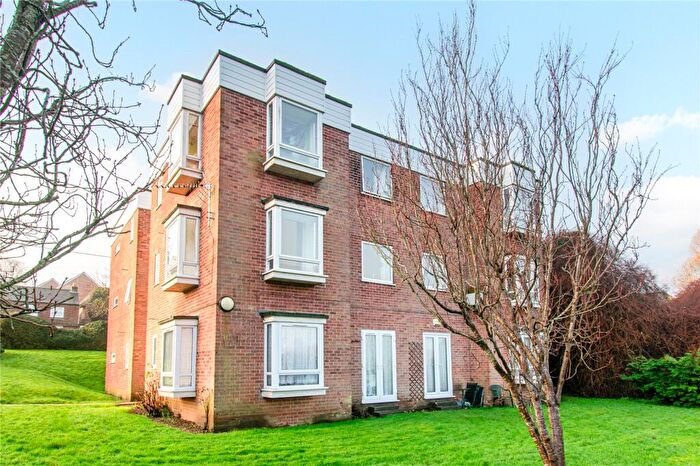
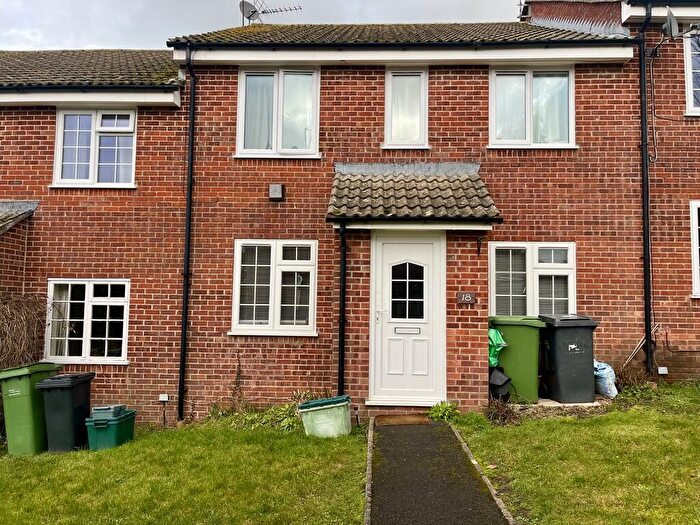
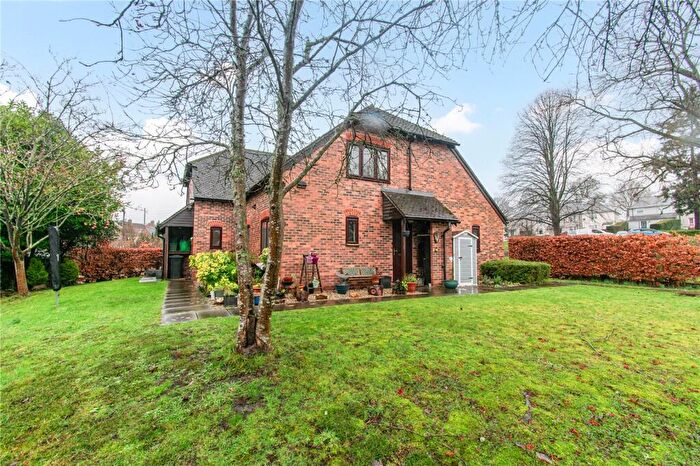
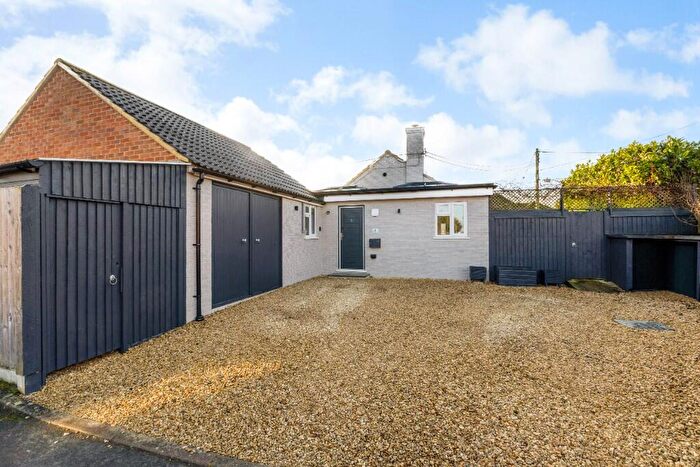
Properties for sale in Hungerford
Roads and Postcodes in Hungerford
Navigate through our locations to find the location of your next house in Hungerford, Hungerford for sale or to rent.
| Streets | Postcodes |
|---|---|
| Aldbourne Close | RG17 0SQ |
| Atherton Crescent | RG17 0LE |
| Atherton Road | RG17 0LD |
| Bath Road | RG17 0HE |
| Bearwater | RG17 0NN |
| Bourne Vale | RG17 0LL |
| Breach Square | RG17 0AT |
| Bridge Street | RG17 0EG RG17 0EH |
| Bulpit Lane | RG17 0AU RG17 0AX |
| Canal Side | RG17 0DW |
| Canal Walk | RG17 0EQ |
| Chantry Mead | RG17 0HT |
| Chapel Court | RG17 0HW |
| Charnham Court | RG17 0EW |
| Charnham Lane | RG17 0DS |
| Charnham Meadow | RG17 0PF |
| Charnham Street | RG17 0EJ RG17 0EP RG17 0ES |
| Cherry Grove | RG17 0HP |
| Chestnut Walk | RG17 0DB |
| Chilton Way | RG17 0JF RG17 0JR |
| Church Lane | RG17 0HX |
| Church Street | RG17 0JE RG17 0JG RG17 0JH |
| Church Way | RG17 0JP RG17 0JU RG17 0JX RG17 0LW |
| Clarks Gardens | RG17 0BS |
| Coldharbour Road | RG17 0AZ |
| Combe View | RG17 0BZ |
| Cottrell Close | RG17 0HF |
| Croft Road | RG17 0JA |
| Crown Mews | RG17 0NR |
| De Montfort Grove | RG17 0DQ |
| Fairview Road | RG17 0BN RG17 0BP RG17 0BT |
| Faulknor Square | RG17 0ER |
| Firgrove Court | RG17 0DD |
| Freemans Close | RG17 0QR |
| Hamblin Meadow | RG17 0HJ |
| High Street | RG17 0DL RG17 0DN RG17 0LU RG17 0NA RG17 0NE RG17 0NF |
| Hillside Road | RG17 0BH |
| Homefield Way | RG17 0JY RG17 0JZ |
| Honeyfields | RG17 0JN |
| Hungerford Park | RG17 0UP |
| Kennedy Meadow | RG17 0LR |
| Kennet Way | RG17 0YZ |
| Lancaster Close | RG17 0DE |
| Lancaster House Mews | RG17 0NB |
| Lancaster Square | RG17 0AH |
| Lewington Mews | RG17 0BF |
| Lourdes Crescent | RG17 0GY |
| Macklin Close | RG17 0BY |
| Marlborough Court | RG17 0DT |
| Marsh Lane | RG17 0QN |
| Meadowview | RG17 0YY |
| Middletons Close | RG17 0HQ |
| Moores Place | RG17 0JS |
| Morley Place | RG17 0HS |
| Newtons Mews | RG17 0HN |
| North View | RG17 0DA |
| Oakes Court | RG17 0JW |
| Old Hayward Bottom | RG17 0QB |
| Orchard Park Close | RG17 0BJ |
| Oxford Street | RG17 0ET RG17 0EU RG17 0EX |
| Park Street | RG17 0EA RG17 0EB RG17 0ED RG17 0EF |
| Park Way | RG17 0BB RG17 0BD |
| Parsonage Lane | RG17 0JB RG17 0JD |
| Pound Piece | RG17 0QW |
| Priory Avenue | RG17 0AS RG17 0BE RG17 0BQ |
| Priory Place | RG17 0AB RG17 0AD |
| Priory Road | RG17 0AF RG17 0AG RG17 0AJ RG17 0AP RG17 0AW RG17 0DG |
| Prospect Road | RG17 0JJ RG17 0JL |
| Ramsbury Drive | RG17 0SG |
| Ramsbury Terrace | RG17 0SH |
| Regents Close | RG17 0LF |
| Salisbury Road | RG17 0AE RG17 0LG RG17 0LH RG17 0RD RG17 0ST |
| Salisbury Row | RG17 0AA |
| Sanden Close | RG17 0LA RG17 0LB |
| Sanham Green | RG17 0RS |
| Sarum Way | RG17 0LJ |
| Shalbourne Close | RG17 0QH |
| Smitham Bridge Road | RG17 0QP |
| Somerset Close | RG17 0NS |
| South View | RG17 0BX |
| St Lawrence Square | RG17 0HB |
| Standen Manor | RG17 0RB |
| Strongrove Hill | RG17 0SJ |
| Tarrants Hill | RG17 0BL |
| The Croft | RG17 0HY |
| The Forge | RG17 0GU |
| The Laurels | RG17 0DZ |
| The Marsh | RG17 0SN |
| Uplands | RG17 0LP |
| Wantage Road | RG17 0HA RG17 0HG RG17 0PJ RG17 0PN |
| Waram Close | RG17 0EZ |
| Wessex Close | RG17 0NT |
| Westbrook Close | RG17 0HU |
| Williams Court | RG17 0DR |
| Wiltshire Close | RG17 0NU |
| York Road | RG17 0DF |
| RG17 0HH RG17 0HL RG17 0PP RG17 0PR RG17 0PT RG17 0PU RG17 0PX RG17 0QZ RG17 0RT RG17 0RU RG17 0TA |
Transport near Hungerford
- FAQ
- Price Paid By Year
- Property Type Price
Frequently asked questions about Hungerford
What is the average price for a property for sale in Hungerford?
The average price for a property for sale in Hungerford is £380,274. This amount is 23% lower than the average price in Hungerford. There are 539 property listings for sale in Hungerford.
What streets have the most expensive properties for sale in Hungerford?
The streets with the most expensive properties for sale in Hungerford are The Croft at an average of £855,000, Salisbury Road at an average of £840,333 and Faulknor Square at an average of £705,000.
What streets have the most affordable properties for sale in Hungerford?
The streets with the most affordable properties for sale in Hungerford are Firgrove Court at an average of £112,333, Wessex Close at an average of £120,666 and Morley Place at an average of £142,500.
Which train stations are available in or near Hungerford?
Some of the train stations available in or near Hungerford are Hungerford, Kintbury and Bedwyn.
Property Price Paid in Hungerford by Year
The average sold property price by year was:
| Year | Average Sold Price | Price Change |
Sold Properties
|
|---|---|---|---|
| 2025 | £388,626 | 8% |
75 Properties |
| 2024 | £359,361 | -10% |
90 Properties |
| 2023 | £394,227 | 12% |
90 Properties |
| 2022 | £346,184 | -4% |
105 Properties |
| 2021 | £361,678 | -3% |
161 Properties |
| 2020 | £373,775 | 17% |
56 Properties |
| 2019 | £308,942 | -20% |
71 Properties |
| 2018 | £371,312 | 15% |
83 Properties |
| 2017 | £316,683 | 3% |
108 Properties |
| 2016 | £308,083 | 7% |
112 Properties |
| 2015 | £286,918 | 2% |
123 Properties |
| 2014 | £282,610 | -3% |
132 Properties |
| 2013 | £292,006 | 20% |
117 Properties |
| 2012 | £232,610 | -24% |
82 Properties |
| 2011 | £288,660 | 10% |
106 Properties |
| 2010 | £258,881 | 5% |
90 Properties |
| 2009 | £246,831 | -2% |
88 Properties |
| 2008 | £252,639 | -4% |
84 Properties |
| 2007 | £262,804 | 8% |
135 Properties |
| 2006 | £242,326 | 16% |
185 Properties |
| 2005 | £202,711 | -9% |
163 Properties |
| 2004 | £220,706 | 5% |
162 Properties |
| 2003 | £209,461 | 17% |
195 Properties |
| 2002 | £173,193 | -1% |
215 Properties |
| 2001 | £174,887 | 23% |
169 Properties |
| 2000 | £135,119 | 15% |
160 Properties |
| 1999 | £114,511 | 15% |
173 Properties |
| 1998 | £97,098 | 9% |
164 Properties |
| 1997 | £87,926 | 4% |
193 Properties |
| 1996 | £83,977 | 6% |
181 Properties |
| 1995 | £78,685 | - |
140 Properties |
Property Price per Property Type in Hungerford
Here you can find historic sold price data in order to help with your property search.
The average Property Paid Price for specific property types in the last three years are:
| Property Type | Average Sold Price | Sold Properties |
|---|---|---|
| Semi Detached House | £397,404.00 | 74 Semi Detached Houses |
| Detached House | £581,963.00 | 54 Detached Houses |
| Terraced House | £339,993.00 | 83 Terraced Houses |
| Flat | £179,919.00 | 44 Flats |

