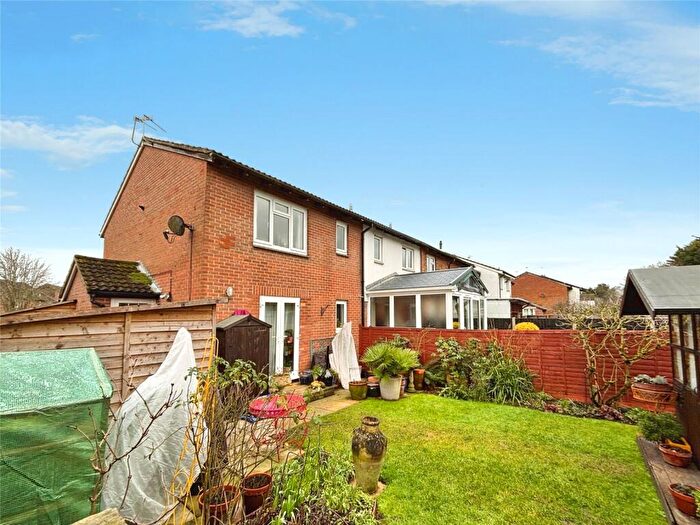
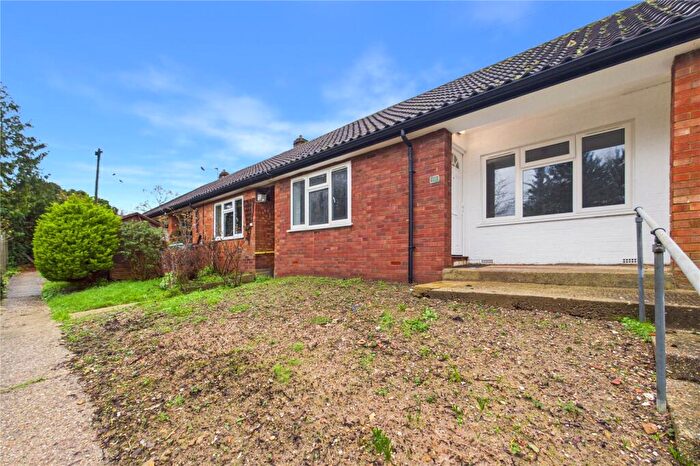
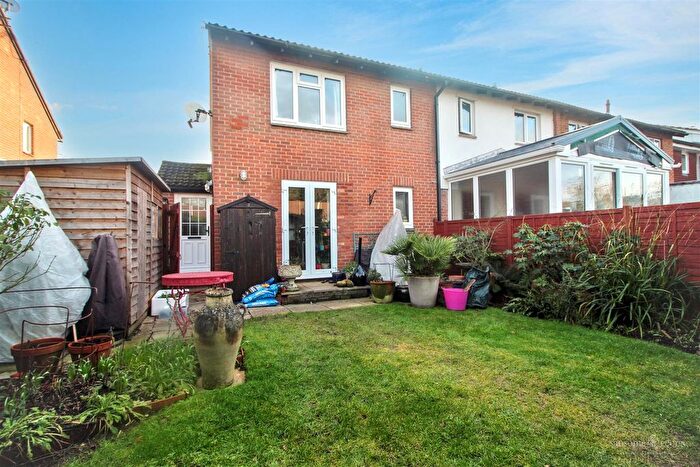
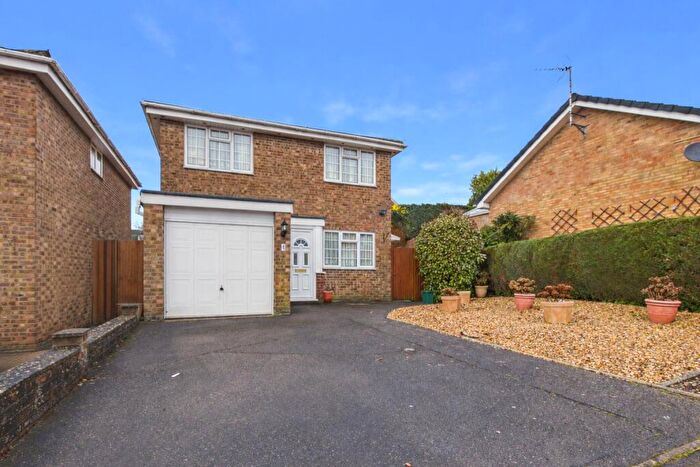
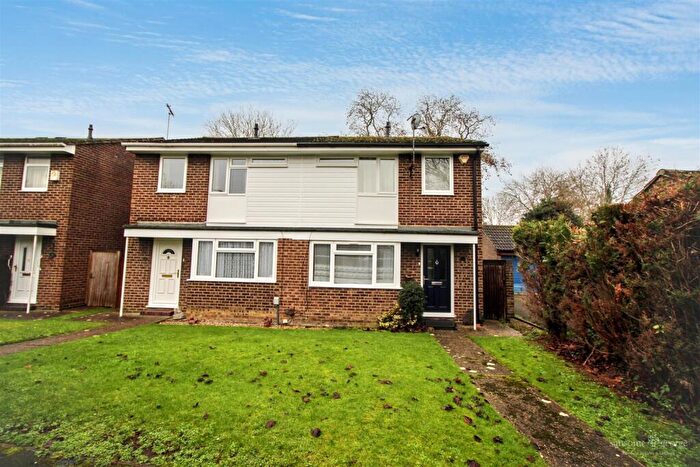
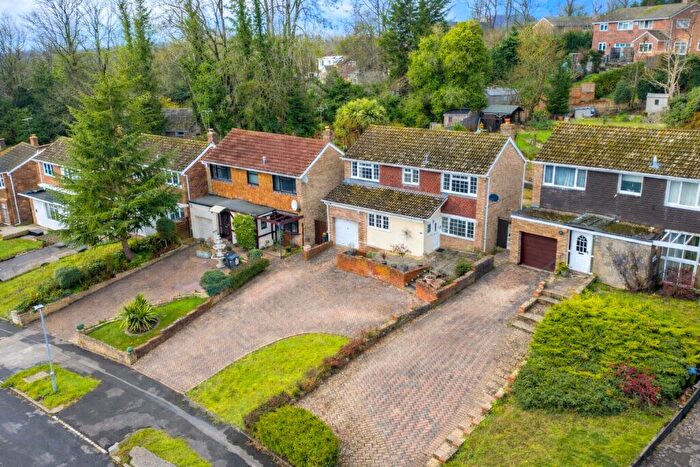
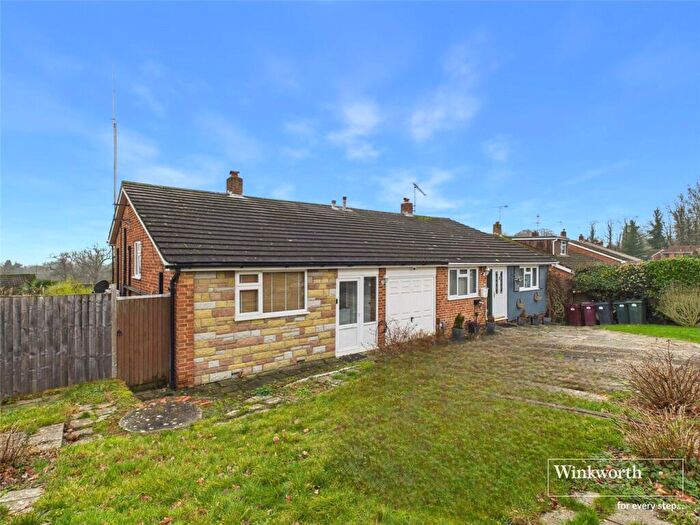
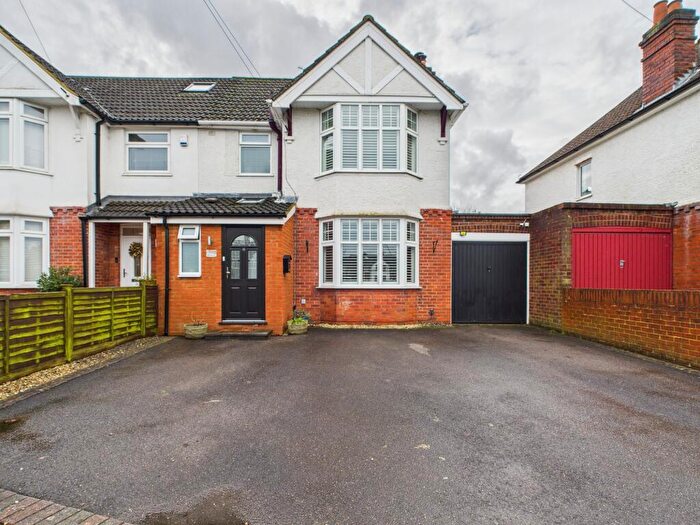
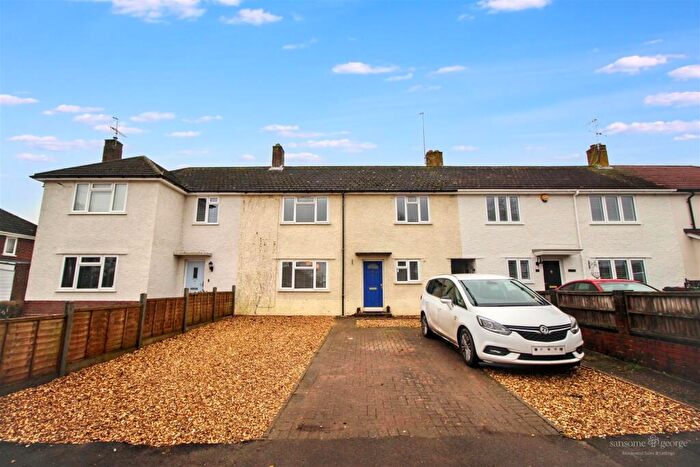
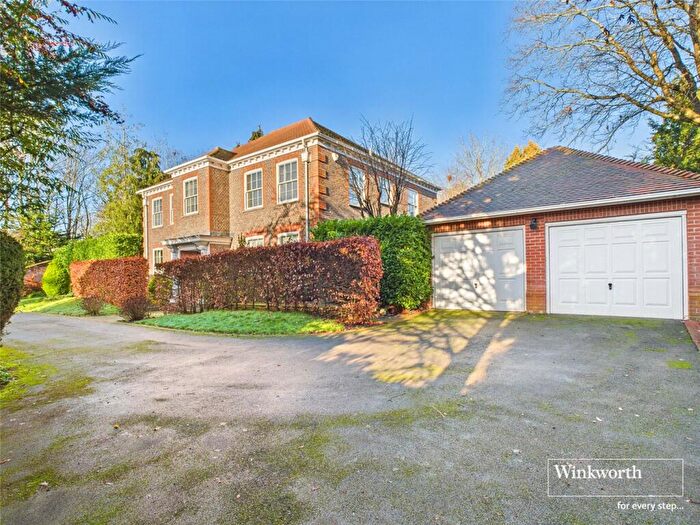
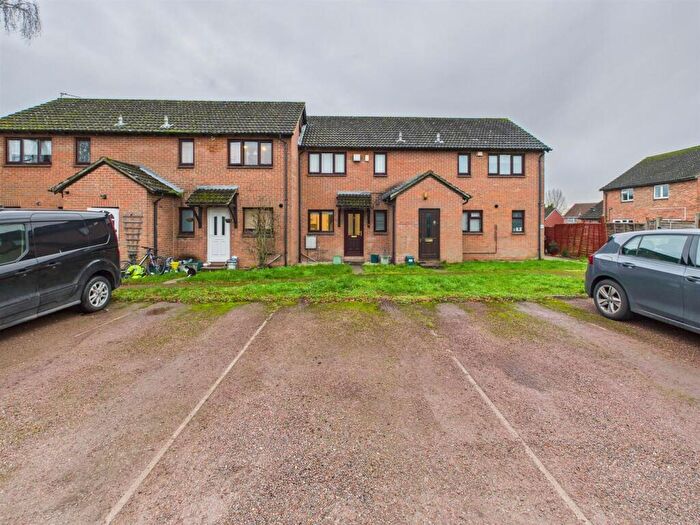
Houses for sale & to rent in Calcot, Reading
House Prices in Calcot
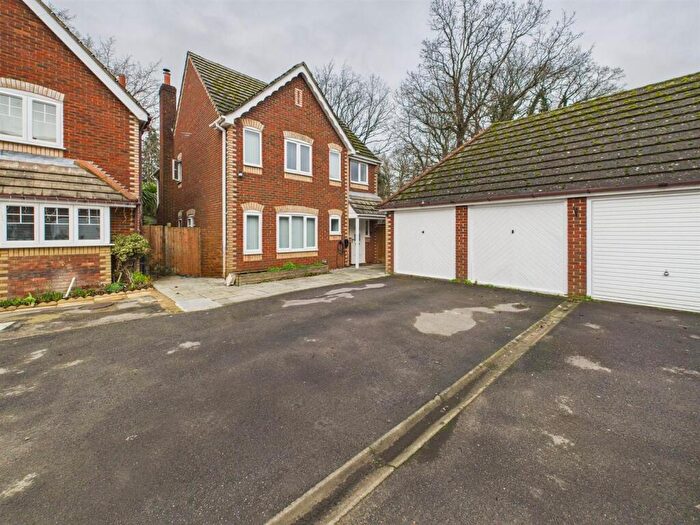
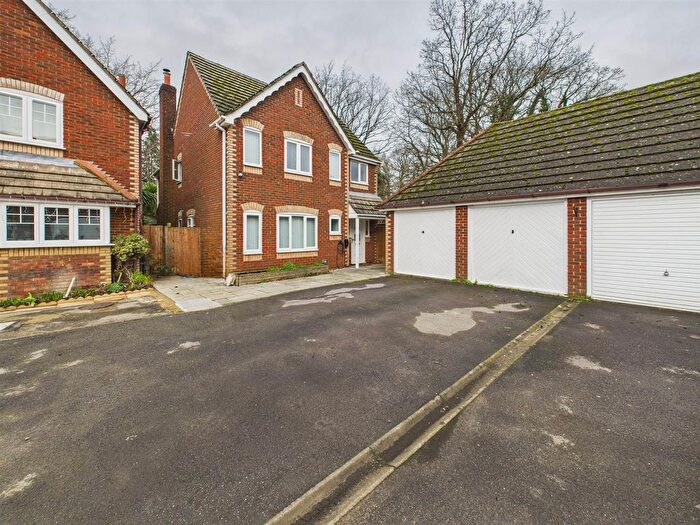
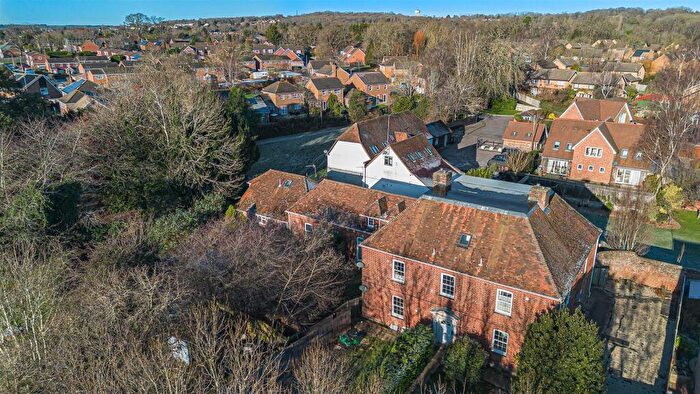
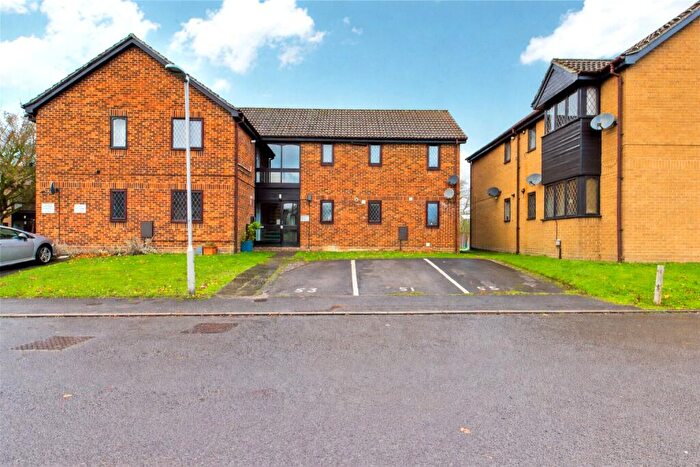
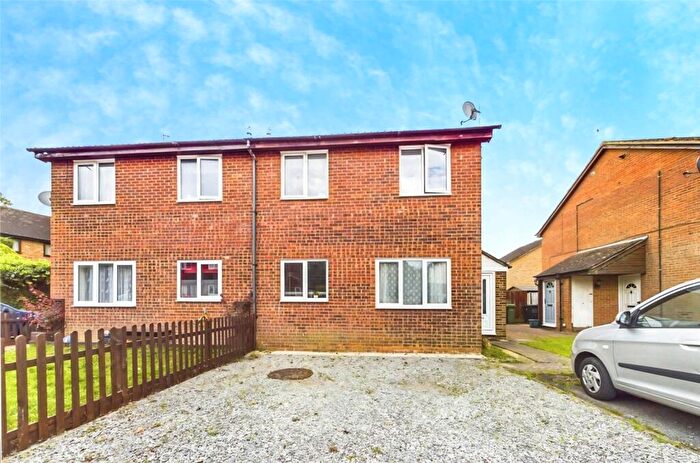
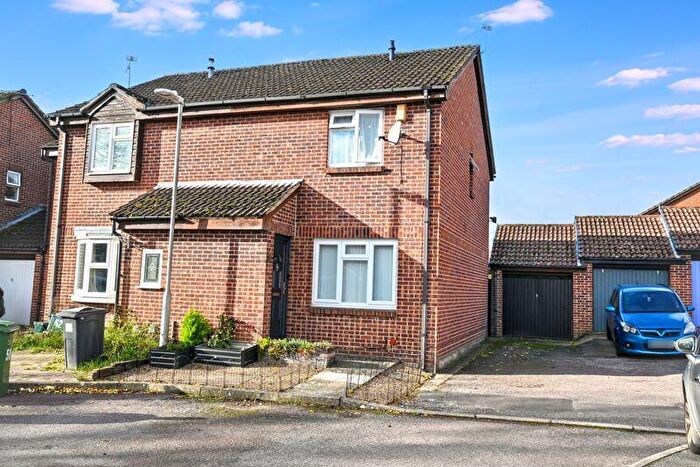
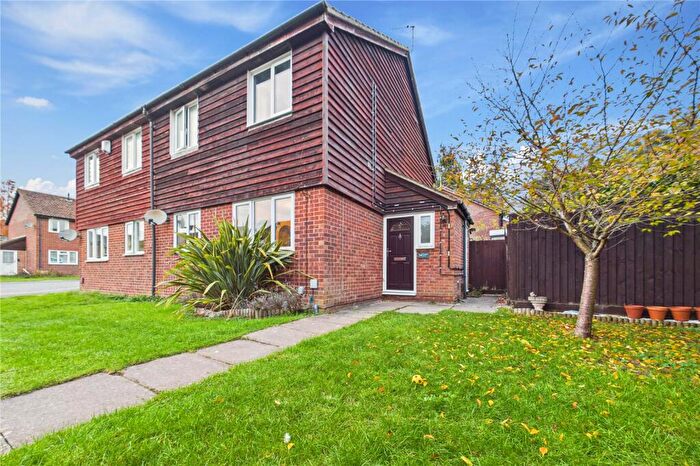
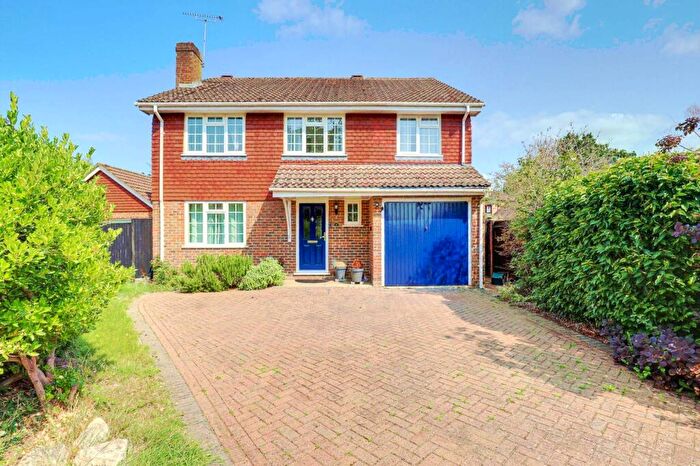
Properties in Calcot have an average house price of £390,046.00 and had 284 Property Transactions within the last 3 years¹.
Calcot is an area in Reading, West Berkshire with 3,265 households², where the most expensive property was sold for £1,535,000.00.
Properties for sale in Calcot
Roads and Postcodes in Calcot
Navigate through our locations to find the location of your next house in Calcot, Reading for sale or to rent.
| Streets | Postcodes |
|---|---|
| Albury Gardens | RG31 7ZY |
| Angus Close | RG31 7YL |
| Ashmere Close | RG31 7EN |
| Avon Close | RG31 7YE |
| Bainbridge Road | RG31 7BE |
| Balfour Drive | RG31 7BN |
| Ballamoor Close | RG31 7BJ |
| Bamford Place | RG31 7BL |
| Bancroft Place | RG31 7BH |
| Barclay Road | RG31 7EL |
| Bath Road | RG31 7QD RG31 7QH RG31 7QJ |
| Bayford Drive | RG31 7UL |
| Blackwater Rise | RG31 7BB |
| Bourne Close | RG31 7BD |
| Broadlands Close | RG31 7RP |
| Brookside | RG31 7PJ |
| Caistor Close | RG31 7AY |
| Calbourne Drive | RG31 7DB |
| Calcot Court | RG31 7RW |
| Calcot Park | RG31 7RN |
| Calcot Place Drive | RG31 7PF |
| Calshot Place | RG31 7DA |
| Cambrian Way | RG31 7DD |
| Camden Place | RG31 7AF RG31 7AG |
| Carston Grove | RG31 7ZN |
| Carters Rise | RG31 7XS RG31 7YS RG31 7YT |
| Charlville Drive | RG31 7AU |
| Charrington Road | RG31 7AW |
| Clarence Way | RG31 4UU |
| Colliston Walk | RG31 7ZJ |
| Colston Close | RG31 7EQ |
| Conway Road | RG31 4XP |
| Corsham Road | RG31 7ZH |
| Cranbourne Avenue | RG31 4RD |
| Curtis Road | RG31 4XG |
| Deerhurst Close | RG31 7RX |
| Delafield Drive | RG31 7EB |
| Derrick Close | RG31 7AQ |
| Dorking Way | RG31 7AE |
| Dunoon Close | RG31 7YJ |
| Embrook Way | RG31 7BG |
| Empress Road | RG31 4XR |
| Evergreen Drive | RG31 7YR |
| Fairlop Close | RG31 7EF |
| Ferndale Avenue | RG30 3NQ |
| Fernhurst Road | RG31 7EA |
| Flodden Drive | RG31 7EH |
| Fortrose Walk | RG31 7YG |
| Foxhunt Grove | RG31 7PE |
| Garston Crescent | RG31 4XJ RG31 4XL |
| Gatcombe Close | RG31 4XQ |
| Glamis Way | RG31 4UX |
| Goodwin Close | RG31 7ZW |
| Graham Close | RG31 7YN |
| Grangely Close | RG31 7DR |
| Grantham Road | RG30 3NJ |
| Greencroft Gardens | RG30 3PL |
| Halpin Close | RG31 4RA |
| Hanbury Drive | RG31 7EJ |
| Hargreaves Way | RG31 7QA |
| Hatfield Court | RG31 7AL RG31 7AN |
| Hawkesbury Drive | RG31 7ZP RG31 7ZR |
| Hawley Close | RG31 7ED |
| High View | RG31 4XD RG31 4XE |
| Holmwood Avenue | RG30 3PJ |
| Holymead | RG31 7BP |
| Invergordon Close | RG31 7YQ |
| Jubilee Walk | RG31 7BR |
| Kemble Court | RG31 7DJ |
| Kemerton Close | RG31 7DG |
| Kendrick Gate | RG30 4DP |
| Kettering Close | RG31 7DF |
| Kilburn Close | RG31 7DH |
| Kirkstall Court | RG31 7DL |
| Knollmead | RG31 7DQ |
| Ladymask Close | RG31 7QB |
| Lamplighters Walk | RG31 7YU |
| Langley Hall Drive | RG31 4QY |
| Langley Hill | RG31 4QU RG31 4QX |
| Latimer Drive | RG31 7AP |
| Leander Place | RG31 7DS |
| Ledbury Drive | RG31 7EE |
| Lennox Close | RG31 7AX |
| Low Lane | RG31 7RT |
| Mackay Close | RG31 7XW |
| Marlborough Way | RG31 4XB |
| May Park | RG31 7RU |
| Mayfield Avenue | RG31 4RE |
| Mey Close | RG31 4QT |
| Mill Lane | RG31 7RS |
| Millers Grove | RG31 7PH |
| Montrose Walk | RG31 7YH |
| Narromine Drive | RG31 7ZL |
| New Lane Hill | RG30 4JJ RG30 4JL RG30 4JN |
| Old Bath Road | RG31 4AA RG31 4QL RG31 7QN |
| Oliver Drive | RG31 4XN |
| Orkney Close | RG31 7YW |
| Palmera Avenue | RG31 7DZ |
| Pemberton Gardens | RG31 7DY |
| Petworth Avenue | RG30 3NL |
| Piercefield | RG31 7AS |
| Porlock Place | RG31 7AR |
| Post Horn Place | RG31 7QE |
| Radbourne Road | RG31 7EG |
| Rangewood Avenue | RG30 3NN |
| Royal Avenue | RG31 4UP RG31 4UR RG31 4UT |
| Rushmoor Gardens | RG31 7AH RG31 7AJ |
| Sandhills Way | RG31 7PQ |
| Sandown Avenue | RG31 4RB |
| Sandringham Way | RG31 4XA |
| Seton Drive | RG31 7YF |
| Sharnwood Drive | RG31 7YD |
| Silbury Close | RG31 7BQ |
| Skye Close | RG31 7QG |
| Sovereign Way | RG31 4US |
| St Birinus Road | RG31 4QS |
| Sutherland Grove | RG31 7QF |
| Swanholm Gardens | RG31 7YB |
| Sweet Briar Drive | RG31 7AD |
| Tadcroft Walk | RG31 7JR |
| The Chase | RG31 7DE RG31 7DN RG31 7DW |
| The Old Orchard | RG31 7RF |
| The Spinney | RG31 7RJ |
| Thomson Walk | RG31 7DP |
| Tithebarn Grove | RG31 7YX |
| Torcross Grove | RG31 7AT |
| Underwood Road | RG30 3LZ RG30 3NA RG30 3NF RG30 3PA RG30 3PD |
| Vanlore Way | RG31 4XH |
| Vine Crescent | RG30 3LX |
| Weir Close | RG31 7PD |
| Wheatlands Close | RG31 7PG |
| Willow Tree Glade | RG31 7AZ |
| Windsor Way | RG31 4UY |
Transport near Calcot
- FAQ
- Price Paid By Year
- Property Type Price
Frequently asked questions about Calcot
What is the average price for a property for sale in Calcot?
The average price for a property for sale in Calcot is £390,046. This amount is 25% lower than the average price in Reading. There are 838 property listings for sale in Calcot.
What streets have the most expensive properties for sale in Calcot?
The streets with the most expensive properties for sale in Calcot are Broadlands Close at an average of £1,450,000, Calcot Park at an average of £1,013,333 and New Lane Hill at an average of £754,375.
What streets have the most affordable properties for sale in Calcot?
The streets with the most affordable properties for sale in Calcot are Caistor Close at an average of £187,000, Langley Hall Drive at an average of £211,111 and Holmwood Avenue at an average of £240,000.
Which train stations are available in or near Calcot?
Some of the train stations available in or near Calcot are Theale, Tilehurst and Reading West.
Property Price Paid in Calcot by Year
The average sold property price by year was:
| Year | Average Sold Price | Price Change |
Sold Properties
|
|---|---|---|---|
| 2025 | £399,056 | 5% |
89 Properties |
| 2024 | £380,255 | -4% |
112 Properties |
| 2023 | £393,596 | 3% |
83 Properties |
| 2022 | £380,887 | 12% |
128 Properties |
| 2021 | £336,427 | 1% |
173 Properties |
| 2020 | £332,842 | -2% |
100 Properties |
| 2019 | £337,891 | -5% |
128 Properties |
| 2018 | £354,172 | 8% |
131 Properties |
| 2017 | £326,773 | -4% |
127 Properties |
| 2016 | £338,401 | 13% |
124 Properties |
| 2015 | £293,558 | 12% |
162 Properties |
| 2014 | £259,767 | 11% |
178 Properties |
| 2013 | £231,312 | -2% |
150 Properties |
| 2012 | £234,848 | 6% |
135 Properties |
| 2011 | £221,679 | 5% |
110 Properties |
| 2010 | £211,686 | -14% |
120 Properties |
| 2009 | £242,192 | 3% |
119 Properties |
| 2008 | £234,750 | 2% |
107 Properties |
| 2007 | £230,618 | 7% |
227 Properties |
| 2006 | £213,454 | 8% |
230 Properties |
| 2005 | £196,378 | 3% |
182 Properties |
| 2004 | £191,092 | 8% |
233 Properties |
| 2003 | £176,240 | 7% |
191 Properties |
| 2002 | £163,680 | 14% |
260 Properties |
| 2001 | £140,112 | 5% |
261 Properties |
| 2000 | £132,757 | 23% |
196 Properties |
| 1999 | £102,519 | 8% |
275 Properties |
| 1998 | £94,316 | 10% |
261 Properties |
| 1997 | £85,247 | 12% |
226 Properties |
| 1996 | £74,654 | 2% |
268 Properties |
| 1995 | £73,050 | - |
183 Properties |
Property Price per Property Type in Calcot
Here you can find historic sold price data in order to help with your property search.
The average Property Paid Price for specific property types in the last three years are:
| Property Type | Average Sold Price | Sold Properties |
|---|---|---|
| Semi Detached House | £372,269.00 | 98 Semi Detached Houses |
| Detached House | £613,395.00 | 62 Detached Houses |
| Terraced House | £331,333.00 | 92 Terraced Houses |
| Flat | £180,546.00 | 32 Flats |

