
Houses for sale & to rent in Norcot, Reading
House Prices in Norcot
Properties in Norcot have an average house price of £327k and had 415 Property Transactions within the last 3 years¹.
Norcot is an area in Reading, Reading with 4,142 households², where the most expensive property was sold for £775k.
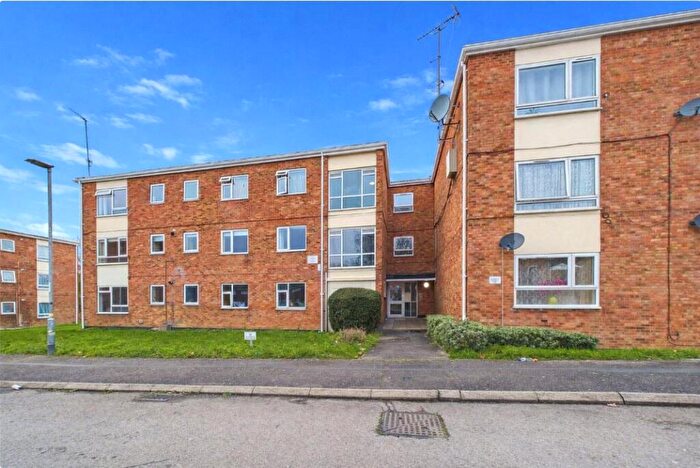
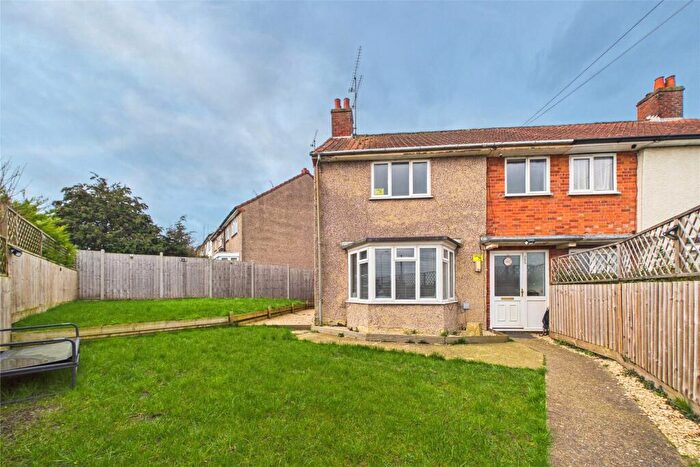
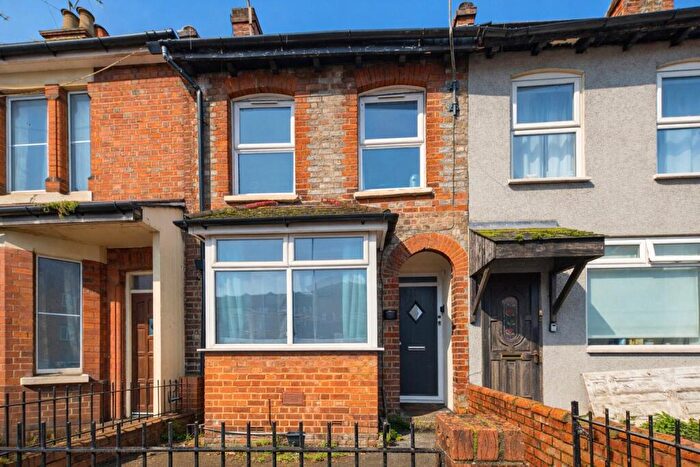
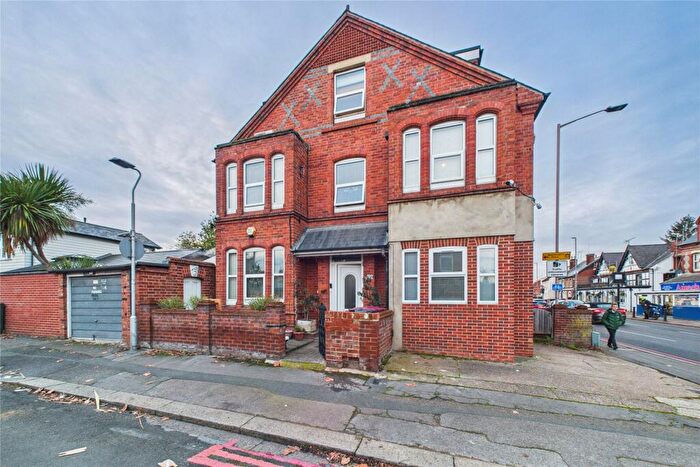
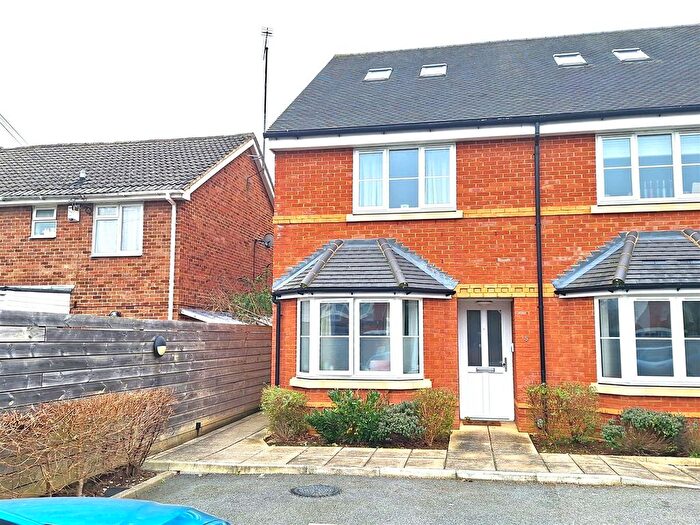
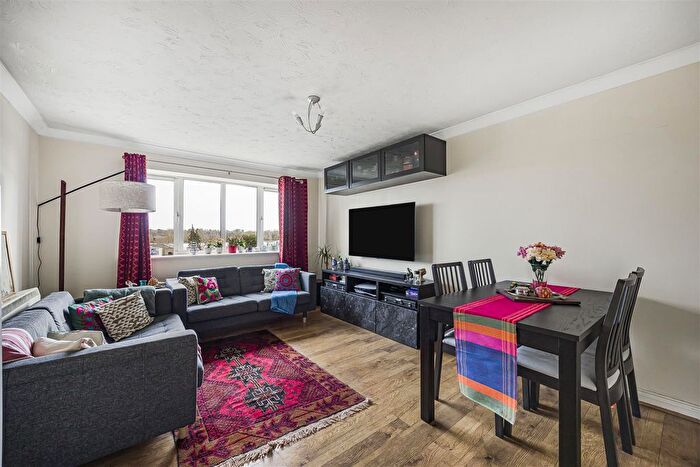
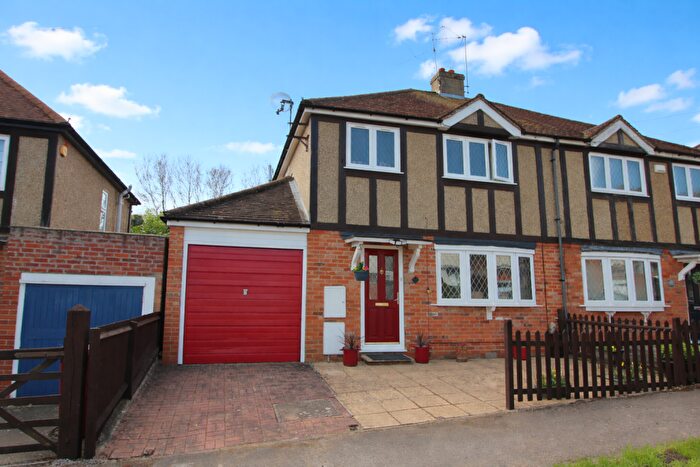
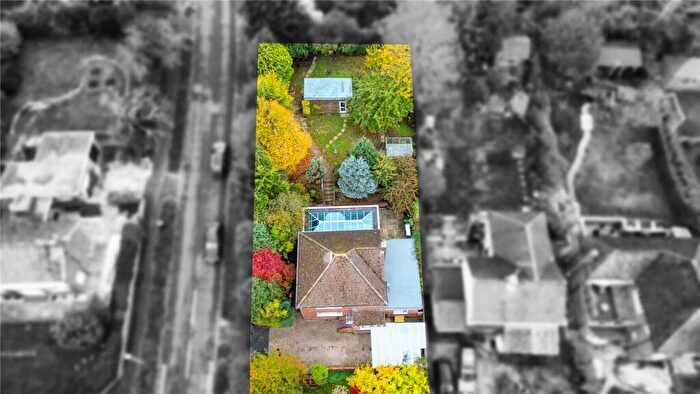
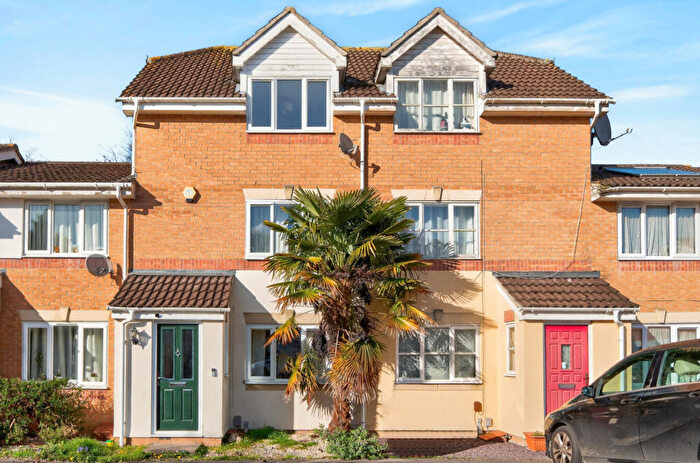
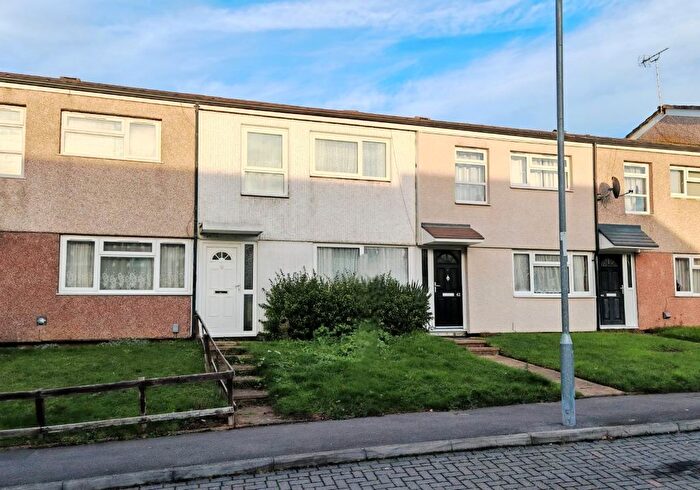
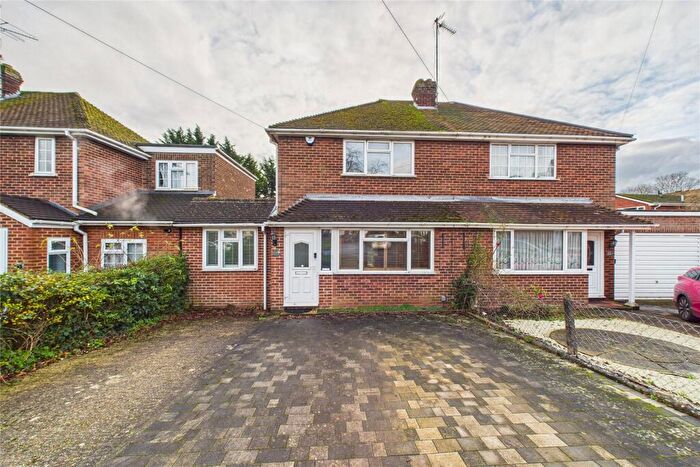
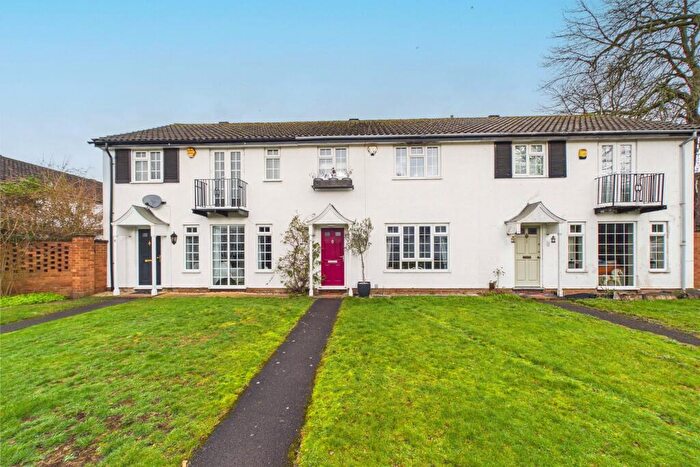
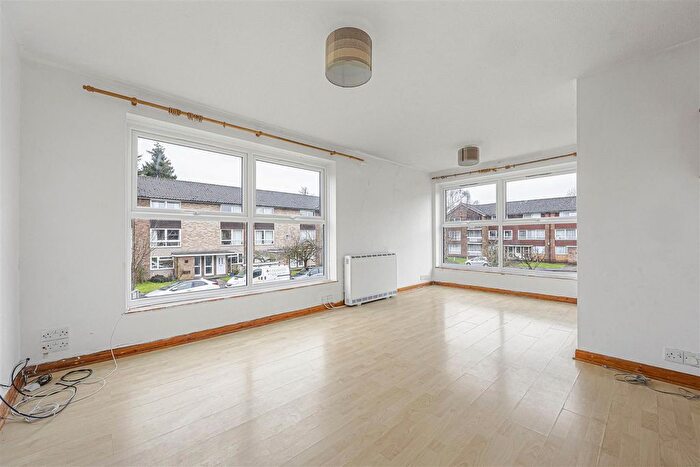
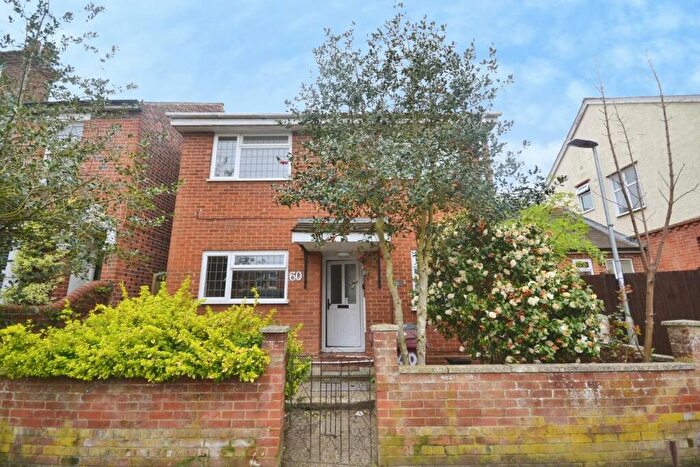
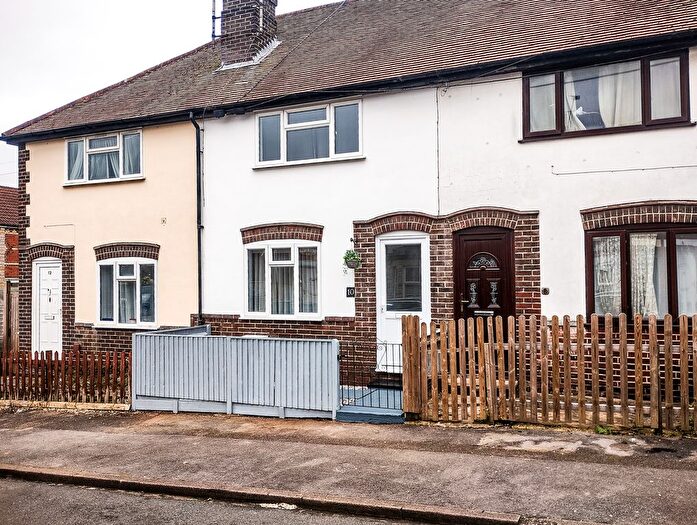
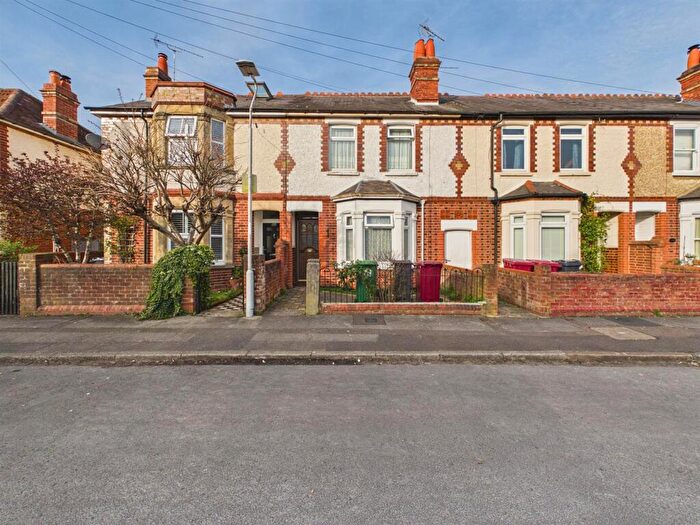
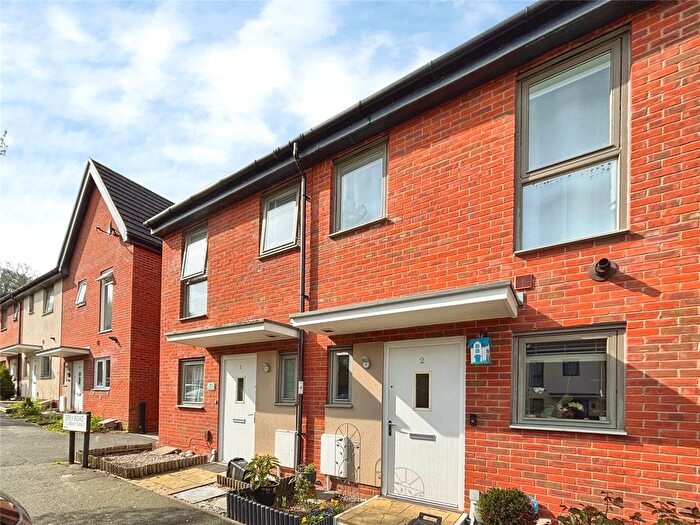
Properties for sale in Norcot
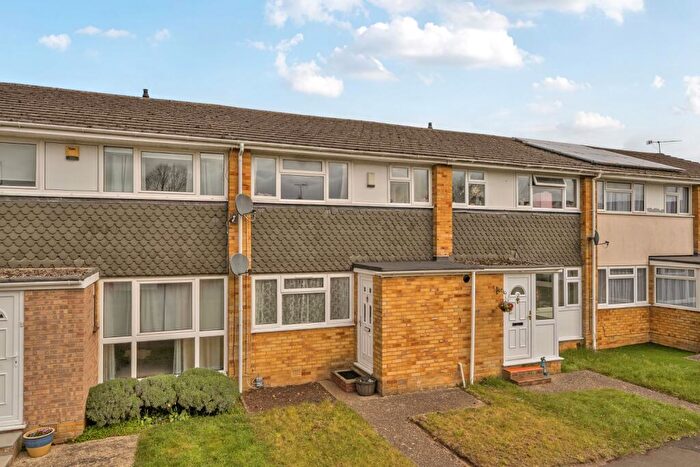
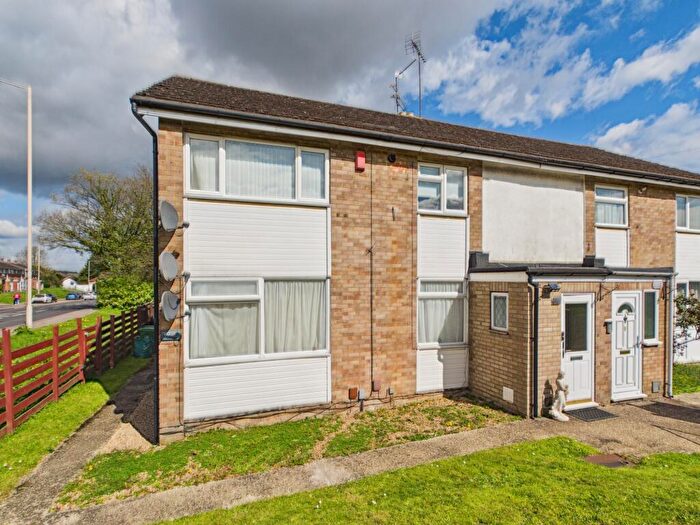

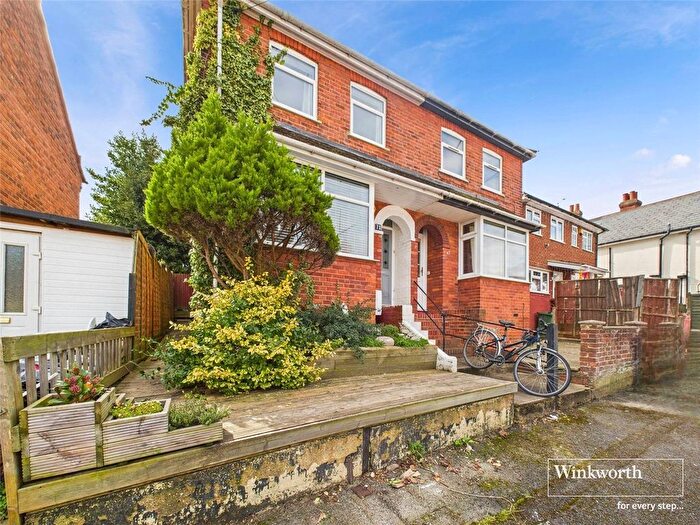
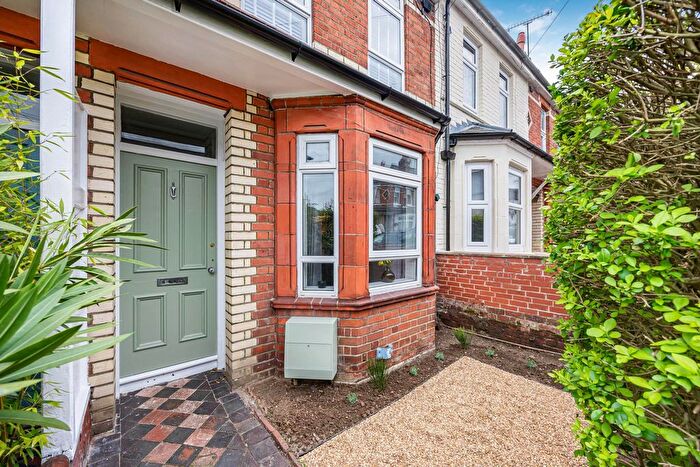
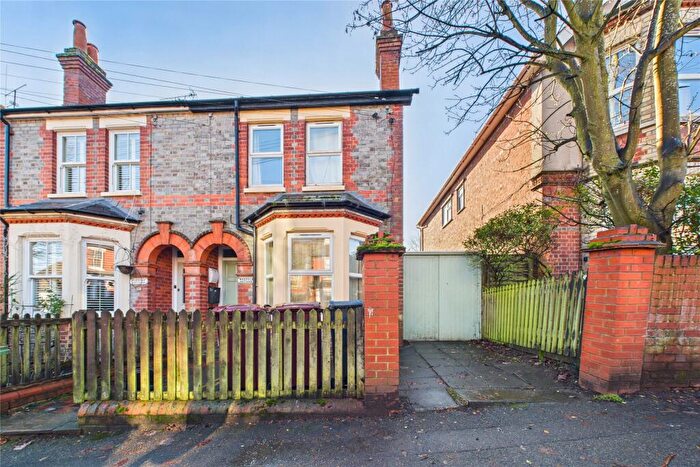
![]()
If you are looking to sell your house, let it out, or receive a property valuation, an expert can help you.
Click the button below to get started.

Roads and Postcodes in Norcot
Navigate through our locations to find the location of your next house in Norcot, Reading for sale or to rent.
Transport near Norcot


- FAQ
- Price Paid By Year
- Property Type Price
Frequently asked questions about Norcot
What is the average price for a property for sale in Norcot?
The average price for a property for sale in Norcot is £326,707. This amount is 13% lower than the average price in Reading. There are 1,782 property listings for sale in Norcot.
What streets have the most expensive properties for sale in Norcot?
The streets with the most expensive properties for sale in Norcot are Cockney Hill at an average of £667,500, Pegs Green Close at an average of £600,000 and Lawrence Road at an average of £466,666.
What streets have the most affordable properties for sale in Norcot?
The streets with the most affordable properties for sale in Norcot are Upton Road at an average of £180,000, Rowe Court at an average of £182,833 and Rona Court at an average of £196,500.
Which train stations are available in or near Norcot?
Some of the train stations available in or near Norcot are Reading West, Tilehurst and Reading.
Property Price Paid in Norcot by Year
The average sold property price by year was:
| Year | Average Sold Price | Price Change |
Sold Properties
|
|---|---|---|---|
| 2026 | £377,500 | 16% |
2 Properties |
| 2025 | £318,159 | -4% |
135 Properties |
| 2024 | £330,334 | -0,1% |
134 Properties |
| 2023 | £330,639 | 6% |
144 Properties |
| 2022 | £310,348 | 5% |
164 Properties |
| 2021 | £294,756 | 6% |
217 Properties |
| 2020 | £278,257 | 1% |
120 Properties |
| 2019 | £274,823 | -1% |
156 Properties |
| 2018 | £276,416 | 1% |
172 Properties |
| 2017 | £274,468 | 1% |
160 Properties |
| 2016 | £271,502 | 13% |
217 Properties |
| 2015 | £236,335 | 8% |
253 Properties |
| 2014 | £217,047 | 11% |
238 Properties |
| 2013 | £192,795 | 2% |
217 Properties |
| 2012 | £188,263 | 4% |
158 Properties |
| 2011 | £179,990 | -1% |
144 Properties |
| 2010 | £181,534 | 3% |
101 Properties |
| 2009 | £176,072 | -6% |
108 Properties |
| 2008 | £187,204 | -10% |
109 Properties |
| 2007 | £206,042 | 14% |
216 Properties |
| 2006 | £177,268 | 3% |
262 Properties |
| 2005 | £172,324 | 1% |
234 Properties |
| 2004 | £170,434 | 11% |
295 Properties |
| 2003 | £150,859 | 8% |
201 Properties |
| 2002 | £139,357 | 16% |
237 Properties |
| 2001 | £117,751 | 10% |
247 Properties |
| 2000 | £105,756 | 18% |
217 Properties |
| 1999 | £86,361 | 16% |
236 Properties |
| 1998 | £72,858 | 11% |
233 Properties |
| 1997 | £64,712 | 13% |
247 Properties |
| 1996 | £56,210 | 4% |
189 Properties |
| 1995 | £53,818 | - |
134 Properties |
Property Price per Property Type in Norcot
Here you can find historic sold price data in order to help with your property search.
The average Property Paid Price for specific property types in the last three years are:
| Property Type | Average Sold Price | Sold Properties |
|---|---|---|
| Flat | £197,968.00 | 82 Flats |
| Semi Detached House | £396,000.00 | 117 Semi Detached Houses |
| Detached House | £435,862.00 | 29 Detached Houses |
| Terraced House | £322,877.00 | 187 Terraced Houses |