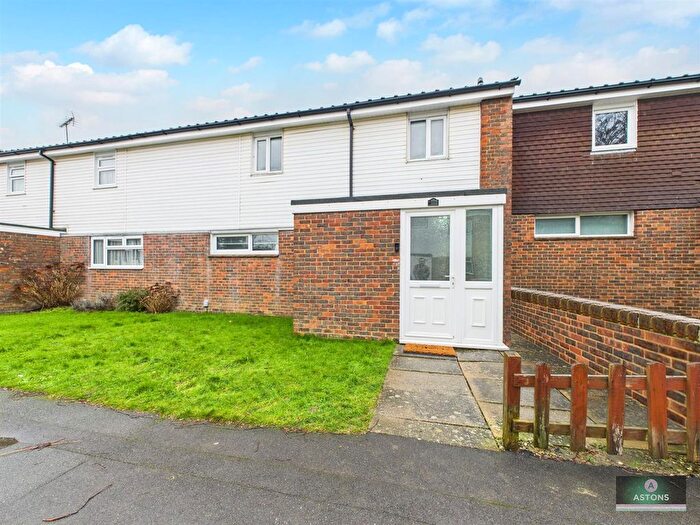
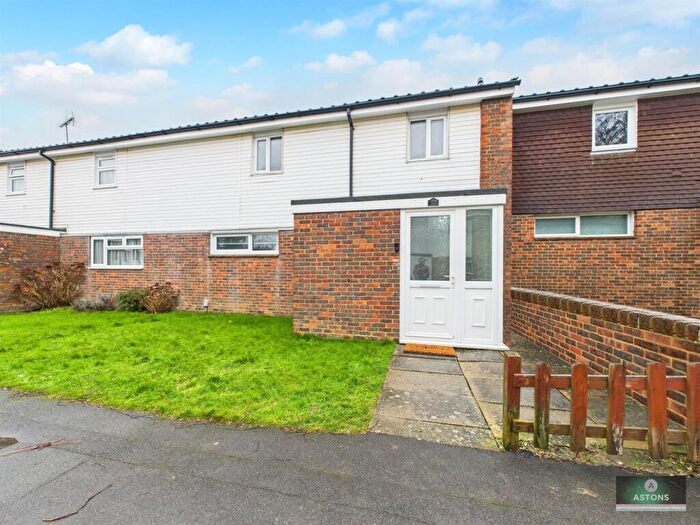
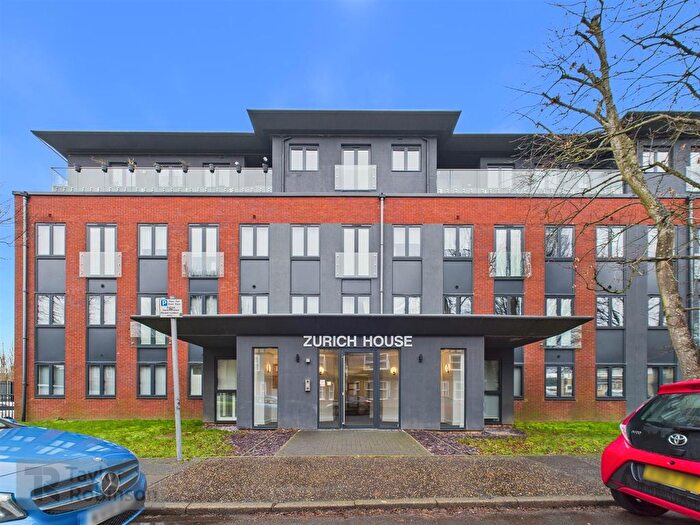
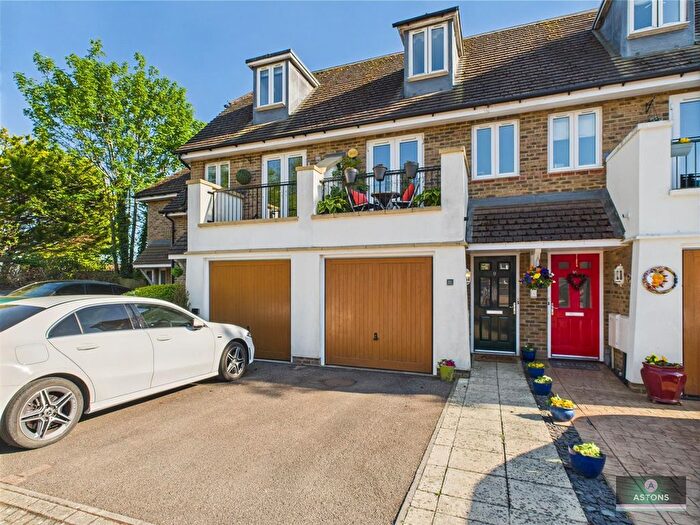
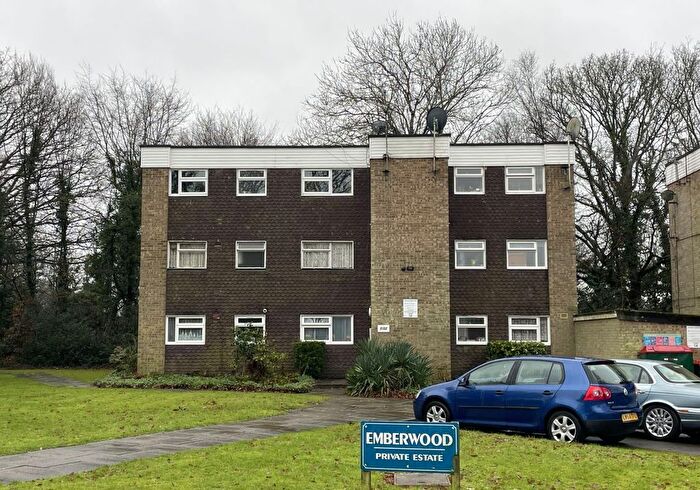
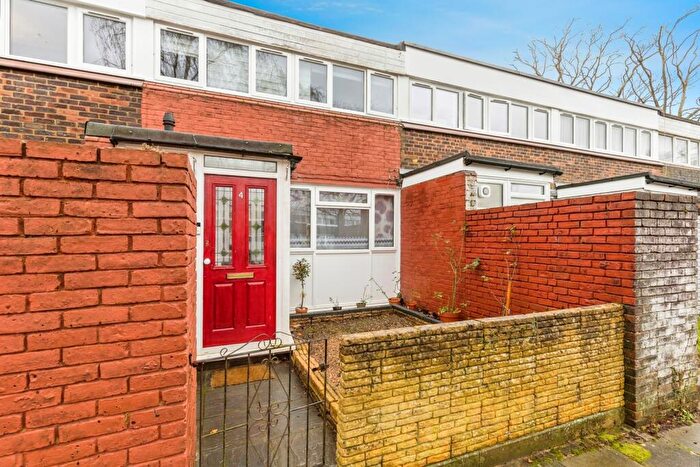
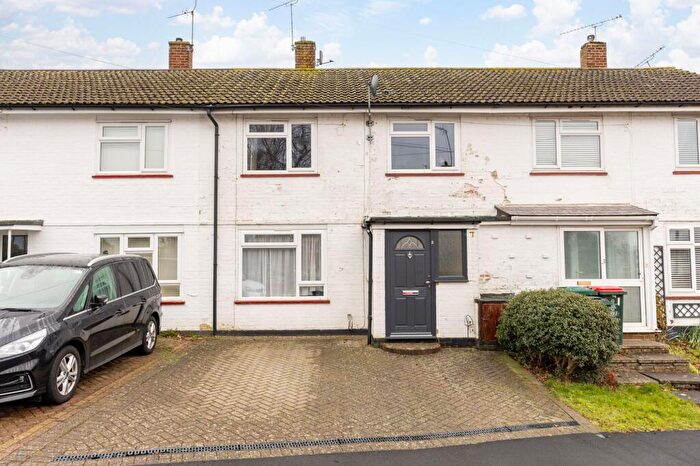
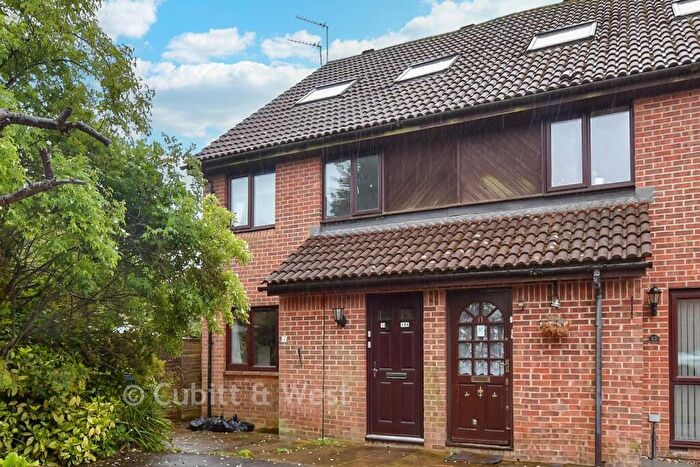
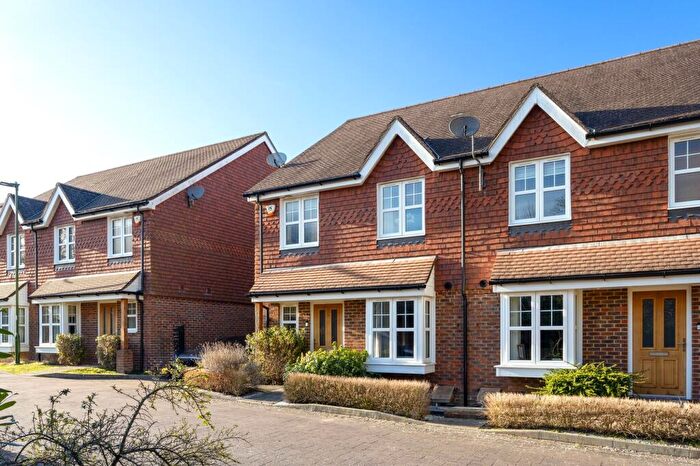
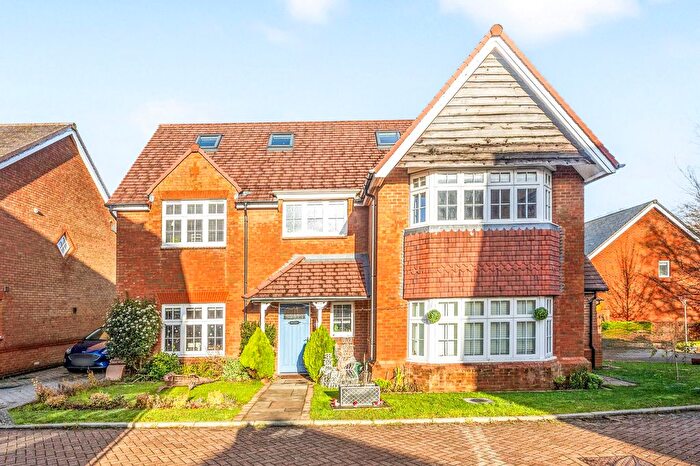
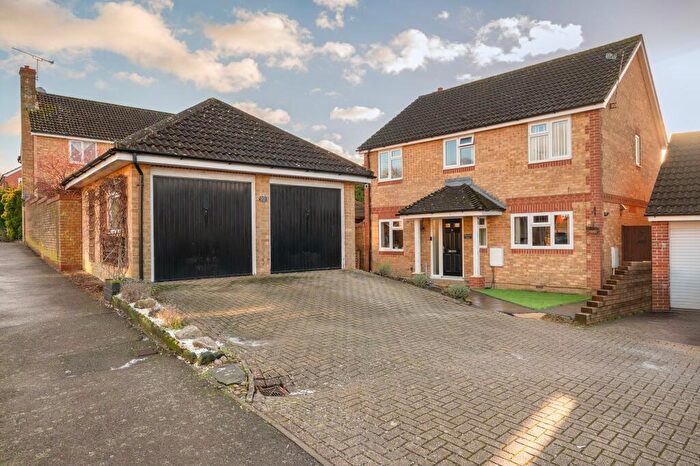
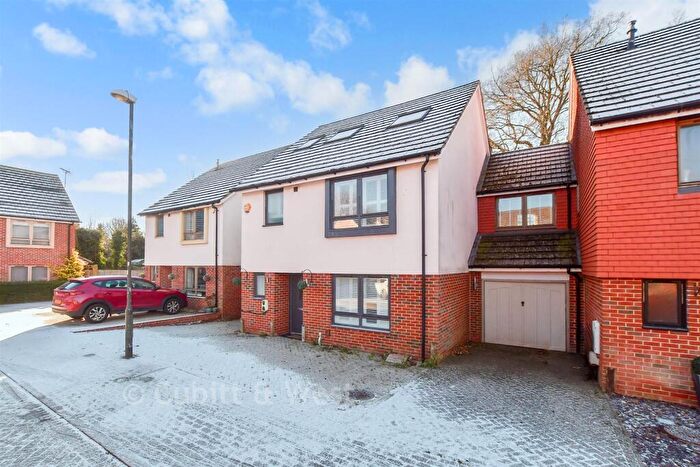
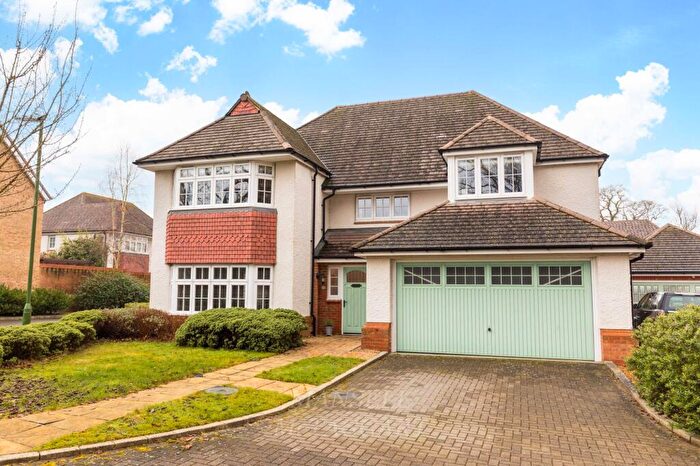
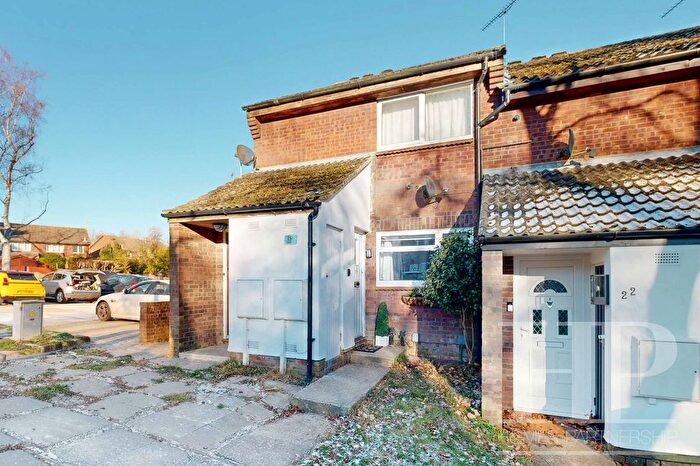
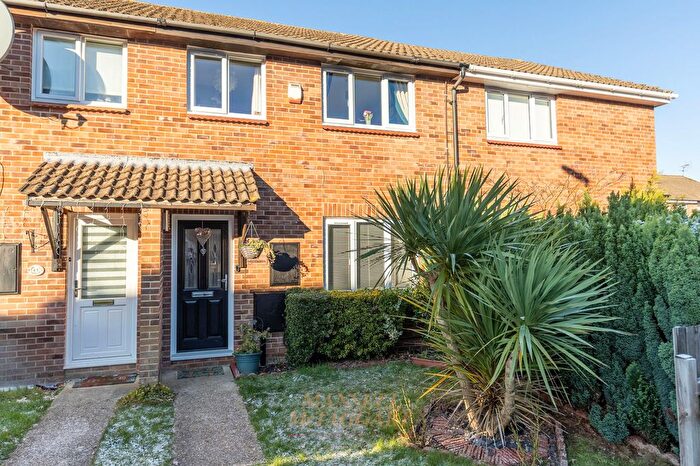
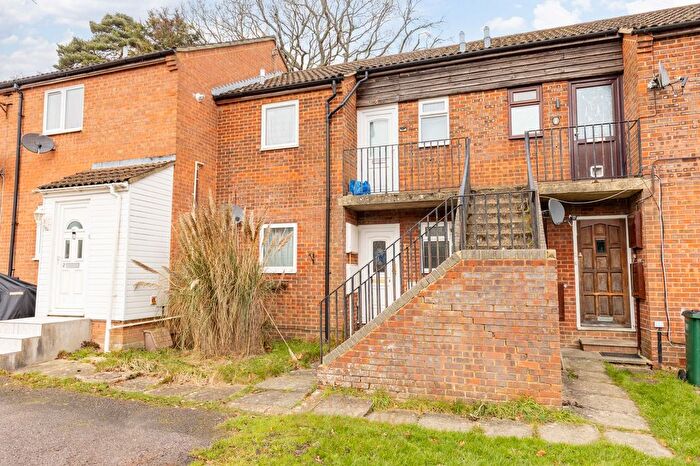
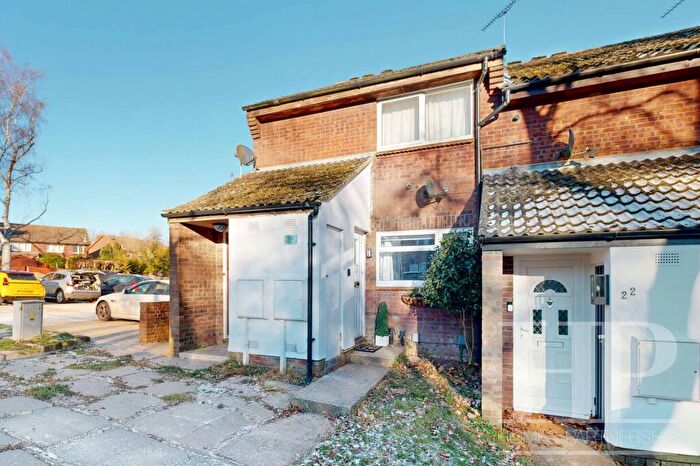
Houses for sale & to rent in Ardingly And Balcombe, Crawley
House Prices in Ardingly And Balcombe
Properties in Ardingly And Balcombe have an average house price of £501,780.00 and had 102 Property Transactions within the last 3 years¹.
Ardingly And Balcombe is an area in Crawley, West Sussex with 347 households², where the most expensive property was sold for £900,000.00.
Properties for sale in Ardingly And Balcombe
Roads and Postcodes in Ardingly And Balcombe
Navigate through our locations to find the location of your next house in Ardingly And Balcombe, Crawley for sale or to rent.
| Streets | Postcodes |
|---|---|
| Back Lane | RH10 4SG |
| Barn Close | RH11 9AN |
| Bellevue Farm Road | RH11 9GT RH11 9GU |
| Bensons Hill Road | RH11 9SF |
| Black Swan Close | RH11 9BB |
| Brighton Road | RH11 9AD RH11 9AB RH11 9GG RH11 9NG RH11 9SN RH11 9YA |
| Brougham Lane | RH11 9GP |
| Buchan Hill | RH11 9AP |
| Cherry Tree Avenue | RH11 9GW |
| Cotsford | RH11 9BF |
| Foresters Way | RH11 9GS |
| Grace Holland Avenue | RH11 9SL |
| Hansom Way | RH11 9GQ |
| Hardriding Cottages | RH11 9AA |
| Haynes Way | RH11 9GB |
| Horsham Road | RH11 9AL RH11 9AW RH11 9SG |
| Landau Close | RH11 9GR |
| Old Brighton Road | RH11 9BG |
| Old Brighton Road South | RH11 9AH RH11 9AG |
| Paddockhurst Road | RH10 4SH |
| Parish Lane | RH10 5NY |
| Quinta Mews | RH11 9FZ |
| Stanford Brook Way | RH11 9GY RH11 9GZ |
| Stanhope Road | RH11 9GL |
| Summer Barn Place | RH11 9GX |
| The Hemsleys | RH11 9BX |
| The Pavilions | RH11 9BJ |
| The Squires | RH11 9BU |
| Tilgate Forest Lodge | RH11 9AF |
| Tilgate Forest Row | RH11 9AE |
| Volante Close | RH11 9GN |
| Whalebone Wood Road | RH11 9GE |
Transport near Ardingly And Balcombe
- FAQ
- Price Paid By Year
- Property Type Price
Frequently asked questions about Ardingly And Balcombe
What is the average price for a property for sale in Ardingly And Balcombe?
The average price for a property for sale in Ardingly And Balcombe is £501,780. This amount is 36% higher than the average price in Crawley. There are 5,814 property listings for sale in Ardingly And Balcombe.
What streets have the most expensive properties for sale in Ardingly And Balcombe?
The streets with the most expensive properties for sale in Ardingly And Balcombe are Grace Holland Avenue at an average of £827,857, Whalebone Wood Road at an average of £797,500 and Bellevue Farm Road at an average of £700,619.
What streets have the most affordable properties for sale in Ardingly And Balcombe?
The streets with the most affordable properties for sale in Ardingly And Balcombe are Old Brighton Road at an average of £208,000, Black Swan Close at an average of £235,437 and Tilgate Forest Row at an average of £266,000.
Which train stations are available in or near Ardingly And Balcombe?
Some of the train stations available in or near Ardingly And Balcombe are Crawley, Ifield and Three Bridges.
Property Price Paid in Ardingly And Balcombe by Year
The average sold property price by year was:
| Year | Average Sold Price | Price Change |
Sold Properties
|
|---|---|---|---|
| 2025 | £453,178 | -9% |
14 Properties |
| 2024 | £493,226 | -39% |
28 Properties |
| 2023 | £686,575 | 37% |
20 Properties |
| 2022 | £432,381 | 1% |
40 Properties |
| 2021 | £427,248 | 5% |
95 Properties |
| 2020 | £407,022 | 5% |
65 Properties |
| 2019 | £385,681 | 8% |
22 Properties |
| 2018 | £354,916 | -34% |
18 Properties |
| 2017 | £476,425 | 15% |
68 Properties |
| 2016 | £404,301 | -7% |
27 Properties |
| 2015 | £433,602 | 39% |
45 Properties |
| 2014 | £264,679 | 10% |
37 Properties |
| 2013 | £237,208 | -3% |
12 Properties |
| 2012 | £244,239 | 2% |
24 Properties |
| 2011 | £239,283 | 2% |
12 Properties |
| 2010 | £234,471 | 13% |
14 Properties |
| 2009 | £203,353 | -49% |
14 Properties |
| 2008 | £303,588 | 0,4% |
11 Properties |
| 2007 | £302,460 | 25% |
81 Properties |
| 2006 | £225,733 | -13% |
35 Properties |
| 2005 | £256,000 | 21% |
7 Properties |
| 2004 | £202,083 | -42% |
18 Properties |
| 2003 | £287,741 | 56% |
12 Properties |
| 2002 | £127,782 | -10% |
17 Properties |
| 2001 | £140,796 | -24% |
14 Properties |
| 2000 | £174,111 | 48% |
13 Properties |
| 1999 | £91,207 | 6% |
19 Properties |
| 1998 | £85,586 | -23% |
15 Properties |
| 1997 | £105,440 | 24% |
15 Properties |
| 1996 | £79,772 | 5% |
9 Properties |
| 1995 | £76,099 | - |
10 Properties |
Property Price per Property Type in Ardingly And Balcombe
Here you can find historic sold price data in order to help with your property search.
The average Property Paid Price for specific property types in the last three years are:
| Property Type | Average Sold Price | Sold Properties |
|---|---|---|
| Semi Detached House | £457,347.00 | 23 Semi Detached Houses |
| Detached House | £635,237.00 | 33 Detached Houses |
| Terraced House | £512,333.00 | 33 Terraced Houses |
| Flat | £214,826.00 | 13 Flats |

