
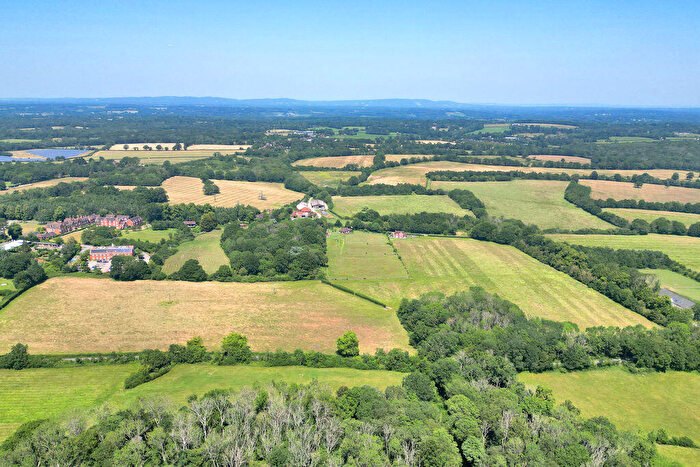
Houses for sale in West Sussex, England
House Prices in West Sussex
Properties in West Sussex have
an average house price of
£421k
and had 34,200 Property Transactions
within the last 3 years.¹
West Sussex is a location in
England with
322,713 households², where the most expensive property was sold for £6.75M.
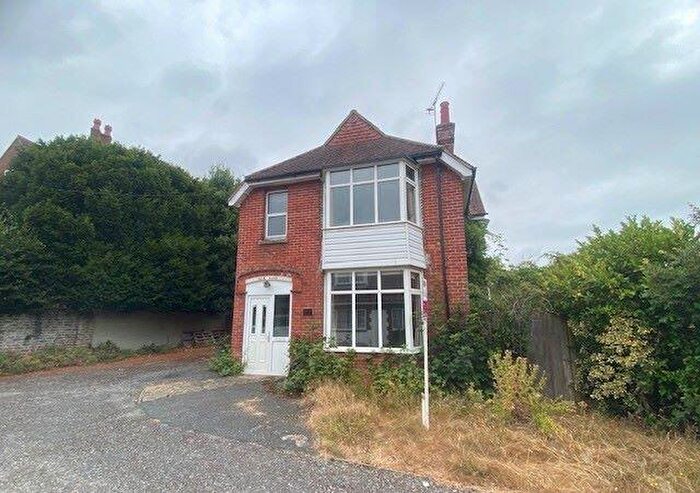
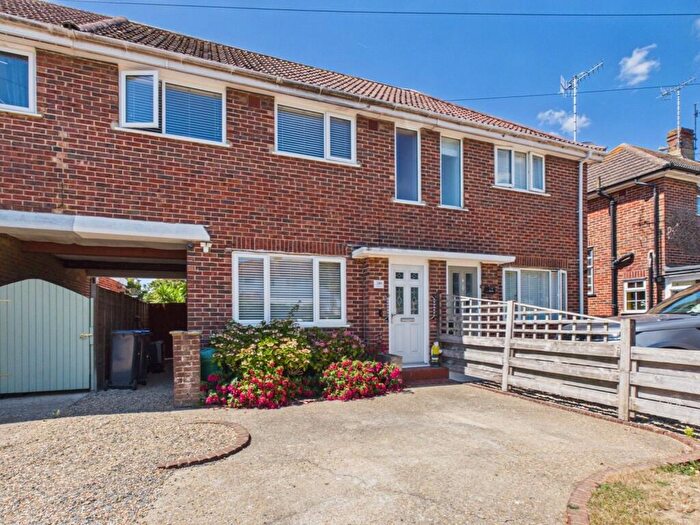
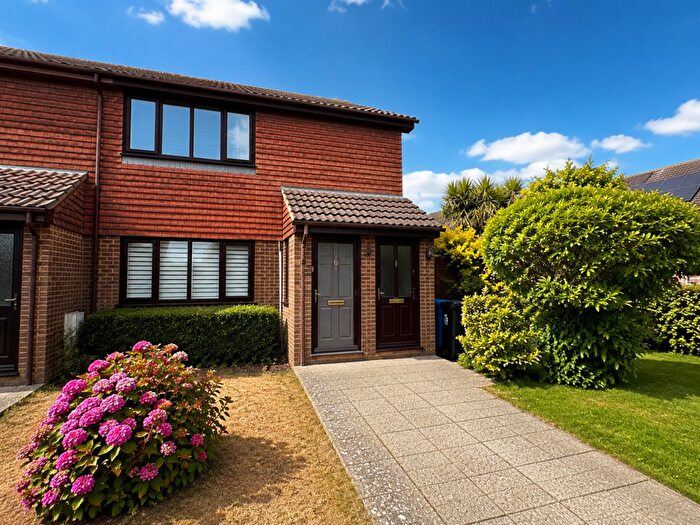
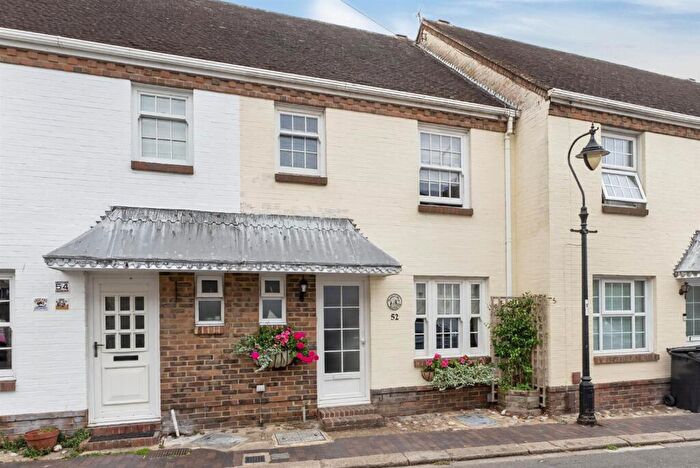
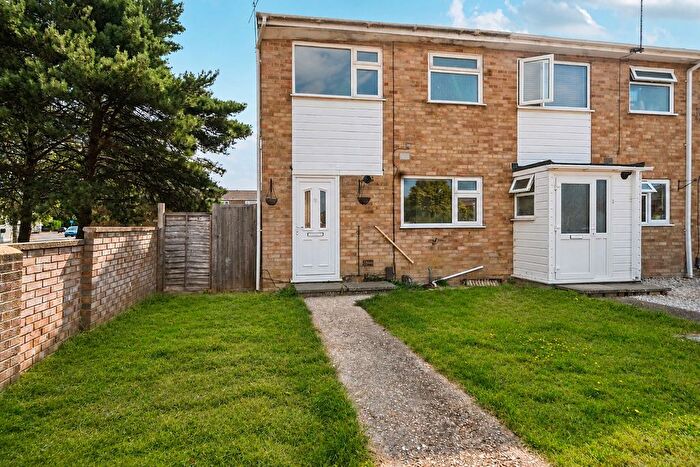
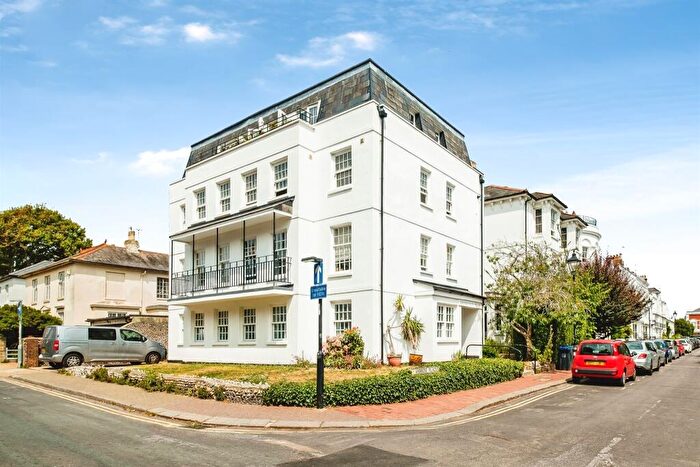
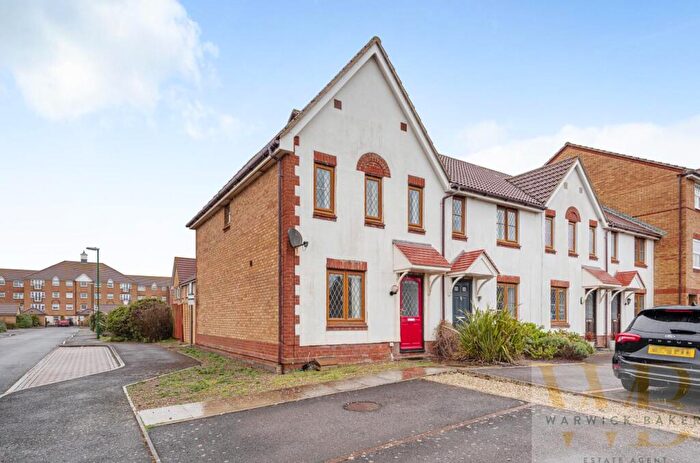
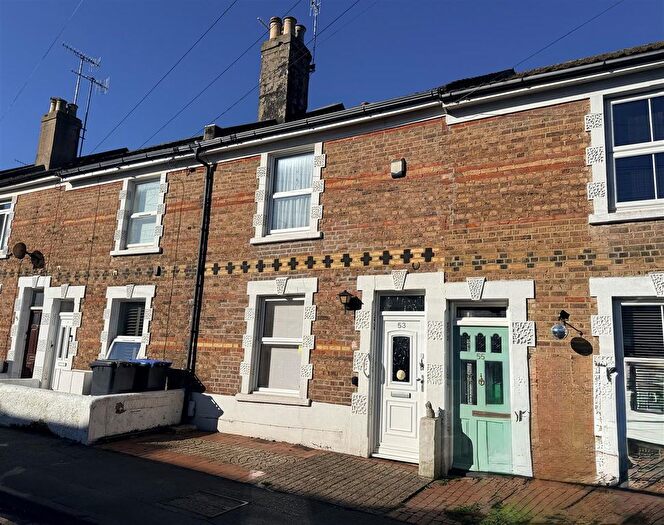
Properties for sale in West Sussex
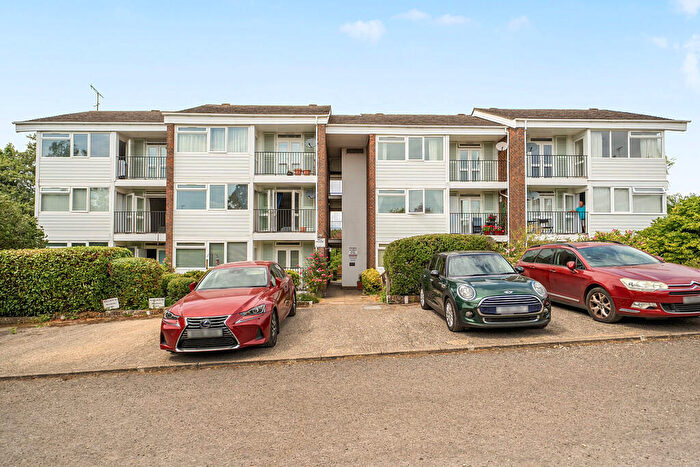
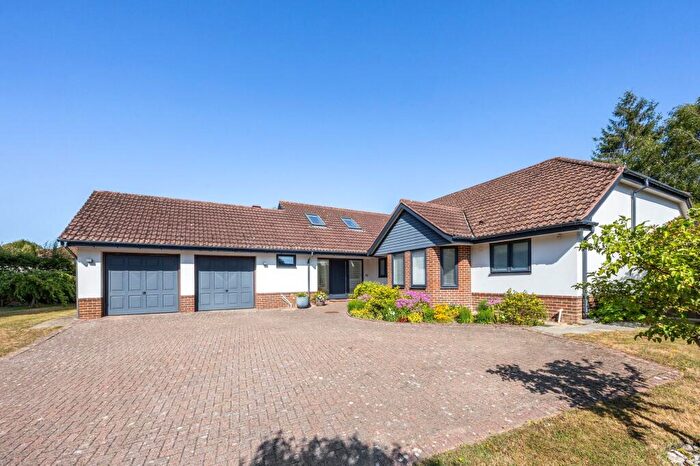
![]()
If you are looking to sell your house, let it out, or receive a property valuation, an expert can help you.
Click the button below to get started.

Towns in West Sussex
Navigate through our locations to find the location of your next house in West Sussex, England for sale or to rent.
- Liss
- Rowland's Castle
- Washington
- Burgess Hill
- Petworth
- Billingshurst
- Haywards Heath
- East Grinstead
- Hassocks
- Chichester
- Horsham
- Gatwick
- Shoreham-by-sea
- Pulborough
- Crawley
- Dorking
- Emsworth
- Worthing
- Hindhead
- Horley
- Steyning
- Brighton
- Lancing
- Midhurst
- Littlehampton
- Havant
- Bognor Regis
- Henfield
- Liphook
- Arundel
- Petersfield
Property price trends in West Sussex
According to the latest Land Registry data, the average home in West Sussex sold for £409,670 in 2026. That figure comes from a substantial record of 453,653 sales logged over the past 31 years.
Prices have softened over the last three years. Compared with 2023, when the typical sale came in around £419,883, that's a fall of roughly 2.4%.
Looking back five years, average prices are up about 1.7% since 2021, a gain of around £6,670 in cash terms.
Zoom out to the past decade for the fuller picture. Back in 2016, homes here averaged £333,088, so the typical sold price has climbed about 23% since then, roughly 2.1% a year. Stretch the view to fifteen years and that annual pace edges up closer to 3.2%.
Frequently asked questions about West Sussex
What is the average price for a property for sale in West Sussex?
The average price for a property for sale in West Sussex is £421,121. This amount is 17% higher than the average price in England. There are more than 10,000 property listings for sale in West Sussex.
What locations have the most expensive properties for sale in West Sussex?
The locations with the most expensive properties for sale in West Sussex are Liphook at an average of £982,500, Dorking at an average of £910,000 and Petersfield at an average of £888,437.
What locations have the most affordable properties for sale in West Sussex?
The locations with the most affordable properties for sale in West Sussex are Lancing at an average of £344,259, Bognor Regis at an average of £346,796 and Crawley at an average of £370,791.
Which train stations are available in or near West Sussex?
Some of the train stations available in or near West Sussex are Billingshurst, Lancing and Shoreham-By-Sea.
Property Price Paid in West Sussex by Year
The average sold property price by year was:
| Year | Average Sold Price | Price Change |
Sold Properties
|
|---|---|---|---|
| 2026 | £409,670 | -4% |
2,059 Properties |
| 2025 | £424,894 | 1% |
11,163 Properties |
| 2024 | £420,567 | 0,2% |
10,889 Properties |
| 2023 | £419,883 | -1% |
10,089 Properties |
| 2022 | £425,815 | 5% |
12,765 Properties |
| 2021 | £403,000 | 5% |
16,325 Properties |
| 2020 | £383,238 | 6% |
11,766 Properties |
| 2019 | £359,399 | 1% |
13,856 Properties |
| 2018 | £354,701 | 2% |
13,913 Properties |
| 2017 | £349,359 | 5% |
14,334 Properties |
Property Price per Property Type in West Sussex
Here you can find historic sold price data in order to help with your property search.
The average Property Paid Price for specific property types in the last three years are:
| Property Type | Average Sold Price | Sold Properties |
|---|---|---|
| Semi Detached House | £428,383.00 | 8,504 Semi Detached Houses |
| Terraced House | £354,376.00 | 8,450 Terraced Houses |
| Detached House | £661,846.00 | 8,975 Detached Houses |
| Flat | £220,631.00 | 8,271 Flats |
Transport in West Sussex
Please see below transportation links in this area:
