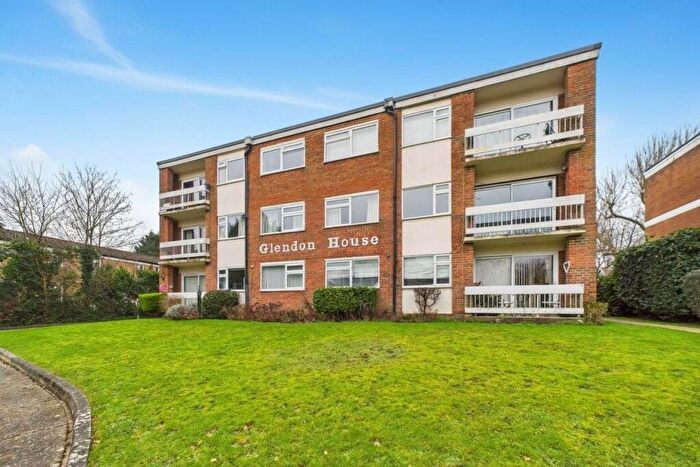
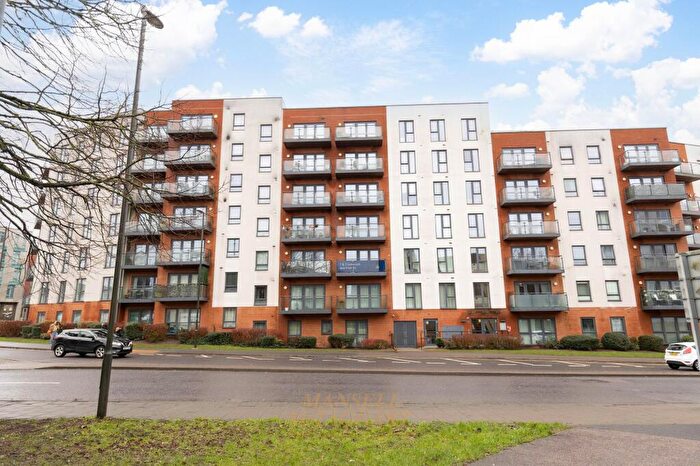
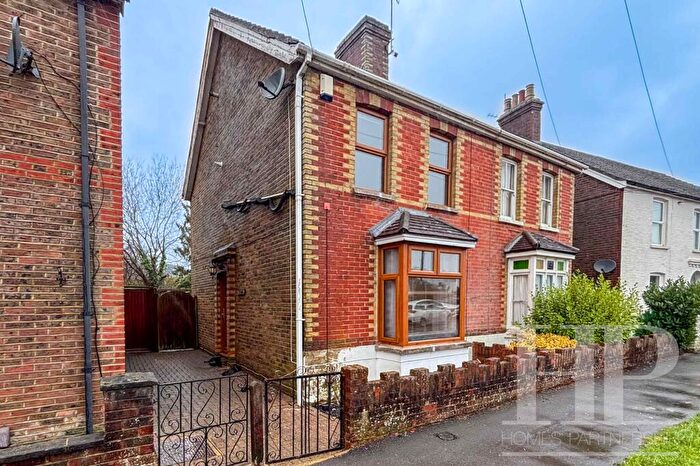
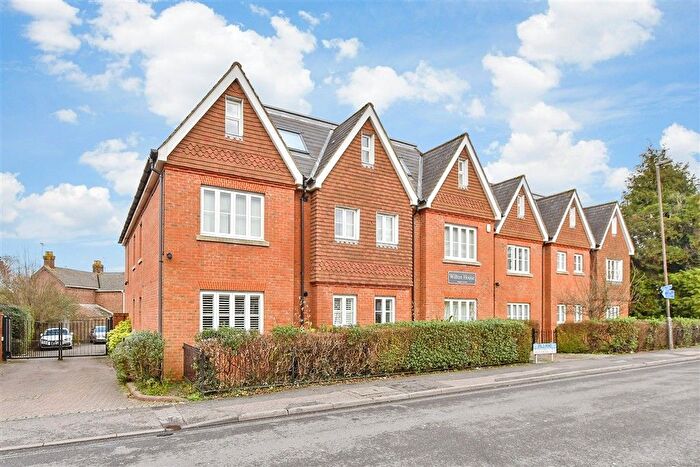
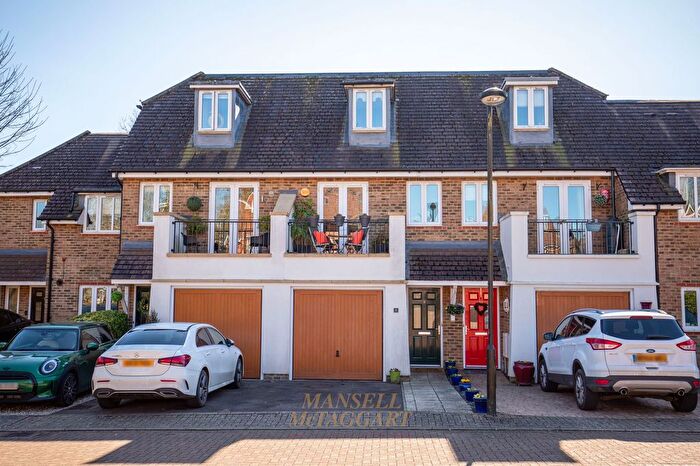
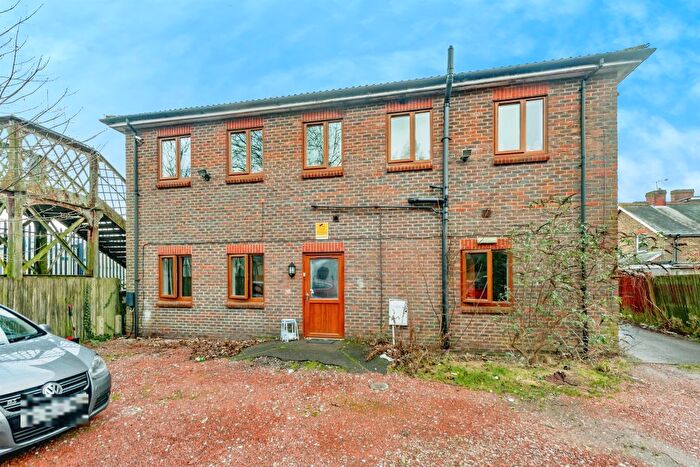
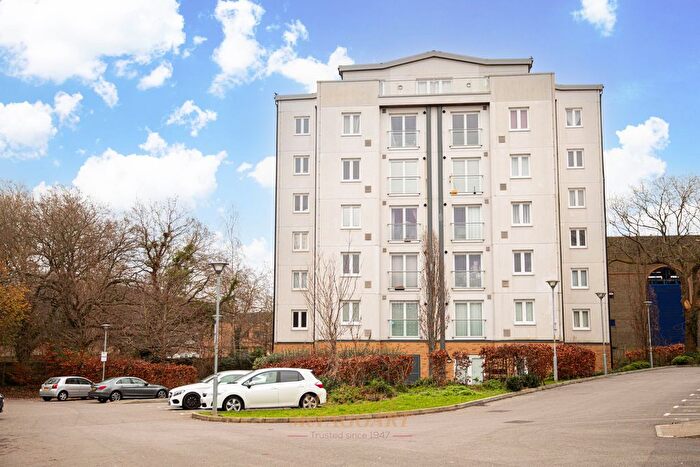
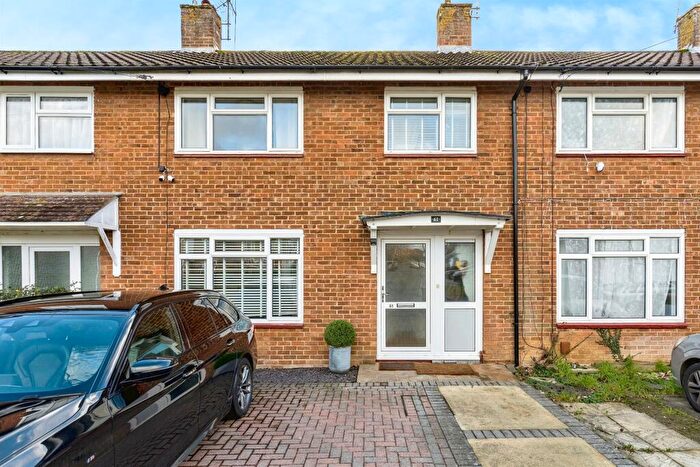
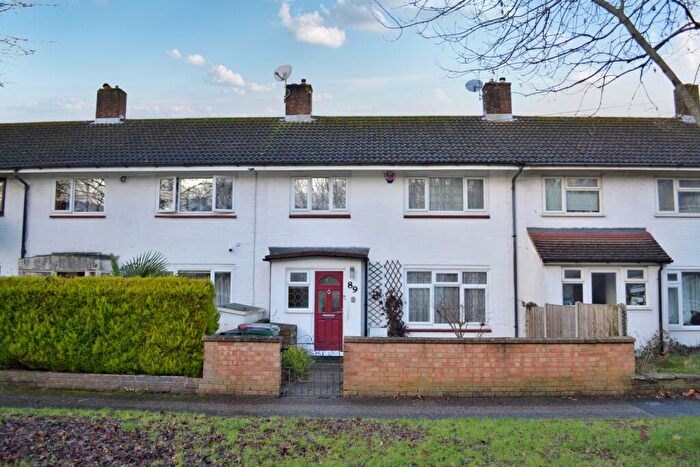
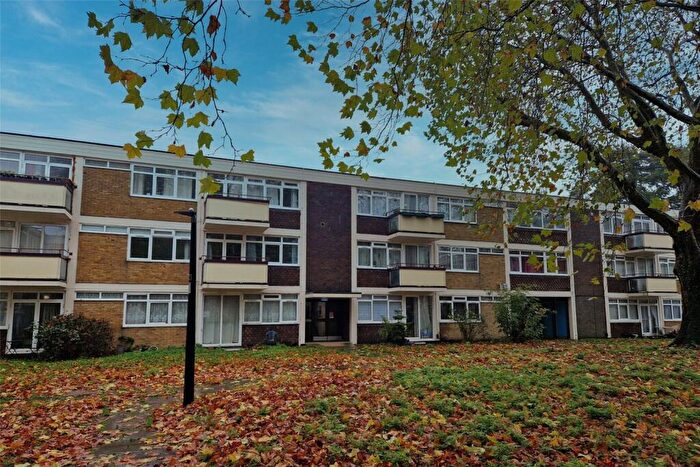
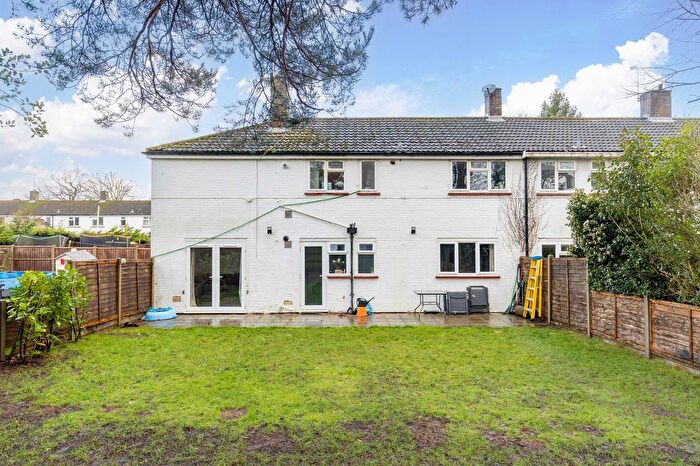
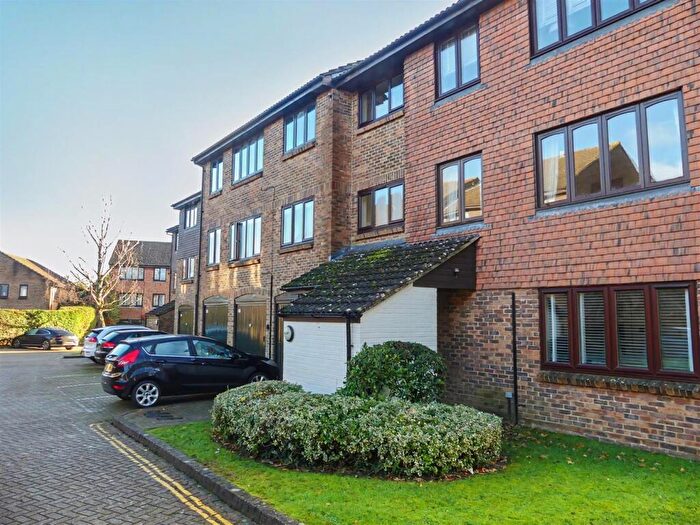
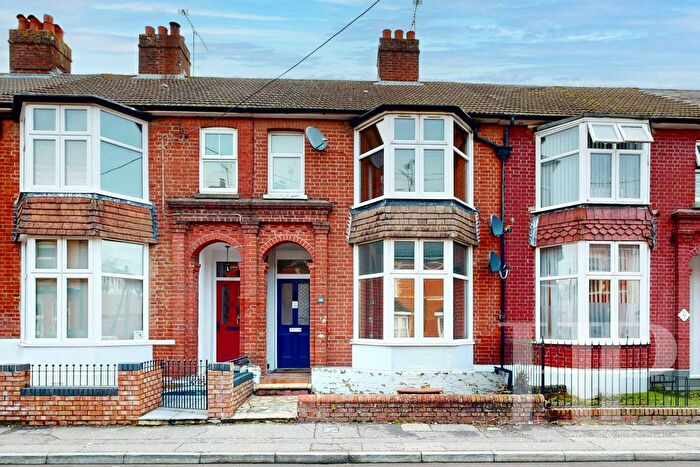
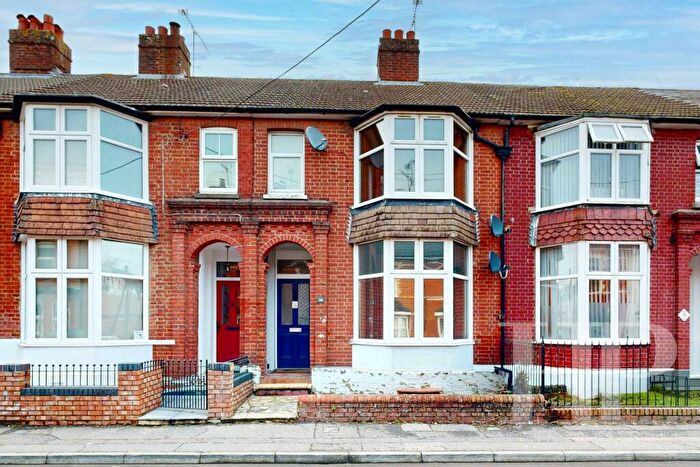
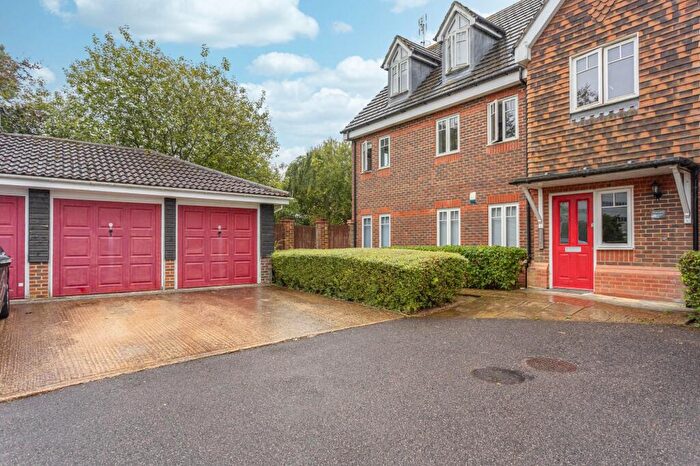
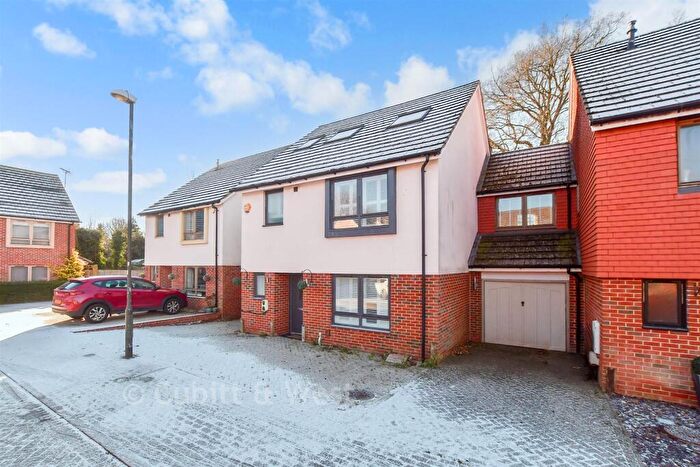
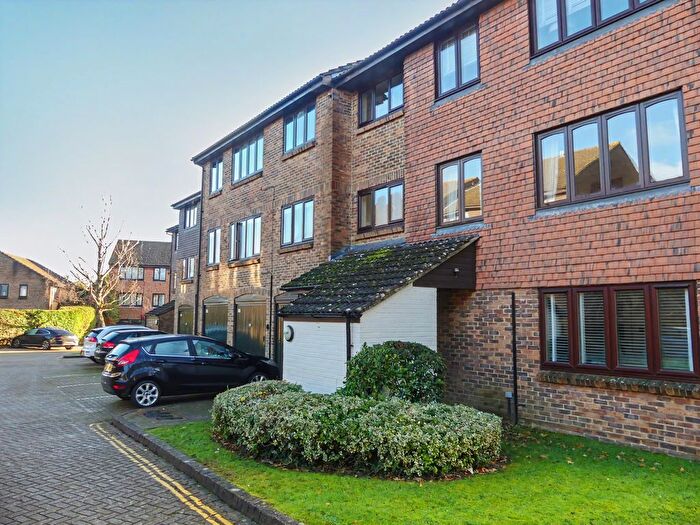
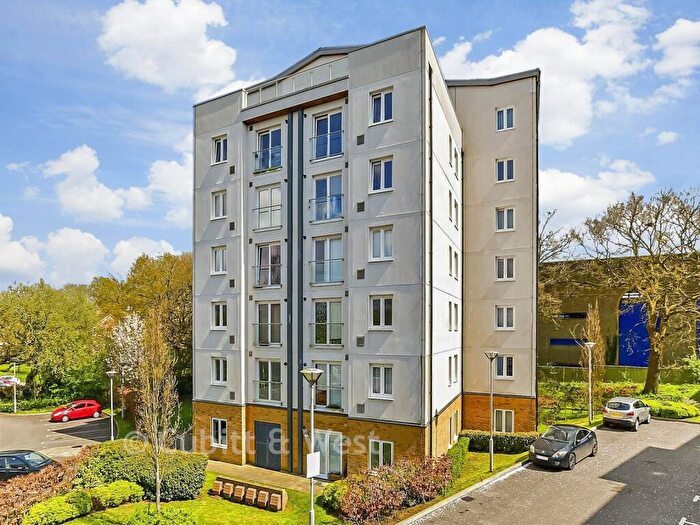
Houses for sale & to rent in West Green, Crawley
House Prices in West Green
Properties in West Green have an average house price of £336,702.00 and had 172 Property Transactions within the last 3 years¹.
West Green is an area in Crawley, West Sussex with 2,037 households², where the most expensive property was sold for £865,000.00.
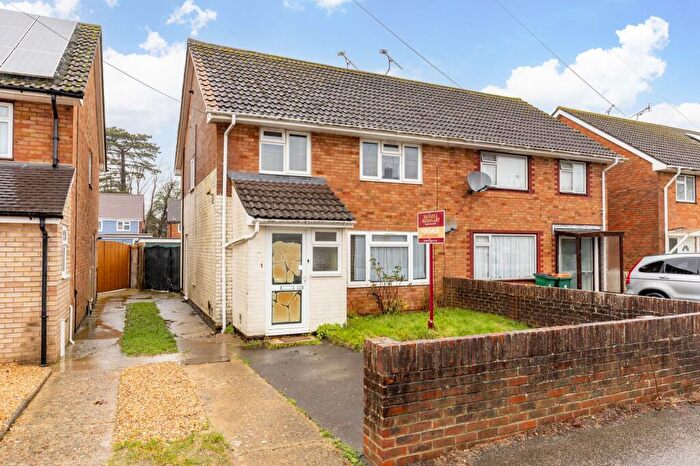
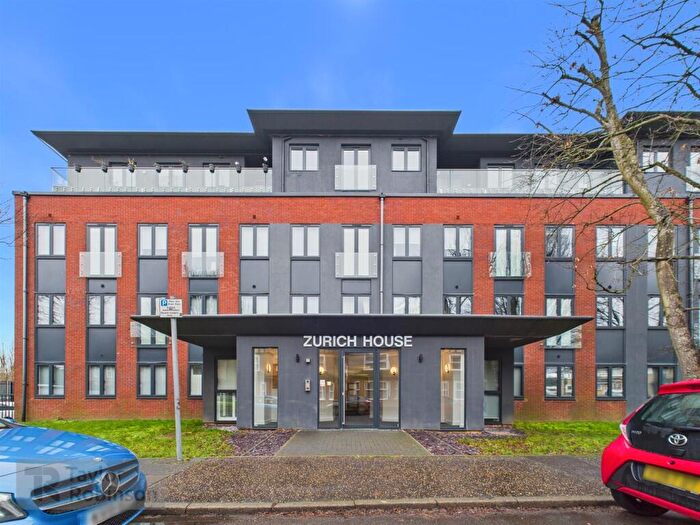
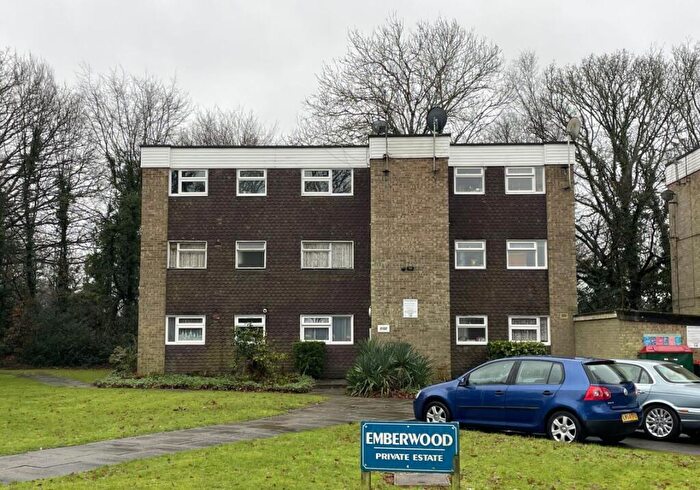
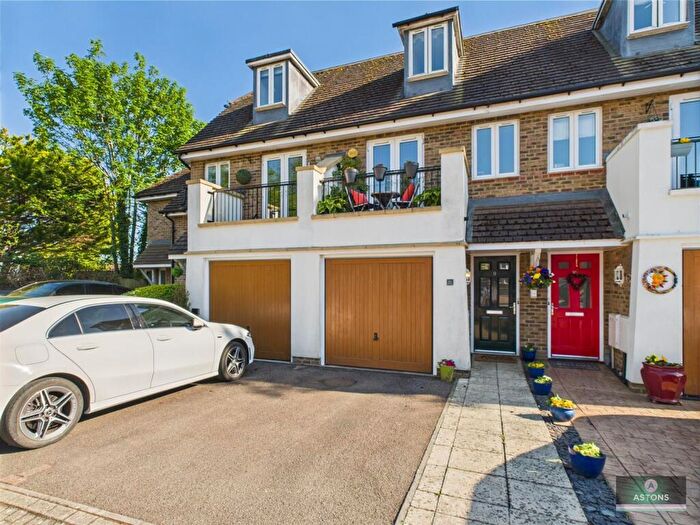
Properties for sale in West Green
Roads and Postcodes in West Green
Navigate through our locations to find the location of your next house in West Green, Crawley for sale or to rent.
| Streets | Postcodes |
|---|---|
| Albany Road | RH11 7BY RH11 7BZ RH11 7DG |
| Alpha Road | RH11 7AZ RH11 7BH |
| Buckmans Road | RH11 7DR RH11 7DS RH11 7DW |
| Butts Close | RH11 7JJ |
| Cheviot Walk | RH11 7LZ |
| Chiltern Close | RH11 7JX RH11 7JY |
| Church Street | RH11 7BG |
| Connaught Gardens | RH10 8NB |
| Copse Crescent | RH11 7HG |
| Cotswold Close | RH11 7DF |
| Crabtree Court | RH11 7GS |
| Crabtree Road | RH11 7HJ RH11 7HL |
| Deerswood Close | RH11 7JW |
| Deerswood Road | RH11 7JL RH11 7JN RH11 7JP RH11 7JR |
| Dingle Close | RH11 7NG |
| Ewhurst Close | RH11 7EZ |
| Ewhurst Road | RH11 7EY RH11 7HE RH11 7HH RH11 7HQ RH11 7JH |
| Furzefield | RH11 7JS RH11 7JT RH11 7JU |
| Garden Walk | RH11 7BX |
| Ginhams Road | RH11 7ES RH11 7ET |
| Goffs Lane | RH11 7JA |
| Grand Parade | RH10 1BU |
| High Street | RH10 1BJ RH10 1BN |
| Horsham Road | RH11 7AX RH11 7AY |
| Ifield Road | RH11 7AP RH11 7AR RH11 7AS RH11 7BB RH11 7BF RH11 7BL RH11 7BP RH11 7BQ RH11 7BW RH11 7HU RH11 7HX RH11 7HY RH11 7HZ |
| Kites Close | RH11 7DP |
| Leopold Road | RH11 7AL RH11 7BN |
| Little Crabtree | RH11 7HN RH11 7HW |
| Lodge Close | RH11 7ER |
| Meadowlands | RH11 7EN RH11 7EW |
| Mendip Walk | RH11 7JZ |
| Moorcroft Close | RH11 7HT |
| Pegler Way | RH11 7AD RH11 7GU |
| Pennine Close | RH11 7NA |
| Princess Road | RH11 7BJ |
| Prospect Place | RH11 7BA |
| Quantock Close | RH11 7LY |
| Reynolds Road | RH11 7HA |
| Richborough Court | RH11 7UL |
| Smalls Mead | RH11 7DN |
| Snell Hatch | RH11 7JB |
| Spencers Road | RH11 7DA RH11 7DE |
| St Georges Court | RH10 8LP |
| St Johns Road | RH11 7BD |
| St Peters Road | RH11 7BE |
| Sunnymead | RH11 7DU RH11 7DX RH11 7DY RH11 7DZ |
| The Dingle | RH11 7JD RH11 7JE RH11 7JF RH11 7JG |
| The Green | RH11 7HF |
| The Link | RH11 7DT |
| Town Barn Road | RH11 7EB RH11 7EE |
| Town Mead | RH11 7EF RH11 7EG RH11 7EH |
| Victoria Mews | RH11 7AB |
| Victoria Road | RH11 7AU |
| West Green Drive | RH11 7DL RH11 7EA RH11 7EL |
| Westfield Road | RH11 7BT |
| Windmill Court | RH10 8NA |
Transport near West Green
- FAQ
- Price Paid By Year
- Property Type Price
Frequently asked questions about West Green
What is the average price for a property for sale in West Green?
The average price for a property for sale in West Green is £336,702. This amount is 9% lower than the average price in Crawley. There are 1,919 property listings for sale in West Green.
What streets have the most expensive properties for sale in West Green?
The streets with the most expensive properties for sale in West Green are West Green Drive at an average of £475,000, Princess Road at an average of £473,500 and Snell Hatch at an average of £466,666.
What streets have the most affordable properties for sale in West Green?
The streets with the most affordable properties for sale in West Green are Garden Walk at an average of £86,000, Pegler Way at an average of £164,875 and Pennine Close at an average of £193,500.
Which train stations are available in or near West Green?
Some of the train stations available in or near West Green are Crawley, Ifield and Three Bridges.
Property Price Paid in West Green by Year
The average sold property price by year was:
| Year | Average Sold Price | Price Change |
Sold Properties
|
|---|---|---|---|
| 2025 | £332,581 | -3% |
46 Properties |
| 2024 | £341,029 | 2% |
61 Properties |
| 2023 | £335,556 | 3% |
65 Properties |
| 2022 | £326,515 | -1% |
68 Properties |
| 2021 | £329,459 | 6% |
68 Properties |
| 2020 | £310,959 | 9% |
49 Properties |
| 2019 | £282,935 | -0,5% |
47 Properties |
| 2018 | £284,343 | 2% |
59 Properties |
| 2017 | £277,906 | 2% |
78 Properties |
| 2016 | £271,634 | 12% |
66 Properties |
| 2015 | £239,217 | 5% |
72 Properties |
| 2014 | £227,821 | 7% |
76 Properties |
| 2013 | £211,634 | 10% |
58 Properties |
| 2012 | £190,166 | 2% |
42 Properties |
| 2011 | £187,249 | -10% |
53 Properties |
| 2010 | £205,042 | 16% |
40 Properties |
| 2009 | £171,343 | -14% |
45 Properties |
| 2008 | £194,858 | -3% |
73 Properties |
| 2007 | £201,186 | 10% |
121 Properties |
| 2006 | £180,894 | 6% |
110 Properties |
| 2005 | £170,695 | -10% |
91 Properties |
| 2004 | £187,134 | 20% |
109 Properties |
| 2003 | £150,349 | 11% |
76 Properties |
| 2002 | £133,640 | 13% |
92 Properties |
| 2001 | £115,656 | 11% |
85 Properties |
| 2000 | £102,707 | 20% |
72 Properties |
| 1999 | £81,924 | -2% |
98 Properties |
| 1998 | £83,735 | 21% |
67 Properties |
| 1997 | £66,096 | 13% |
108 Properties |
| 1996 | £57,360 | 8% |
62 Properties |
| 1995 | £52,616 | - |
62 Properties |
Property Price per Property Type in West Green
Here you can find historic sold price data in order to help with your property search.
The average Property Paid Price for specific property types in the last three years are:
| Property Type | Average Sold Price | Sold Properties |
|---|---|---|
| Semi Detached House | £379,449.00 | 64 Semi Detached Houses |
| Detached House | £468,636.00 | 11 Detached Houses |
| Terraced House | £357,245.00 | 57 Terraced Houses |
| Flat | £202,750.00 | 40 Flats |

