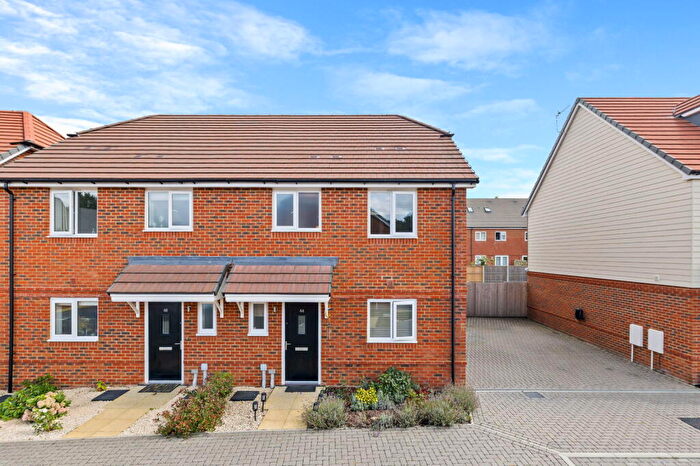
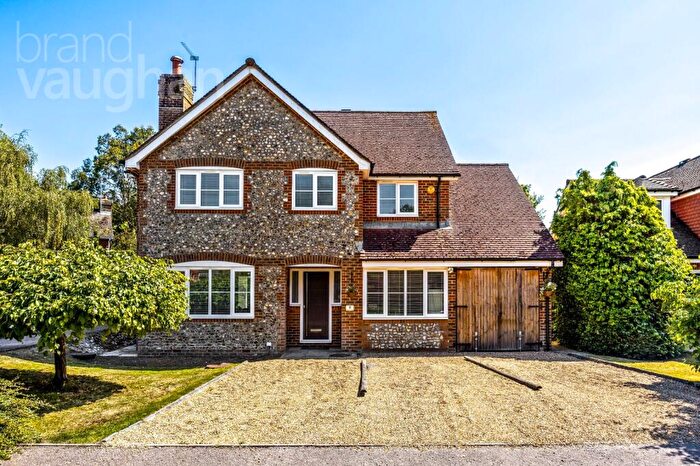
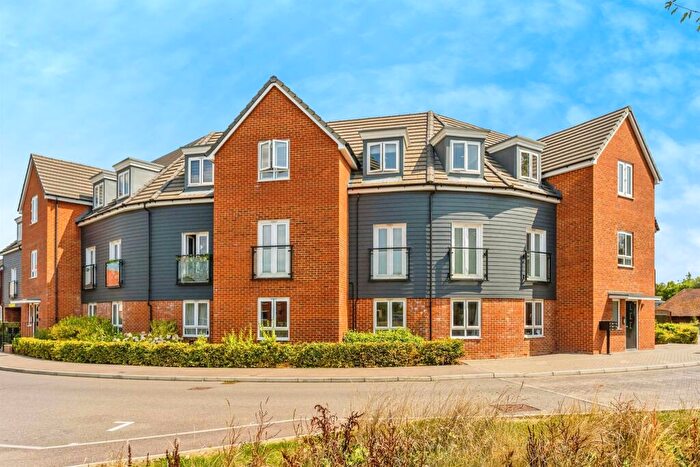
Houses for sale & to rent in Bolney, Hassocks
House Prices in Bolney
Properties in Bolney have an average house price of £1,073,819.00 and had 29 Property Transactions within the last 3 years¹.
Bolney is an area in Hassocks, West Sussex with 263 households², where the most expensive property was sold for £4,200,000.00.
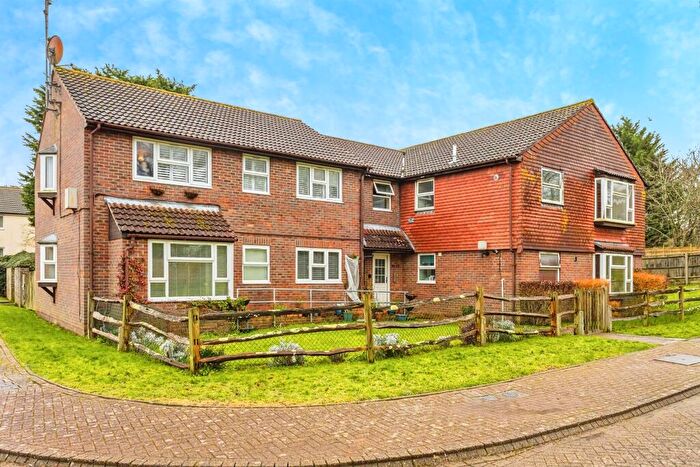
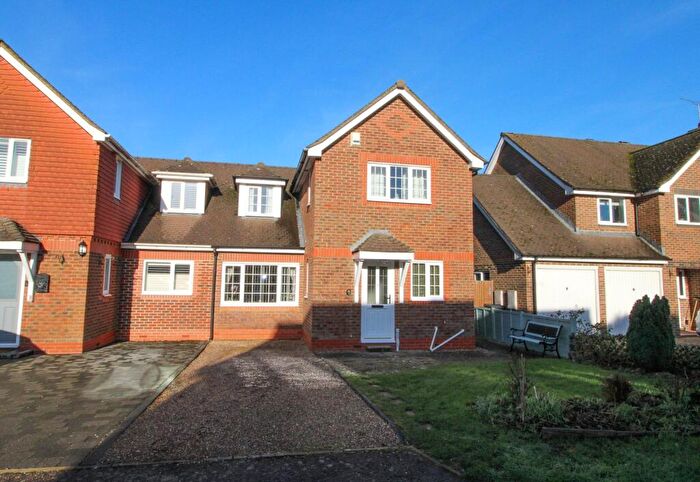
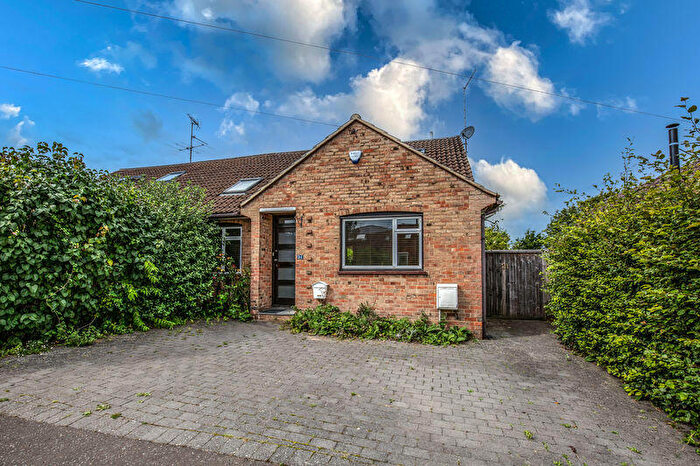
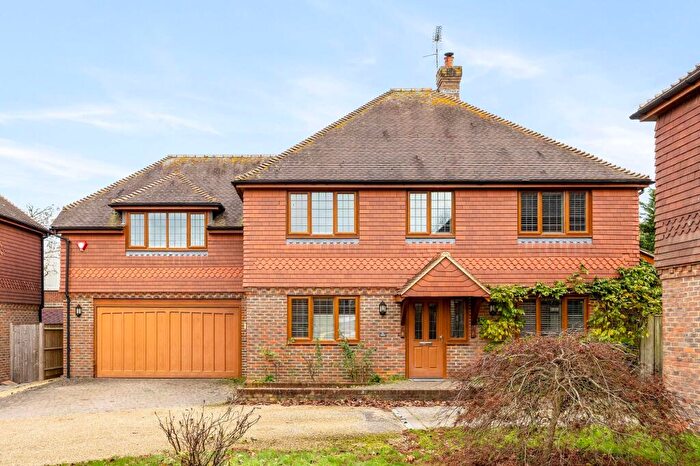
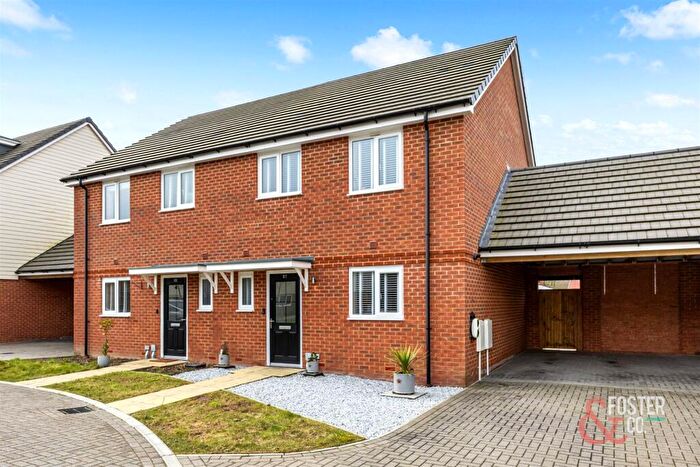
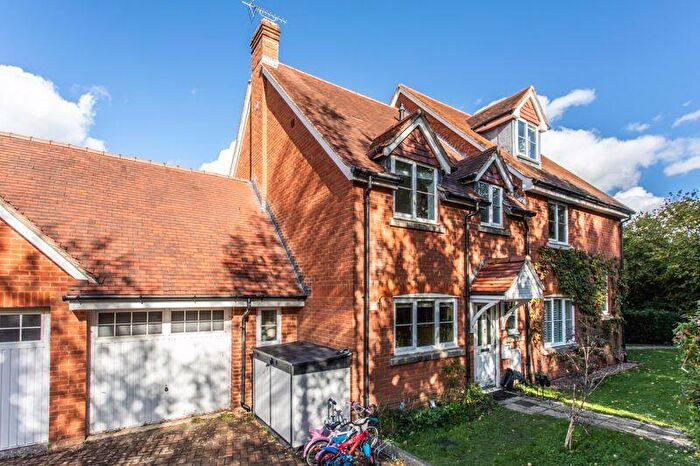
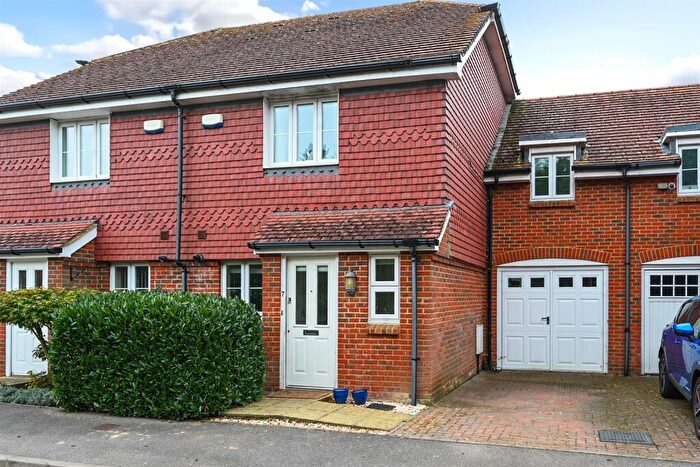
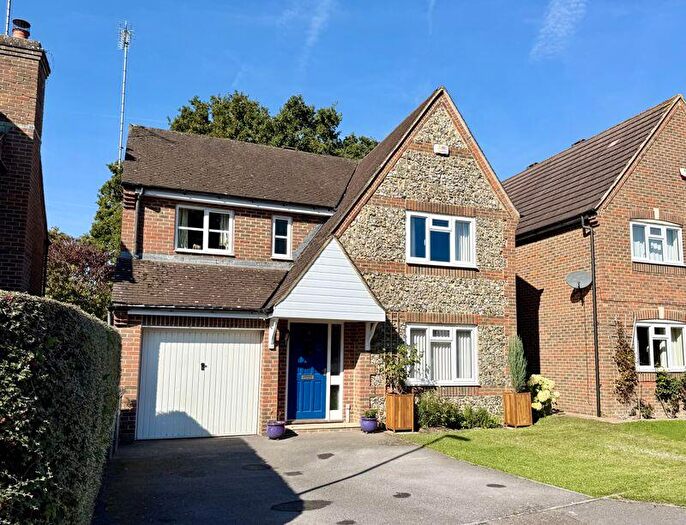
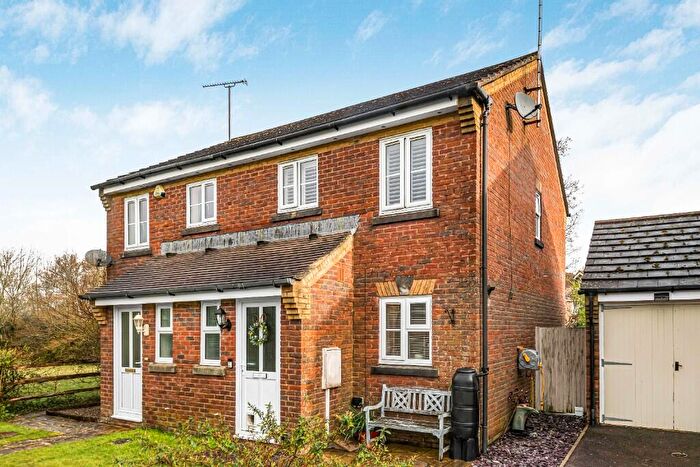
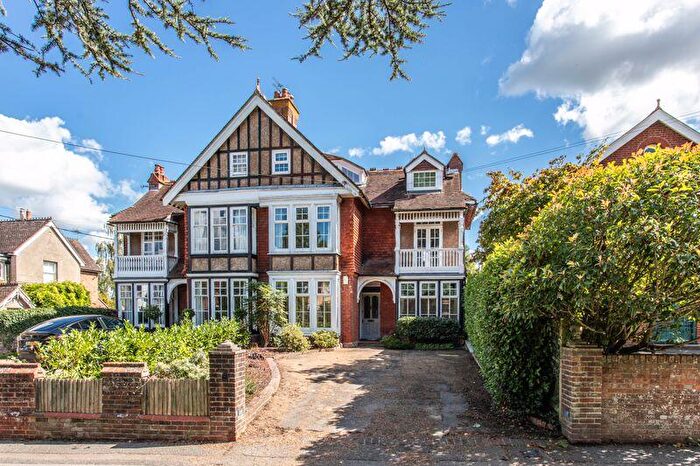
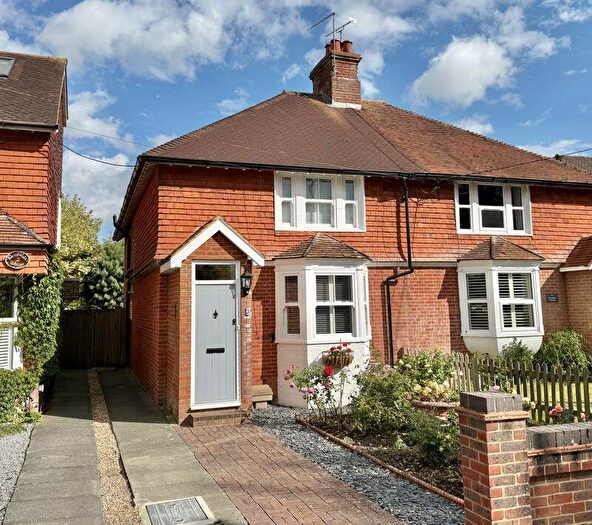
Properties for sale in Bolney
Roads and Postcodes in Bolney
Navigate through our locations to find the location of your next house in Bolney, Hassocks for sale or to rent.
| Streets | Postcodes |
|---|---|
| Barley Croft | BN6 9DN |
| Barn Close | BN6 9DG |
| Blackstone Lane | BN6 9JD |
| Church Lane | BN6 9BX BN6 9BY BN6 9BZ |
| Henfield Road | BN6 9DB BN6 9DD BN6 9DE BN6 9DR BN6 9DS BN6 9JH BN6 9FF |
| Holders | BN6 9DZ |
| Hunters Mead | BN6 9DL |
| Leyfield | BN6 9DA |
| London Road | BN6 9BJ BN6 9BL BN6 9BW BN6 9BN BN6 9BQ |
| Magnolia Court | BN6 9FY |
| Muddleswood Road | BN6 9EB |
| Oakvale Cottages | BN6 9DP |
| Oakwell | BN6 9FR |
| Pookbourne Lane | BN6 9HD |
| Shaves Wood Lane | BN6 9DX BN6 9DY |
| The Street | BN6 9DJ BN6 9DH |
| The Twitten | BN6 9DF |
| Truslers Hill Lane | BN6 9DT BN6 9DU BN6 9JL BN6 9JN |
| Twineham Lane | BN6 9JP BN6 9JE |
Transport near Bolney
- FAQ
- Price Paid By Year
- Property Type Price
Frequently asked questions about Bolney
What is the average price for a property for sale in Bolney?
The average price for a property for sale in Bolney is £1,073,819. This amount is 78% higher than the average price in Hassocks. There are 220 property listings for sale in Bolney.
What streets have the most expensive properties for sale in Bolney?
The streets with the most expensive properties for sale in Bolney are Truslers Hill Lane at an average of £1,714,166, The Street at an average of £1,360,500 and Church Lane at an average of £1,302,752.
What streets have the most affordable properties for sale in Bolney?
The streets with the most affordable properties for sale in Bolney are Barn Close at an average of £446,000, Hunters Mead at an average of £531,000 and London Road at an average of £880,833.
Which train stations are available in or near Bolney?
Some of the train stations available in or near Bolney are Hassocks, Burgess Hill and Wivelsfield.
Property Price Paid in Bolney by Year
The average sold property price by year was:
| Year | Average Sold Price | Price Change |
Sold Properties
|
|---|---|---|---|
| 2025 | £1,197,250 | 42% |
10 Properties |
| 2024 | £696,378 | 16% |
6 Properties |
| 2023 | £583,333 | -127% |
3 Properties |
| 2022 | £1,324,000 | 52% |
10 Properties |
| 2021 | £641,458 | 5% |
12 Properties |
| 2020 | £607,745 | -5% |
10 Properties |
| 2019 | £639,416 | -7% |
12 Properties |
| 2018 | £685,500 | 21% |
6 Properties |
| 2017 | £544,444 | 14% |
9 Properties |
| 2016 | £469,850 | 17% |
10 Properties |
| 2015 | £392,066 | -15% |
20 Properties |
| 2014 | £451,491 | 13% |
6 Properties |
| 2013 | £392,000 | -7% |
9 Properties |
| 2012 | £418,045 | 4% |
11 Properties |
| 2011 | £400,227 | -19% |
11 Properties |
| 2010 | £475,757 | 28% |
13 Properties |
| 2009 | £342,333 | -96% |
6 Properties |
| 2008 | £671,600 | 17% |
5 Properties |
| 2007 | £554,436 | 48% |
8 Properties |
| 2006 | £289,416 | -43% |
6 Properties |
| 2005 | £412,500 | 10% |
3 Properties |
| 2004 | £370,658 | 32% |
6 Properties |
| 2003 | £251,766 | -15% |
15 Properties |
| 2002 | £290,357 | 41% |
7 Properties |
| 2001 | £170,277 | -17% |
9 Properties |
| 2000 | £199,583 | 25% |
12 Properties |
| 1999 | £148,928 | 3% |
14 Properties |
| 1998 | £143,867 | -21% |
11 Properties |
| 1997 | £173,850 | 22% |
14 Properties |
| 1996 | £135,744 | -0,4% |
19 Properties |
| 1995 | £136,308 | - |
7 Properties |
Property Price per Property Type in Bolney
Here you can find historic sold price data in order to help with your property search.
The average Property Paid Price for specific property types in the last three years are:
| Property Type | Average Sold Price | Sold Properties |
|---|---|---|
| Semi Detached House | £557,700.00 | 10 Semi Detached Houses |
| Terraced House | £630,000.00 | 4 Terraced Houses |
| Detached House | £1,536,251.00 | 15 Detached Houses |

