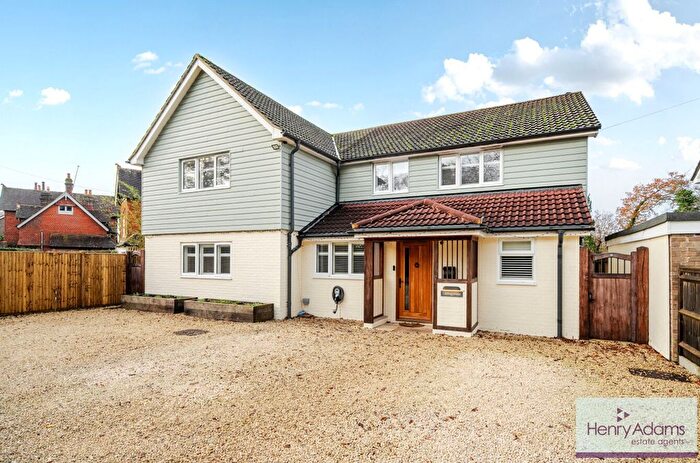
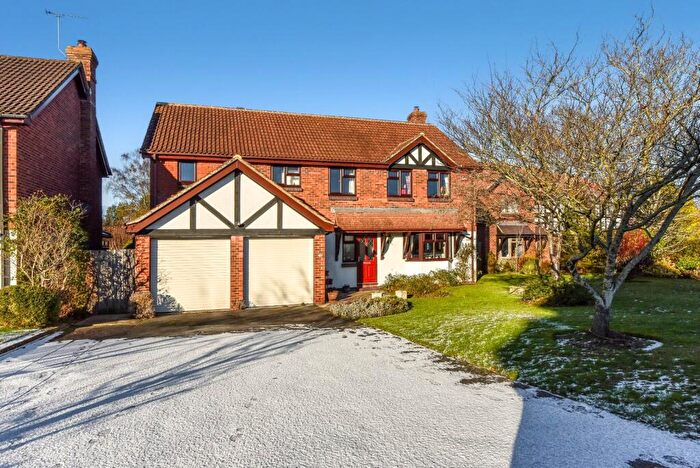
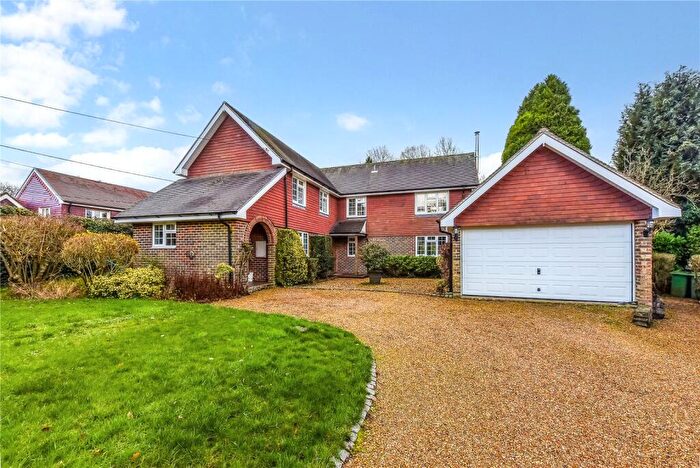
Houses for sale & to rent in Harting, Petersfield
House Prices in Harting
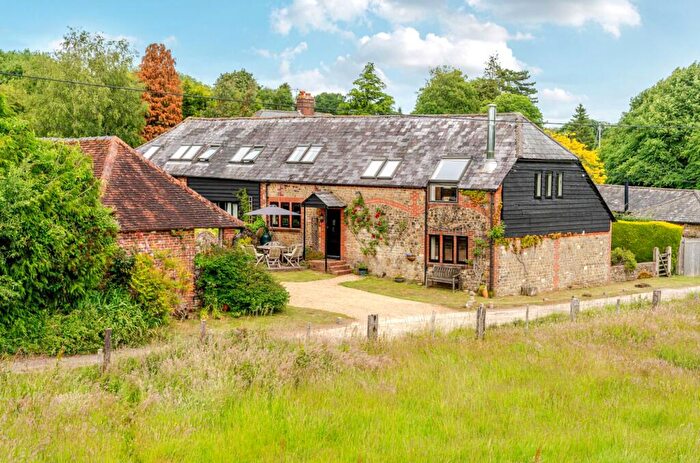
Properties in Harting have an average house price of £932,083.00 and had 6 Property Transactions within the last 3 years¹.
Harting is an area in Petersfield, West Sussex with 91 households², where the most expensive property was sold for £2,650,000.00.
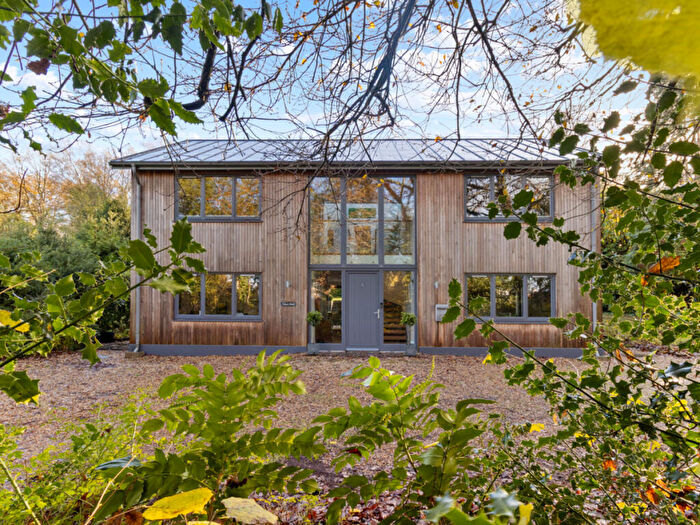
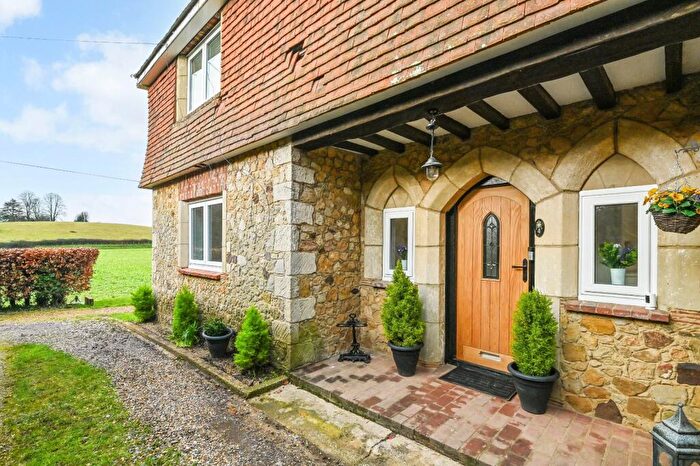
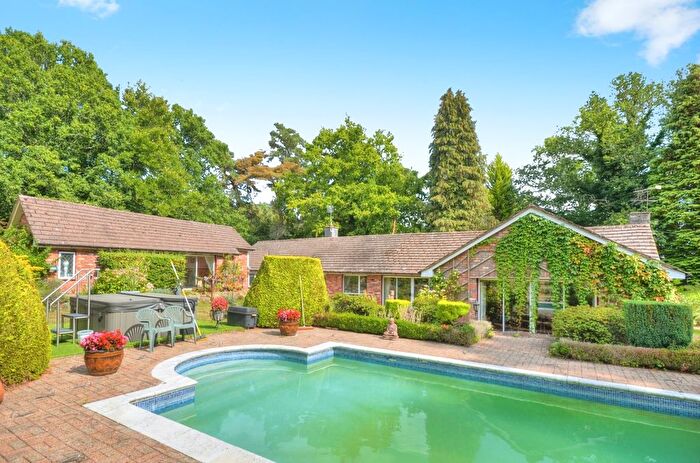
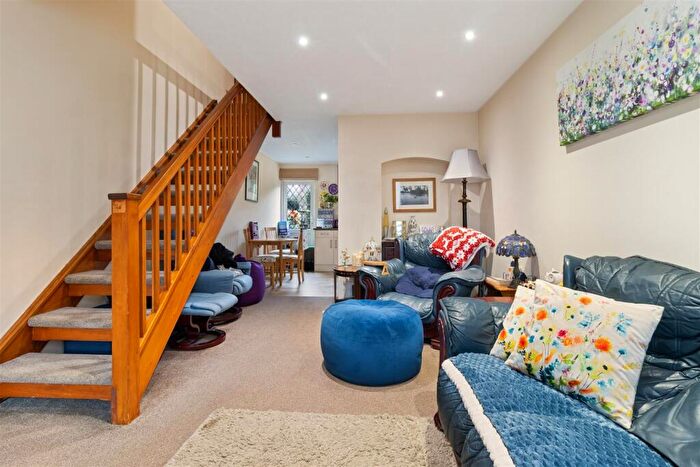
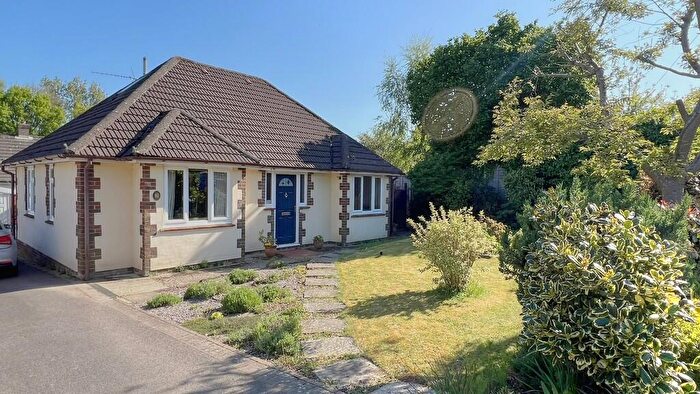
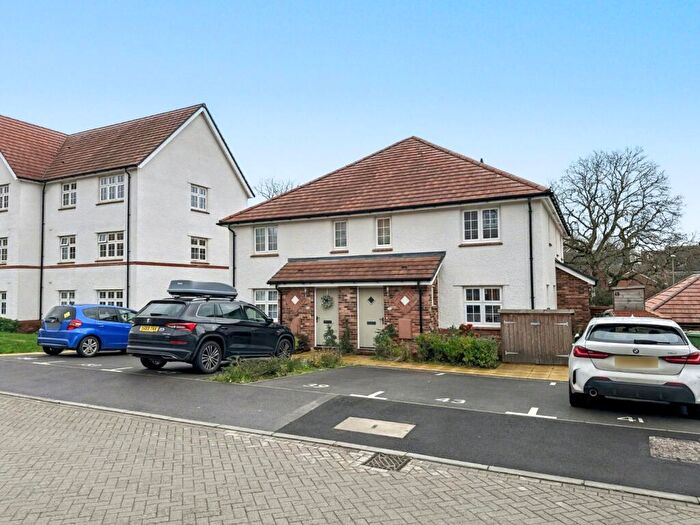
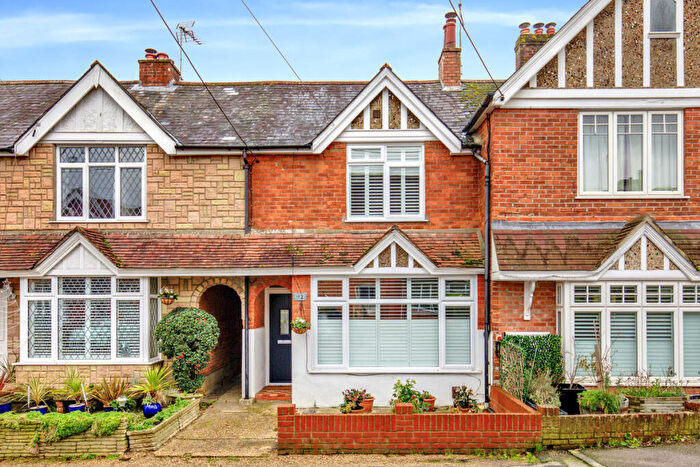
Properties for sale in Harting
Roads and Postcodes in Harting
Navigate through our locations to find the location of your next house in Harting, Petersfield for sale or to rent.
| Streets | Postcodes |
|---|---|
| Furze Meadow | GU31 5JB |
| Hill Brow | GU33 7NX GU33 7QS |
| Hugo Platt | GU31 5HD |
| Langley Lane | GU33 7JN |
| London Road | GU33 7JB GU33 7JQ GU33 7NN GU33 7QL |
| Nyewood Industries | GU31 5HA |
| Park Cottages | GU31 5QR |
| Parsonage Estate | GU31 5BF |
| Putmans Lane | GU31 5PB |
| Rake Business Park | GU33 7PN |
| Rake Industries | GU31 5DU |
| Rogate | GU31 5BJ GU31 5DB GU31 5DL GU31 5DP GU31 5HR GU31 5HW |
| The Chequers | GU31 5JE |
| Tipper Lane | GU31 5QT |
| West Harting Road | GU31 5BG |
| GU31 5EY GU31 5EZ GU31 5HB GU31 5HZ GU31 5JL GU31 5LP GU31 5LX GU31 5NA GU31 5ND GU31 5NS GU31 5PJ GU31 5PN GU31 5PU GU31 5QF GU31 5QG GU31 5QS GU31 5PT |
Transport near Harting
- FAQ
- Price Paid By Year
- Property Type Price
Frequently asked questions about Harting
What is the average price for a property for sale in Harting?
The average price for a property for sale in Harting is £932,083. There are 2,083 property listings for sale in Harting.
What streets have the most expensive properties for sale in Harting?
The street with the most expensive properties for sale in Harting is Rogate at an average of £762,500.
What streets have the most affordable properties for sale in Harting?
The street with the most affordable properties for sale in Harting is Furze Meadow at an average of £433,750.
Which train stations are available in or near Harting?
Some of the train stations available in or near Harting are Liss, Petersfield and Liphook.
Property Price Paid in Harting by Year
The average sold property price by year was:
| Year | Average Sold Price | Price Change |
Sold Properties
|
|---|---|---|---|
| 2024 | £451,250 | -206% |
2 Properties |
| 2023 | £1,380,000 | 60% |
3 Properties |
| 2022 | £550,000 | 23% |
1 Property |
| 2020 | £426,250 | -90% |
2 Properties |
| 2019 | £810,000 | 38% |
1 Property |
| 2018 | £503,333 | -92% |
3 Properties |
| 2017 | £965,000 | 71% |
1 Property |
| 2016 | £280,000 | - |
2 Properties |
Property Price per Property Type in Harting
Here you can find historic sold price data in order to help with your property search.
The average Property Paid Price for specific property types in the last three years are:
| Property Type | Average Sold Price | Sold Properties |
|---|---|---|
| Semi Detached House | £908,500.00 | 5 Semi Detached Houses |
| Detached House | £1,050,000.00 | 1 Detached House |

