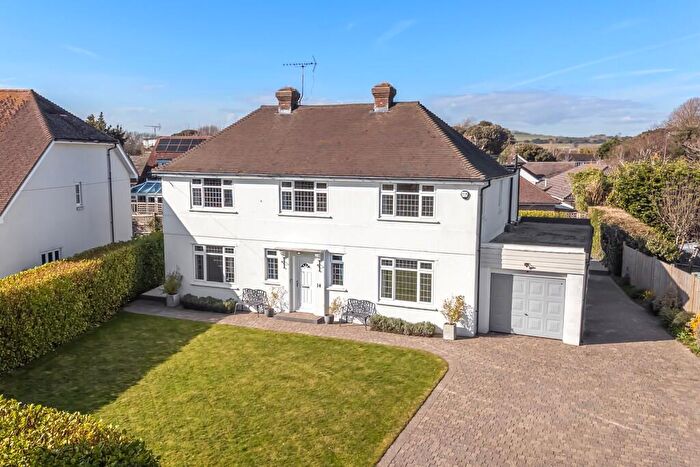
Houses for sale & to rent in Ferring, Worthing
House Prices in Ferring
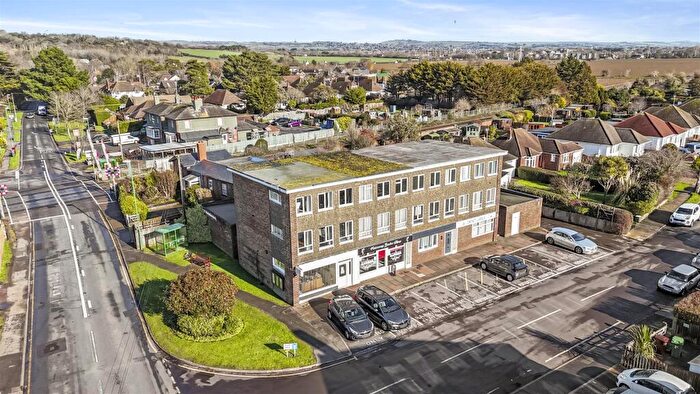
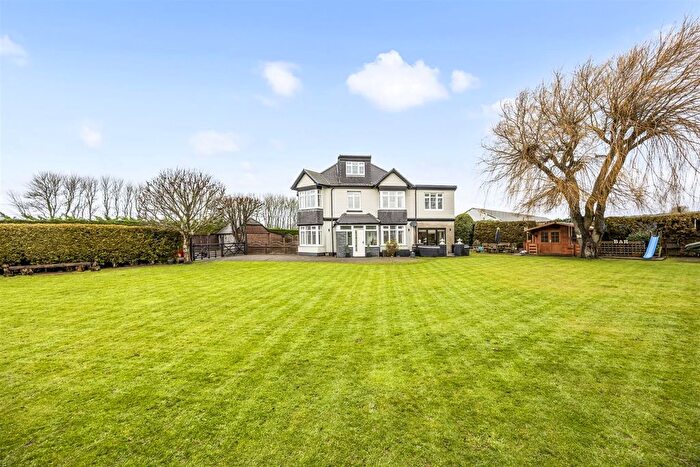
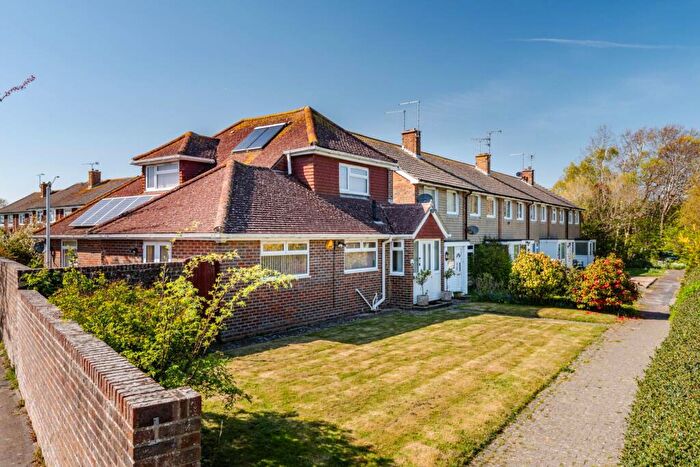
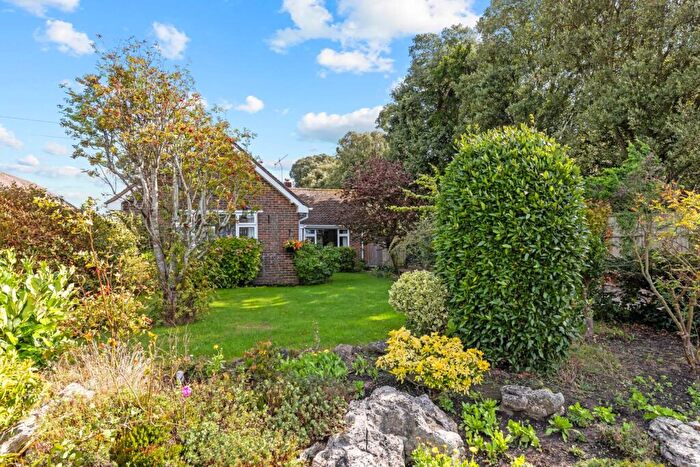
Properties in Ferring have an average house price of £559,111.00 and had 292 Property Transactions within the last 3 years¹.
Ferring is an area in Worthing, West Sussex with 2,226 households², where the most expensive property was sold for £1,690,421.00.
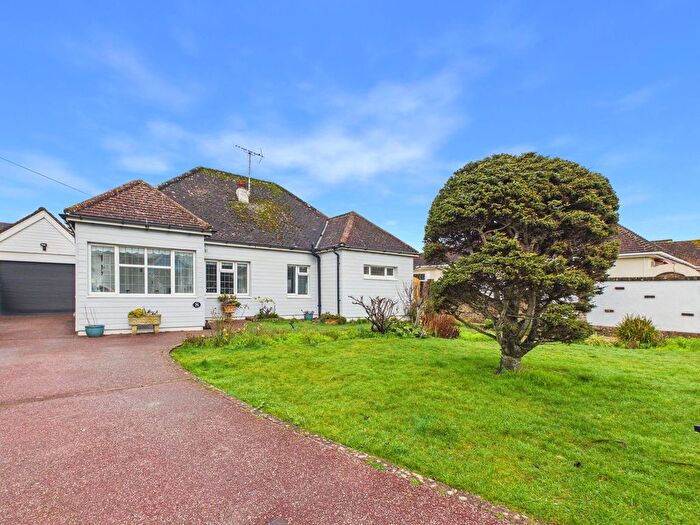
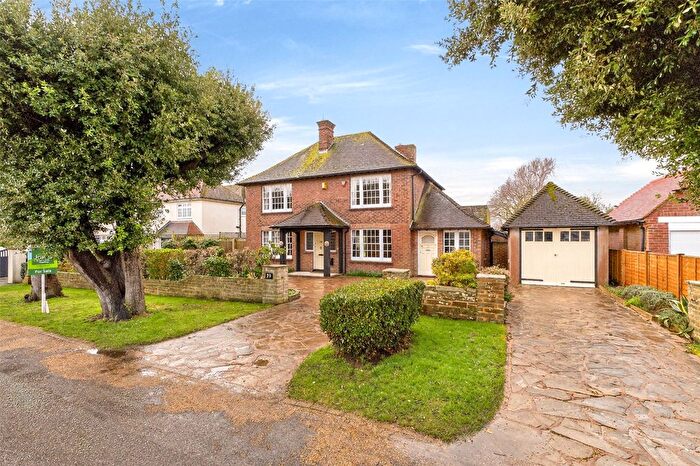
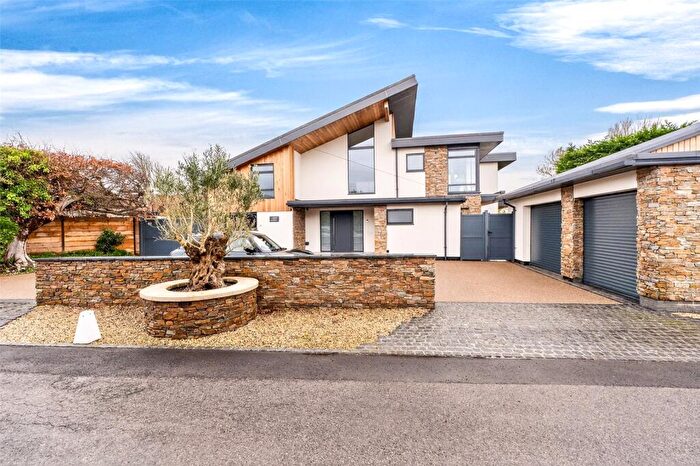
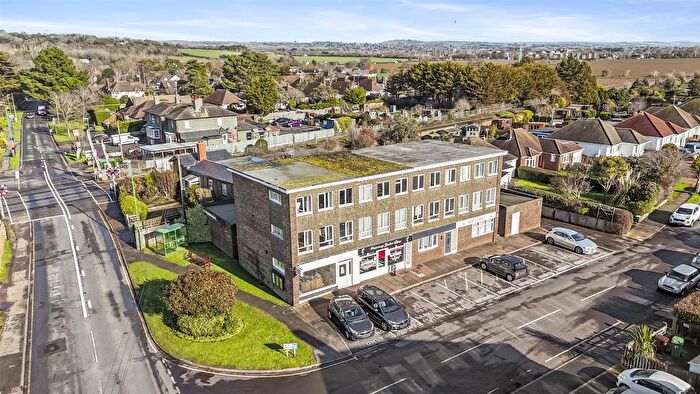
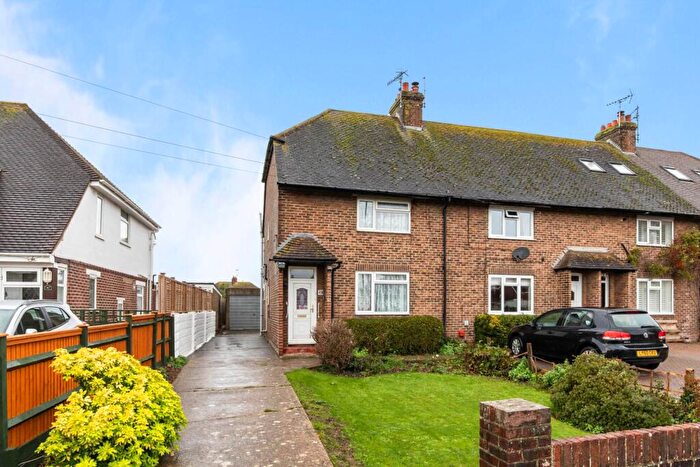
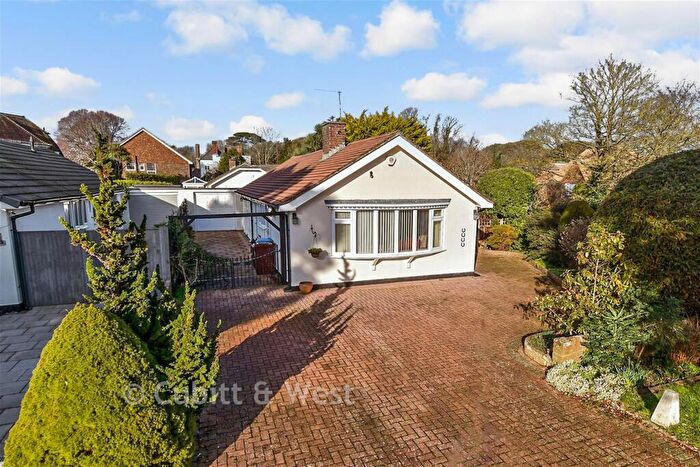
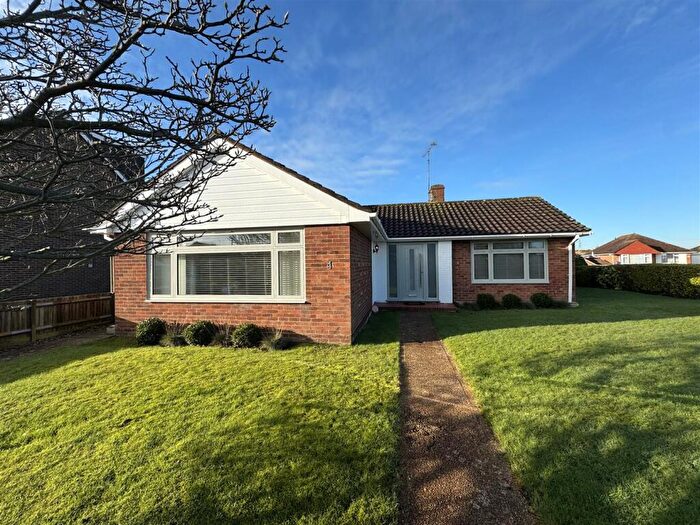
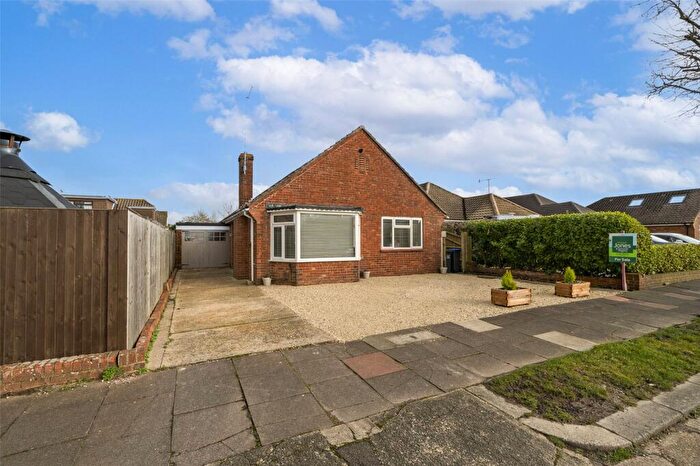
Properties for sale in Ferring
Roads and Postcodes in Ferring
Navigate through our locations to find the location of your next house in Ferring, Worthing for sale or to rent.
| Streets | Postcodes |
|---|---|
| Alderney Road | BN12 5PJ BN12 5PW |
| Ancren Close | BN12 6PD |
| Ansisters Road | BN12 5JG BN12 5JJ |
| April Close | BN12 5QW |
| Barbary Lane | BN12 5JB |
| Beehive Close | BN12 5NS |
| Beehive Lane | BN12 5NL BN12 5NN BN12 5NR |
| Bennett Gardens | BN12 6FL |
| Brook Lane | BN12 5HX BN12 5HZ BN12 5JD BN12 5JE BN12 5LP |
| Brookside Close | BN12 6QD |
| Cedar Close | BN12 5LH |
| Chalet Close | BN12 5NZ |
| Chalet Gardens | BN12 5PD |
| Chalet Road | BN12 5NY BN12 5PB |
| Church Lane | BN12 5HN BN12 5HR |
| Cissbury Road | BN12 6QJ BN12 6QL |
| Clover Lane | BN12 5LY BN12 5LZ |
| Colindale Road | BN12 5JF |
| Colindale Road North | BN12 5LB |
| Corner Garth | BN12 5EL |
| Doone End | BN12 5PT |
| Downview Avenue | BN12 6QN BN12 6QW |
| Downview Road | BN12 6QR |
| Draycliff Close | BN12 5RQ |
| East Mead | BN12 5EA |
| East Onslow Close | BN12 5RR |
| Elm Park | BN12 5RN BN12 5RW |
| Elverlands Close | BN12 5PL BN12 5QE BN12 5QF |
| Ferring Close | BN12 5QT |
| Ferring Grange Gardens | BN12 5HS BN12 5HU |
| Ferring Lane | BN12 6QS BN12 6QT BN12 6QU BN12 6QY |
| Ferring Marine | BN12 5PP |
| Ferring Street | BN12 5HJ BN12 5HL BN12 5HP BN12 5JN BN12 5JP BN12 5JS BN12 5JT BN12 5JW BN12 5JR |
| Ferringham Lane | BN12 5LJ BN12 5LL BN12 5LN BN12 5LT BN12 5LU BN12 5LW BN12 5LX BN12 5NB BN12 5ND BN12 5NF BN12 5NQ BN12 5NT BN12 5NU BN12 5NX |
| Ferringham Way | BN12 5NG |
| Florida Close | BN12 5PF |
| Florida Gardens | BN12 5PG |
| Florida Road | BN12 5PE BN12 5PH |
| Foamcourt Waye | BN12 5RD |
| Garden Park | BN12 5LG |
| Glen Gardens | BN12 5HG |
| Glenbarrie Way | BN12 6PY |
| Glynde Close | BN12 5BJ |
| Goring Way | BN12 5BY BN12 5BZ |
| Grange Close | BN12 5LR |
| Grange Court | BN12 5HT |
| Grange Park | BN12 5LS |
| Green Park | BN12 6QX |
| Greenways Crescent | BN12 5EF |
| Greystoke Road | BN12 5JL |
| Guernsey Road | BN12 5PN |
| Hangleton Grange | BN12 6QB |
| Hangleton Lane | BN12 6PP |
| Henty Road | BN12 5PA |
| Herm Road | BN12 5PS |
| Hermione Close | BN12 6PZ |
| Highdown Close | BN12 6PJ |
| Highdown Way | BN12 6QG BN12 6QQ |
| Homestead Mews | BN12 5DZ |
| Inglegreen Close | BN12 5QH |
| Jersey Road | BN12 5PU BN12 5PY BN12 5PZ |
| Kilham Way | BN12 6FJ |
| Laburnum Close | BN12 5EJ |
| Lamorna Gardens | BN12 5QD |
| Langbury Close | BN12 6QF |
| Langbury Lane | BN12 6PU BN12 6PX BN12 6QA BN12 6QE |
| Letchworth Close | BN12 5RE |
| Little Drive | BN12 5RF |
| Little Paddocks | BN12 5NH BN12 5NJ |
| Little Paddocks Way | BN12 5NP BN12 5NW |
| Littlehampton Road | BN12 6PB BN12 6PG BN12 6PH BN12 6PL |
| Malcolm Close | BN12 5NA |
| Meadow Way | BN12 5LD |
| Measham Close | BN12 5HH |
| Middle Onslow Close | BN12 5RT |
| Midhurst Close | BN12 5BP |
| Midhurst Drive | BN12 5BL BN12 5BQ |
| Milbury Close | BN12 5HQ |
| Mulberry Close | BN12 5HY |
| Oaklands | BN12 5GE |
| Ocean Close | BN12 5QR |
| Ocean Drive | BN12 5GJ BN12 5QJ BN12 5QN BN12 5QP |
| Ocean Parade | BN12 5QG BN12 5QQ |
| Onslow Drive | BN12 5RP BN12 5RS BN12 5RX |
| Orchard Close | BN12 6QP |
| Oval Waye | BN12 5RA |
| Park Drive | BN12 5DX |
| Pebble Lane | BN12 5FB |
| Polperro Close | BN12 5JH |
| Rife Way | BN12 5JU BN12 5JX BN12 5JY BN12 5JZ |
| Rifeside Gardens | BN12 6QH |
| Sark Gardens | BN12 5QB |
| Sea Drive | BN12 5HD BN12 5SS |
| Sea Lane | BN12 5DP BN12 5DS BN12 5DU BN12 5DY BN12 5EB BN12 5ED BN12 5EH BN12 5EP BN12 5EU BN12 5HB BN12 5HE BN12 5DR BN12 5ES BN12 5ET BN12 5FD |
| Sea Lane Close | BN12 5DT |
| Sea Lane Gardens | BN12 5EE BN12 5EG BN12 5EN BN12 5EQ BN12 5EW |
| Singleton Close | BN12 5DF |
| Singleton Crescent | BN12 5DA BN12 5DE BN12 5DG |
| Somerset Road | BN12 5QA |
| South Drive | BN12 5QS BN12 5QU |
| St Andrews Close | BN12 5LF |
| St Aubins Road | BN12 5HA |
| St Helier Road | BN12 5EX BN12 5EY BN12 5EZ |
| St Malo Close | BN12 5HF |
| St Marys Gardens | BN12 6GD |
| St Maurs Road | BN12 5LE |
| St Osmund Road | BN12 5LA |
| Tamarisk Way | BN12 5ER |
| Telgarth Road | BN12 5PX |
| The Grove | BN12 5JA |
| The Maples | BN12 5PR |
| The Paddocks | BN12 5FA |
| The Pantiles | BN12 5NE |
| The Poplars | BN12 5QL |
| The Strand | BN12 5QX |
| The Warren | BN12 5PQ |
| Titnore Lane | BN13 3UG |
| Upper West Drive | BN12 5RB BN12 5RG BN12 5RH |
| West Drive | BN12 5QY BN12 5QZ |
| West Onslow Close | BN12 5RU |
| Westergate Close | BN12 5DB |
| Westlands | BN12 5JQ |
| Winton Close | BN12 6FD |
Transport near Ferring
- FAQ
- Price Paid By Year
- Property Type Price
Frequently asked questions about Ferring
What is the average price for a property for sale in Ferring?
The average price for a property for sale in Ferring is £559,111. This amount is 46% higher than the average price in Worthing. There are 980 property listings for sale in Ferring.
What streets have the most expensive properties for sale in Ferring?
The streets with the most expensive properties for sale in Ferring are Lamorna Gardens at an average of £1,378,333, Greenways Crescent at an average of £1,350,000 and Florida Close at an average of £905,000.
What streets have the most affordable properties for sale in Ferring?
The streets with the most affordable properties for sale in Ferring are Ocean Parade at an average of £189,400, Westlands at an average of £302,000 and St Helier Road at an average of £310,000.
Which train stations are available in or near Ferring?
Some of the train stations available in or near Ferring are Goring-By-Sea, Durrington-On-Sea and Angmering.
Property Price Paid in Ferring by Year
The average sold property price by year was:
| Year | Average Sold Price | Price Change |
Sold Properties
|
|---|---|---|---|
| 2025 | £566,675 | 1% |
83 Properties |
| 2024 | £562,904 | 2% |
106 Properties |
| 2023 | £549,112 | -2% |
103 Properties |
| 2022 | £558,205 | -1% |
98 Properties |
| 2021 | £564,641 | 10% |
140 Properties |
| 2020 | £506,885 | 10% |
119 Properties |
| 2019 | £455,239 | 7% |
111 Properties |
| 2018 | £424,666 | 3% |
103 Properties |
| 2017 | £409,965 | 0,3% |
161 Properties |
| 2016 | £408,759 | 6% |
136 Properties |
| 2015 | £384,551 | 7% |
132 Properties |
| 2014 | £356,998 | 14% |
138 Properties |
| 2013 | £307,909 | -4% |
130 Properties |
| 2012 | £320,166 | 9% |
103 Properties |
| 2011 | £289,773 | -8% |
81 Properties |
| 2010 | £313,666 | 11% |
113 Properties |
| 2009 | £278,774 | -2% |
124 Properties |
| 2008 | £284,531 | -17% |
66 Properties |
| 2007 | £332,333 | 16% |
161 Properties |
| 2006 | £277,587 | 2% |
162 Properties |
| 2005 | £272,192 | 3% |
85 Properties |
| 2004 | £264,260 | 14% |
126 Properties |
| 2003 | £228,177 | 9% |
141 Properties |
| 2002 | £208,295 | 14% |
170 Properties |
| 2001 | £179,129 | 13% |
130 Properties |
| 2000 | £156,571 | 17% |
121 Properties |
| 1999 | £130,277 | 11% |
157 Properties |
| 1998 | £115,573 | 9% |
136 Properties |
| 1997 | £105,387 | 18% |
158 Properties |
| 1996 | £86,914 | -2% |
152 Properties |
| 1995 | £88,673 | - |
134 Properties |
Property Price per Property Type in Ferring
Here you can find historic sold price data in order to help with your property search.
The average Property Paid Price for specific property types in the last three years are:
| Property Type | Average Sold Price | Sold Properties |
|---|---|---|
| Flat | £288,166.00 | 30 Flats |
| Semi Detached House | £425,051.00 | 66 Semi Detached Houses |
| Detached House | £654,488.00 | 186 Detached Houses |
| Terraced House | £482,732.00 | 10 Terraced Houses |

