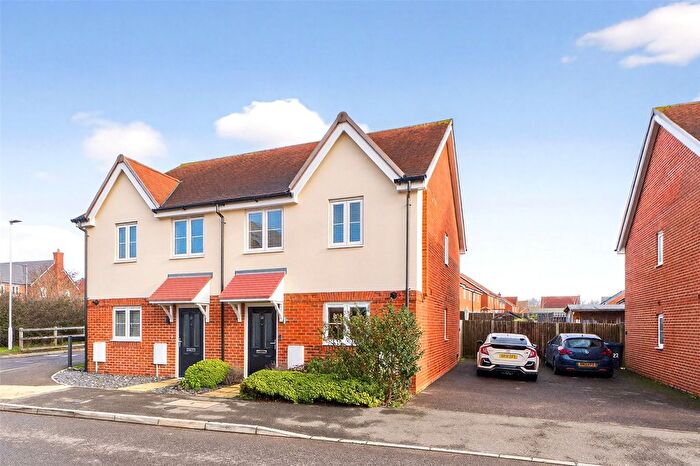
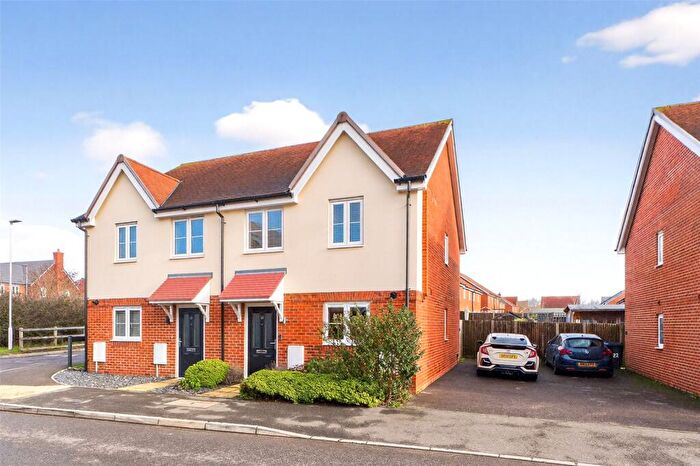
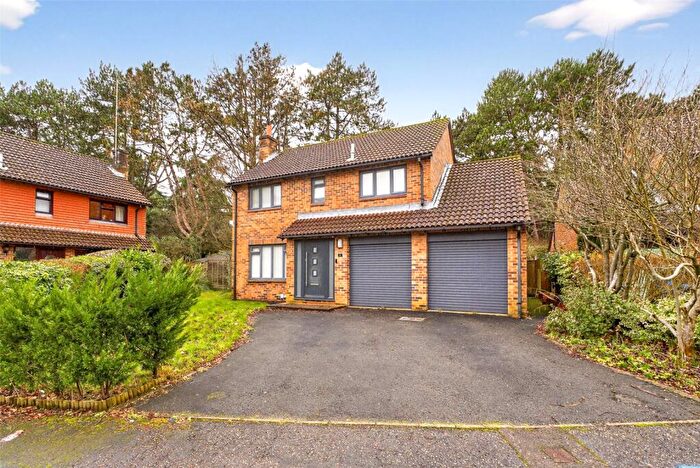
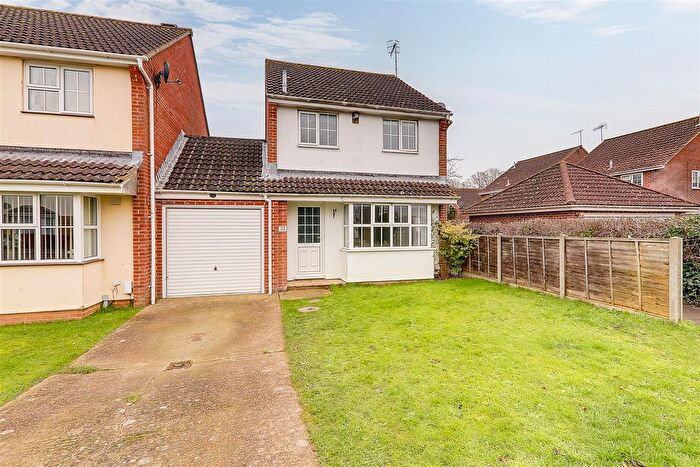
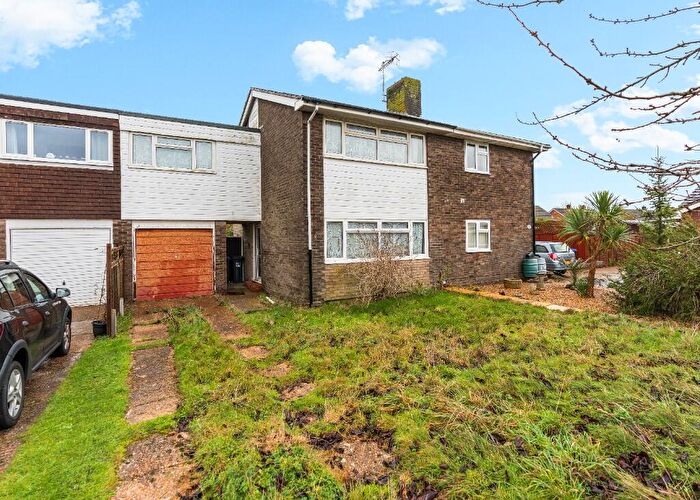
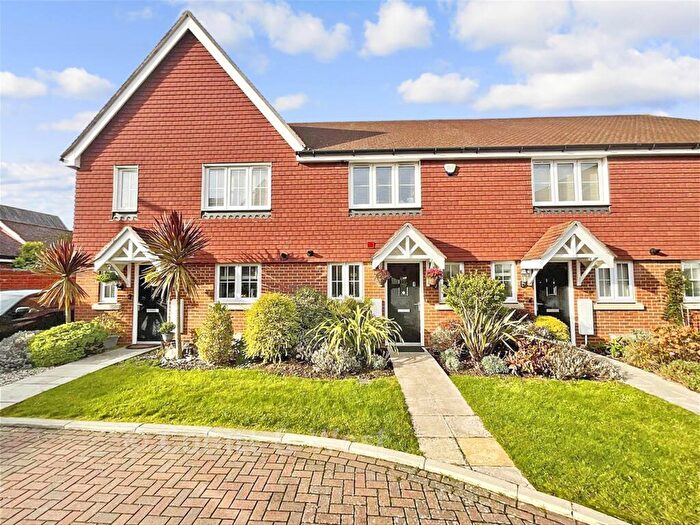
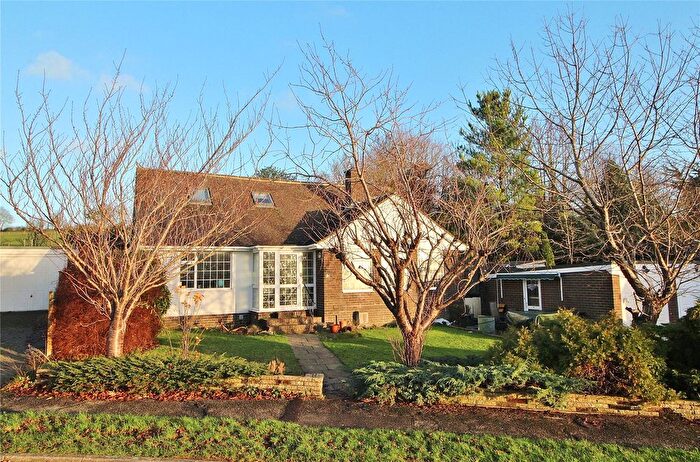
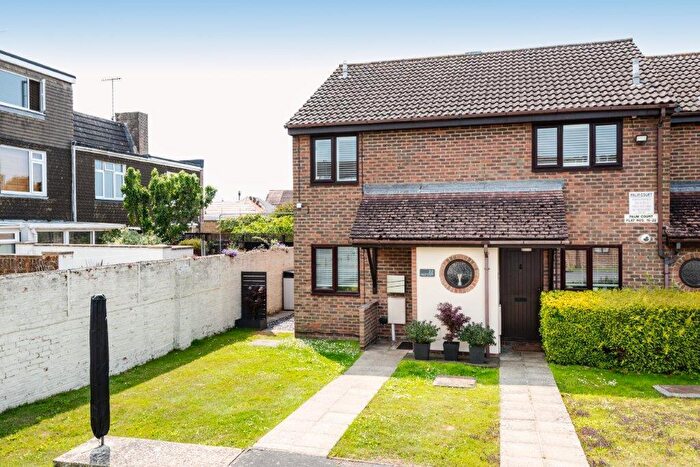
Houses for sale & to rent in Findon, Worthing
House Prices in Findon
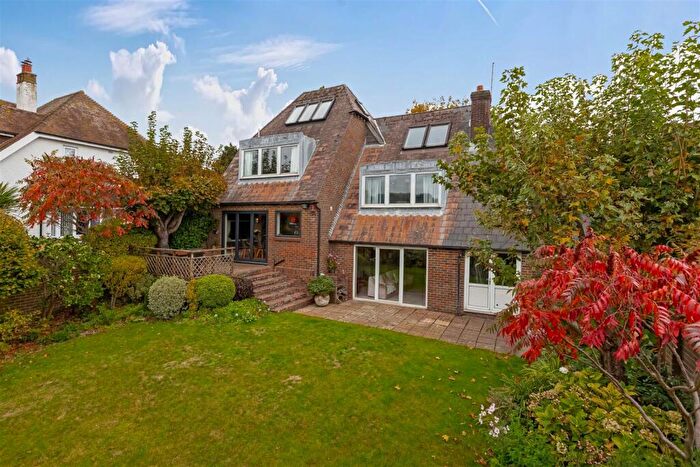
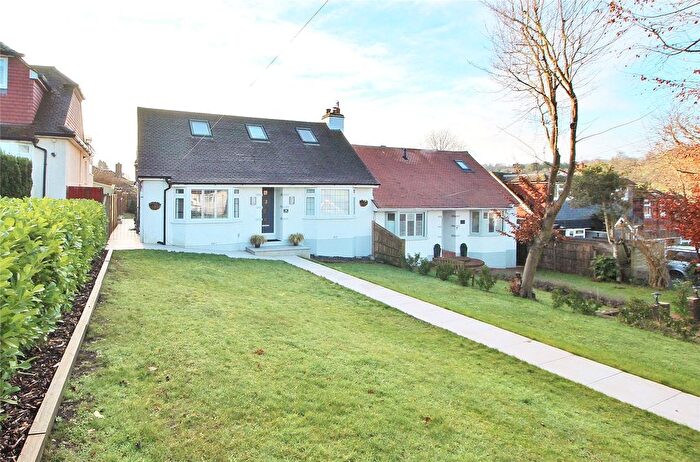
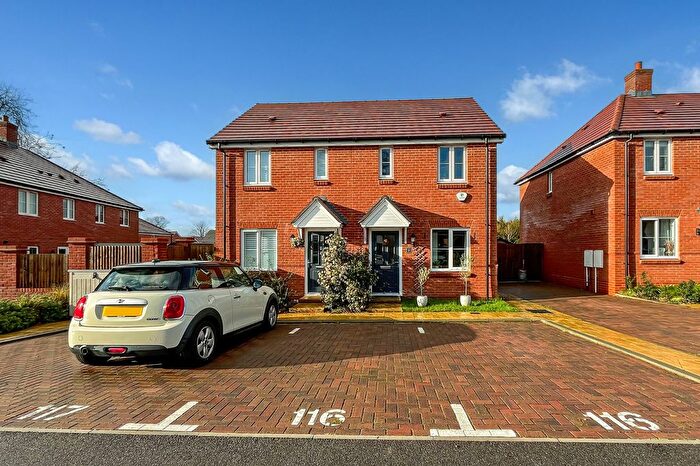
Properties in Findon have an average house price of £578,614.00 and had 132 Property Transactions within the last 3 years¹.
Findon is an area in Worthing, West Sussex with 1,076 households², where the most expensive property was sold for £1,680,000.00.
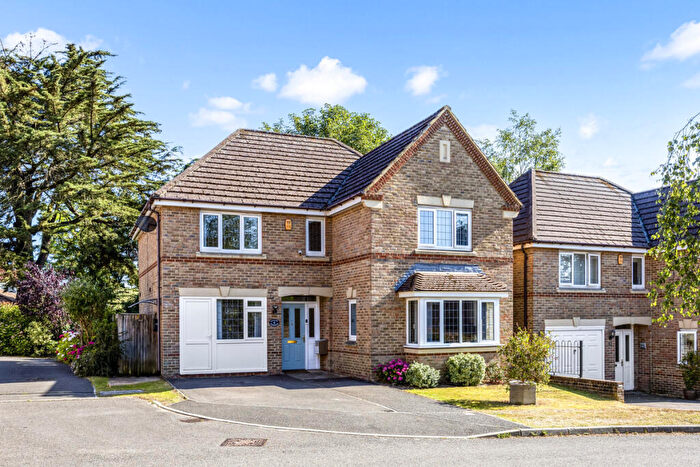
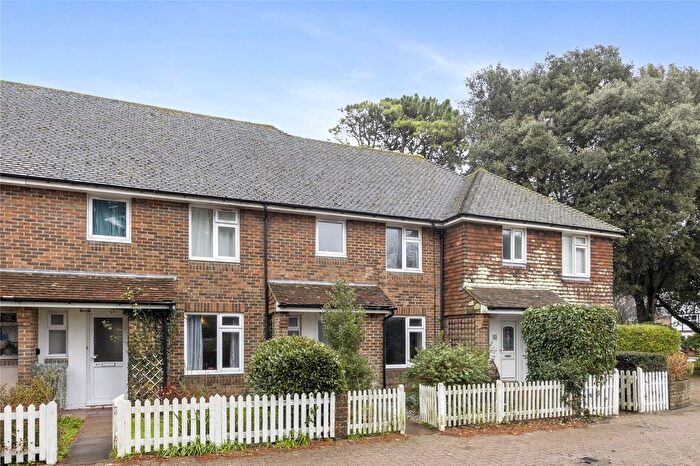
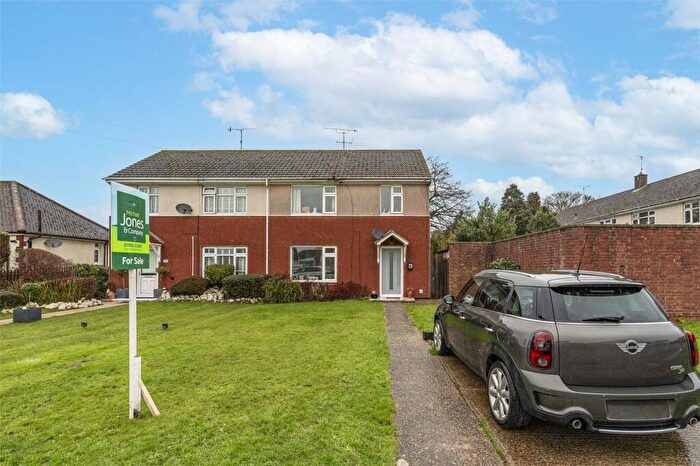
Properties for sale in Findon
Roads and Postcodes in Findon
Navigate through our locations to find the location of your next house in Findon, Worthing for sale or to rent.
| Streets | Postcodes |
|---|---|
| Arundel Road | BN13 3UH |
| Ash Close | BN14 0UW |
| Beech Close | BN14 0UT |
| Beech Road | BN14 0UN BN14 0UR |
| Braeside Close | BN14 0GF |
| Castle Goring Mews | BN13 3UB |
| Cedar Chase | BN14 0US |
| Church Close | BN13 3XP |
| Church Farm Close | BN13 3FA |
| Clapham Close | BN13 3XA |
| Clapham Common | BN13 3UR |
| Coldharbour Lane | BN13 3XE |
| Convent Gardens | BN14 0RZ |
| Cross Lane | BN14 0UB BN14 0UG BN14 0UQ |
| Downland Close | BN14 0UJ |
| Downview Road | BN14 0UU BN14 0UX |
| Elm Rise | BN14 0UP |
| Findon By Pass | BN14 0TP |
| Findon Road | BN14 0RA BN14 0RD BN14 0TL |
| Fox Lea | BN14 0XB |
| France Lane | BN13 3UP |
| Hermit Terrace | BN14 0TB |
| High Barn | BN14 0TJ |
| High Street | BN14 0QZ BN14 0ST BN14 0SU BN14 0SX BN14 0SY BN14 0SZ BN14 0TA |
| Holmcroft Gardens | BN14 0UD |
| Homewood | BN14 0XA |
| Horseshoe Close | BN14 0EW |
| Horsham Road | BN14 0RG BN14 0TF BN14 0TQ BN14 0UY |
| Ivy Arch Close | BN14 0RX |
| Kilmore Close | BN14 0RU |
| Lime Road | BN14 0UL |
| Long Furlong | BN13 3UT BN13 3XD BN13 3XN BN14 0RJ |
| Michelgrove | BN13 3XG |
| Myrtle Grove | BN13 3XL |
| Nepcote | BN14 0SD BN14 0SN |
| Nepcote Lane | BN14 0SE BN14 0SF BN14 0SG BN14 0SL BN14 0SQ |
| Nepfield Close | BN14 0SS |
| Northend | BN14 0RQ |
| Northend Cottages | BN14 0RH |
| Northview Terrace | BN14 0TZ |
| Paddock Way | BN14 0TX |
| Pony Farm | BN14 0RS |
| Rogers Lane | BN14 0RE |
| School Hill | BN14 0TR |
| Selden Lane | BN13 3UL |
| Soldiers Field Lane | BN14 0SH |
| Southview Road | BN14 0UA |
| Stable Lane | BN14 0RR |
| Steep Close | BN14 0TD |
| Steep Lane | BN14 0UE BN14 0UF |
| Summerfields | BN14 0TU |
| Sycamore Court | BN14 0WA |
| The Chase | BN14 0TT |
| The Limes | BN14 0UZ |
| The Oval | BN14 0TN |
| The Quadrangle | BN14 0RB |
| The Square | BN14 0TE |
| The Street | BN13 3UU BN13 3UY BN13 3UZ BN13 3XB BN13 3XF |
| The Willows | BN14 0TH |
| Tudor Close | BN14 0UH |
| Westview Terrace | BN14 0TY |
| Woodland Close | BN13 3XR |
Transport near Findon
-
Durrington-On-Sea Station
-
Goring-By-Sea Station
-
West Worthing Station
-
Worthing Station
-
East Worthing Station
-
Angmering Station
-
Lancing Station
- FAQ
- Price Paid By Year
- Property Type Price
Frequently asked questions about Findon
What is the average price for a property for sale in Findon?
The average price for a property for sale in Findon is £578,614. This amount is 51% higher than the average price in Worthing. There are 3,721 property listings for sale in Findon.
What streets have the most expensive properties for sale in Findon?
The streets with the most expensive properties for sale in Findon are Soldiers Field Lane at an average of £1,274,000, Convent Gardens at an average of £982,800 and Fox Lea at an average of £925,666.
What streets have the most affordable properties for sale in Findon?
The streets with the most affordable properties for sale in Findon are Horseshoe Close at an average of £250,000, The Square at an average of £271,250 and High Barn at an average of £311,250.
Which train stations are available in or near Findon?
Some of the train stations available in or near Findon are Durrington-On-Sea, Goring-By-Sea and West Worthing.
Property Price Paid in Findon by Year
The average sold property price by year was:
| Year | Average Sold Price | Price Change |
Sold Properties
|
|---|---|---|---|
| 2025 | £615,648 | 9% |
21 Properties |
| 2024 | £559,939 | 8% |
43 Properties |
| 2023 | £515,372 | -22% |
29 Properties |
| 2022 | £626,288 | 16% |
39 Properties |
| 2021 | £524,526 | - |
57 Properties |
| 2020 | £524,729 | 15% |
37 Properties |
| 2019 | £445,999 | -0,1% |
46 Properties |
| 2018 | £446,548 | 2% |
49 Properties |
| 2017 | £437,318 | -2% |
55 Properties |
| 2016 | £445,722 | 5% |
49 Properties |
| 2015 | £425,427 | 19% |
43 Properties |
| 2014 | £346,573 | -6% |
47 Properties |
| 2013 | £368,670 | 8% |
35 Properties |
| 2012 | £337,541 | 3% |
38 Properties |
| 2011 | £327,222 | -17% |
52 Properties |
| 2010 | £381,236 | 22% |
42 Properties |
| 2009 | £299,262 | 6% |
40 Properties |
| 2008 | £281,720 | -31% |
39 Properties |
| 2007 | £369,680 | 18% |
58 Properties |
| 2006 | £304,575 | -2% |
70 Properties |
| 2005 | £310,849 | 2% |
47 Properties |
| 2004 | £303,314 | 10% |
74 Properties |
| 2003 | £274,091 | 1% |
67 Properties |
| 2002 | £272,490 | 22% |
67 Properties |
| 2001 | £213,182 | -7% |
64 Properties |
| 2000 | £227,283 | 31% |
70 Properties |
| 1999 | £157,511 | 15% |
59 Properties |
| 1998 | £133,268 | 19% |
54 Properties |
| 1997 | £108,298 | 17% |
74 Properties |
| 1996 | £90,085 | -12% |
54 Properties |
| 1995 | £101,148 | - |
53 Properties |
Property Price per Property Type in Findon
Here you can find historic sold price data in order to help with your property search.
The average Property Paid Price for specific property types in the last three years are:
| Property Type | Average Sold Price | Sold Properties |
|---|---|---|
| Semi Detached House | £465,417.00 | 33 Semi Detached Houses |
| Detached House | £743,383.00 | 66 Detached Houses |
| Terraced House | £385,632.00 | 26 Terraced Houses |
| Flat | £275,500.00 | 7 Flats |

