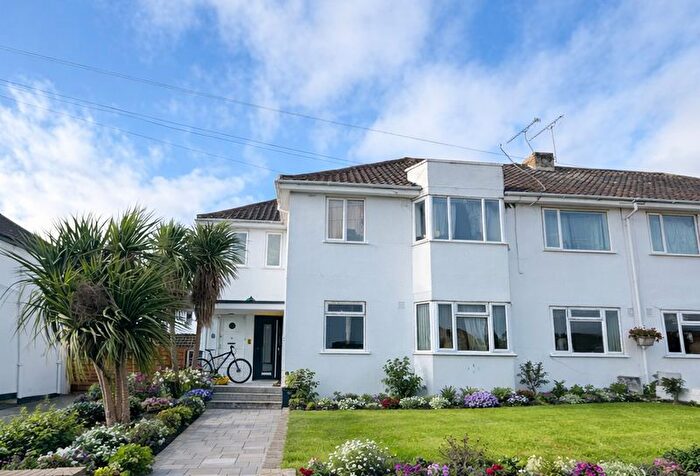
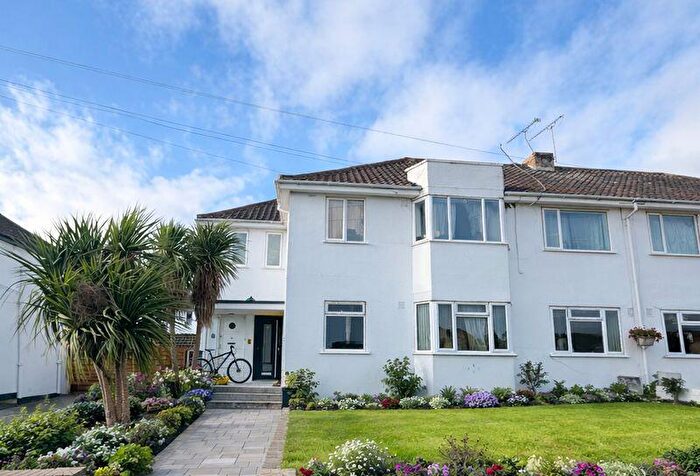
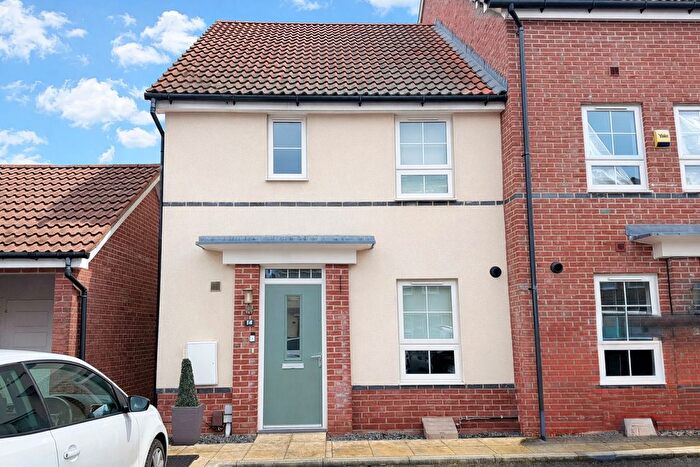
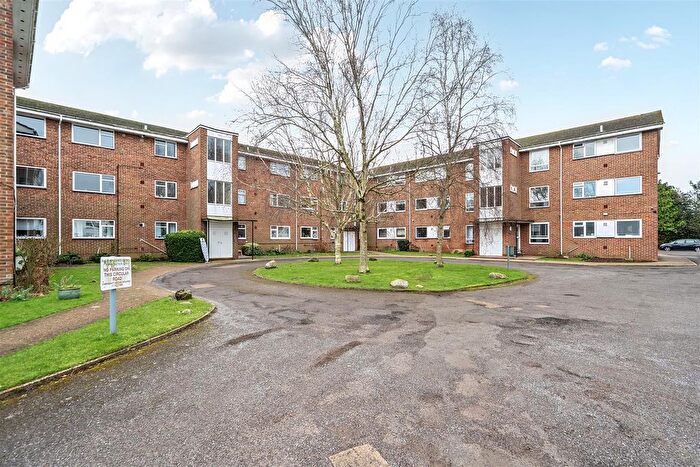
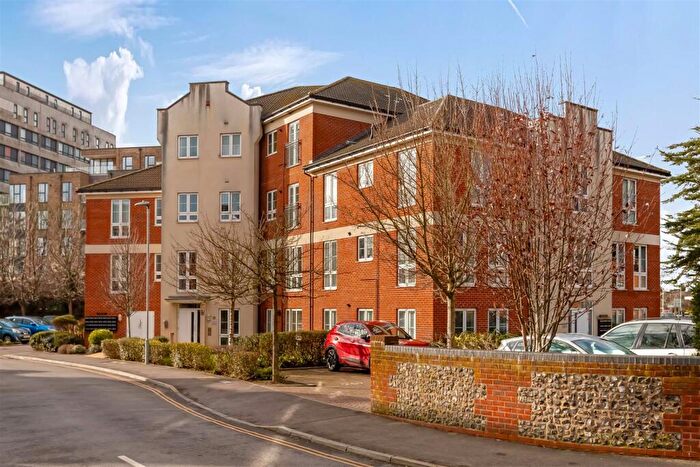
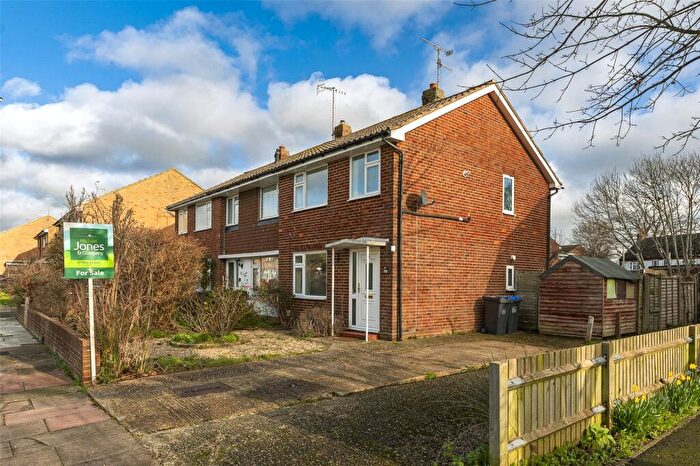
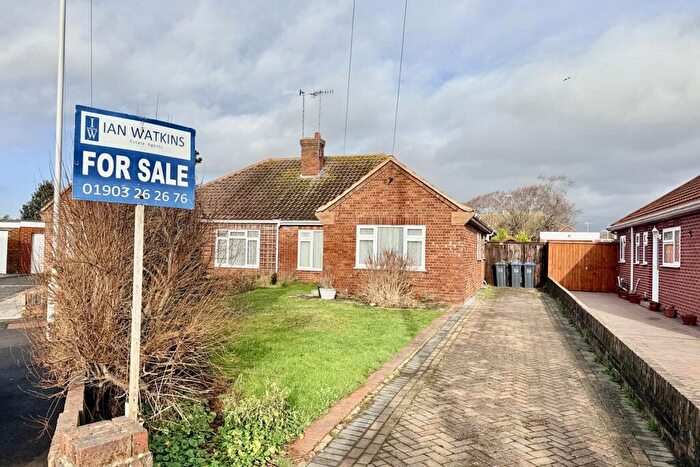
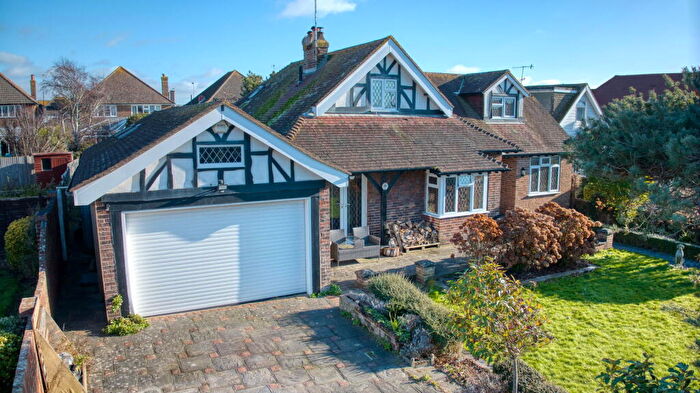
Houses for sale & to rent in Marine, Worthing
House Prices in Marine
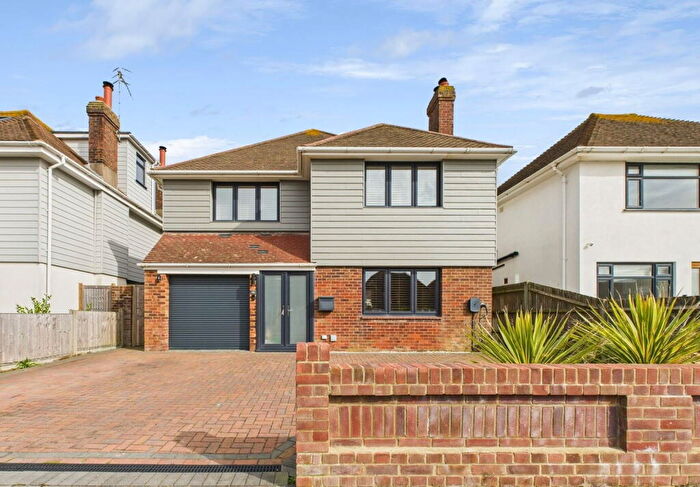
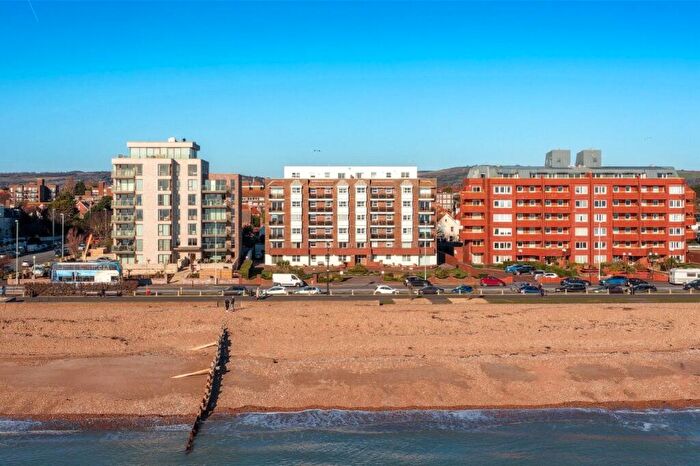
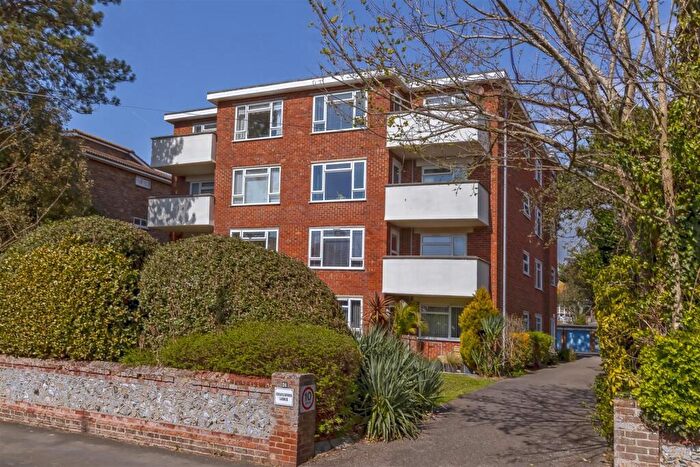
Properties in Marine have an average house price of £384,044.00 and had 418 Property Transactions within the last 3 years¹.
Marine is an area in Worthing, West Sussex with 3,810 households², where the most expensive property was sold for £1,180,000.00.
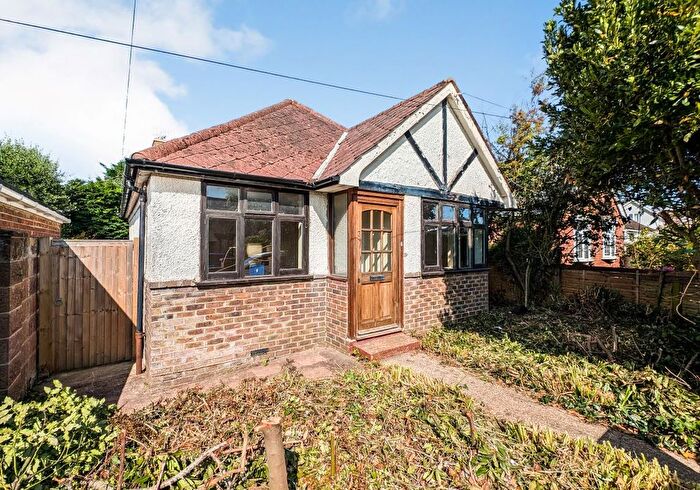
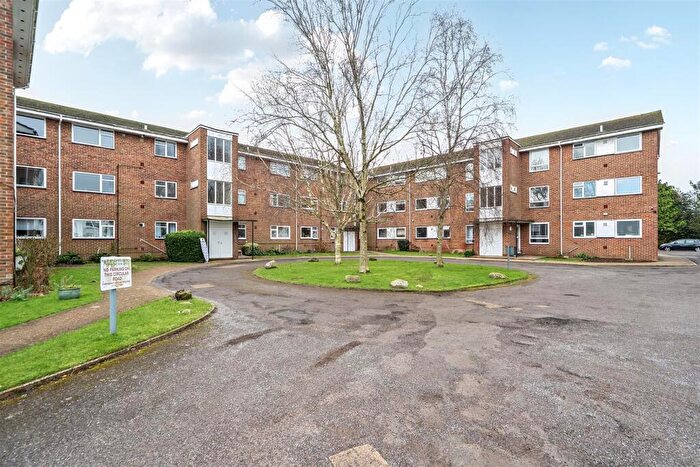
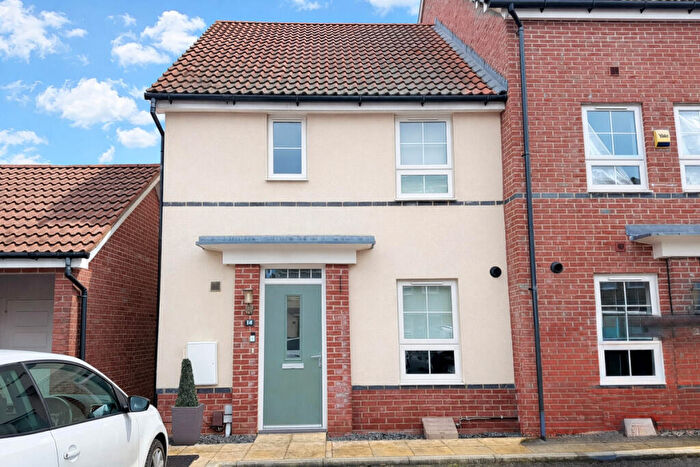
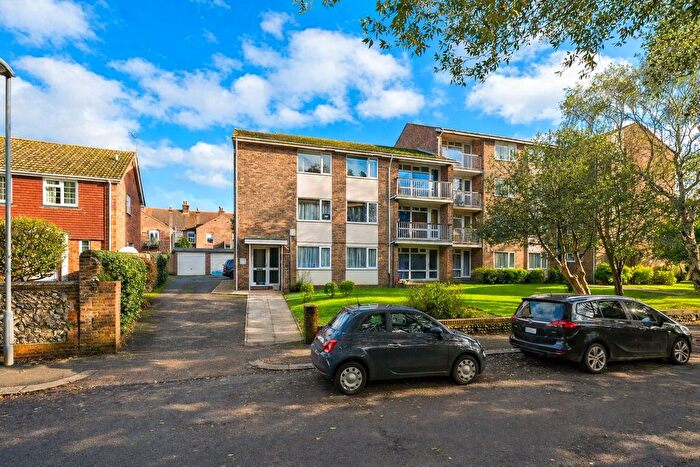
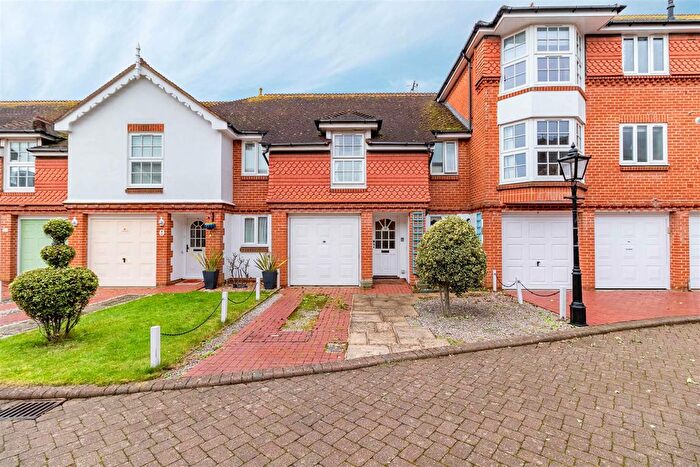
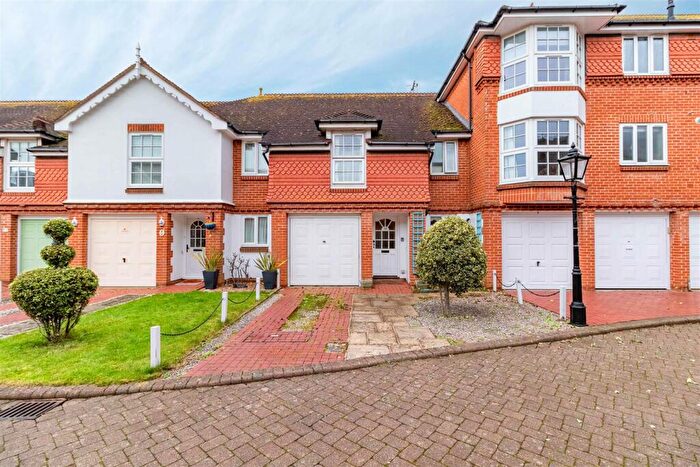
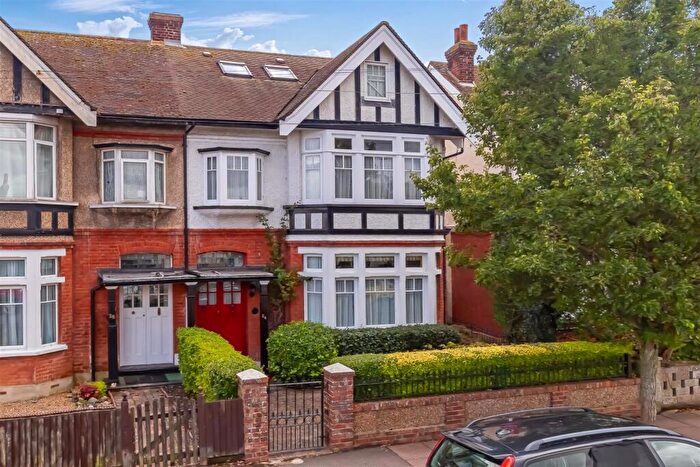
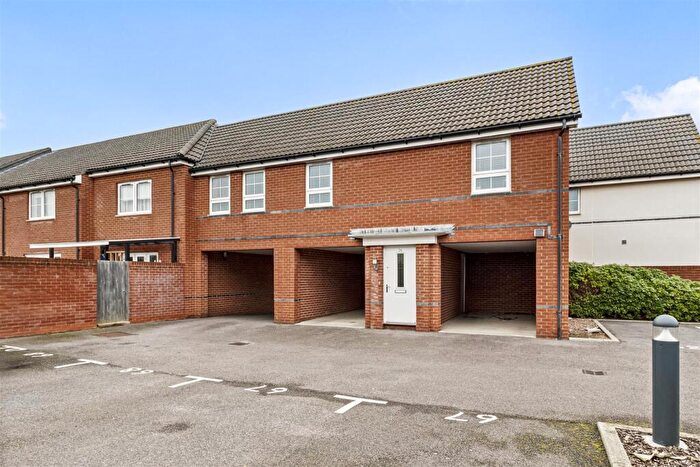
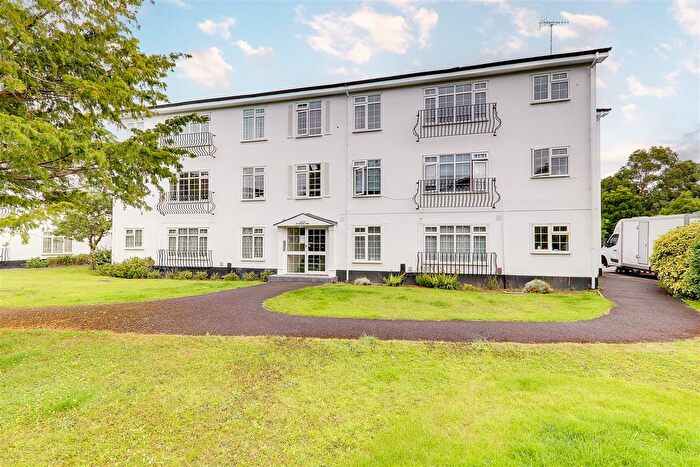
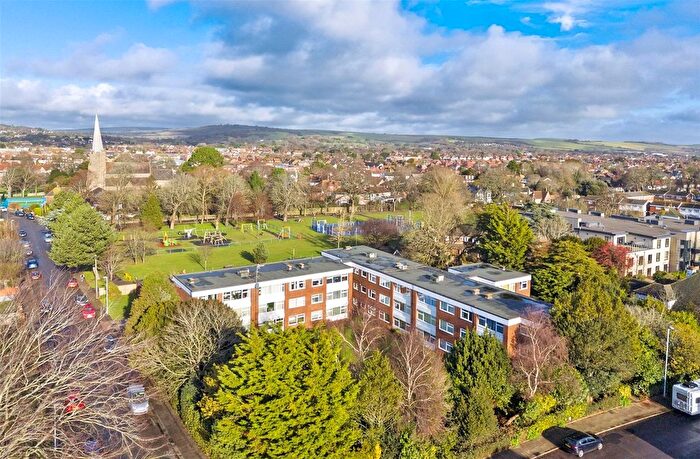
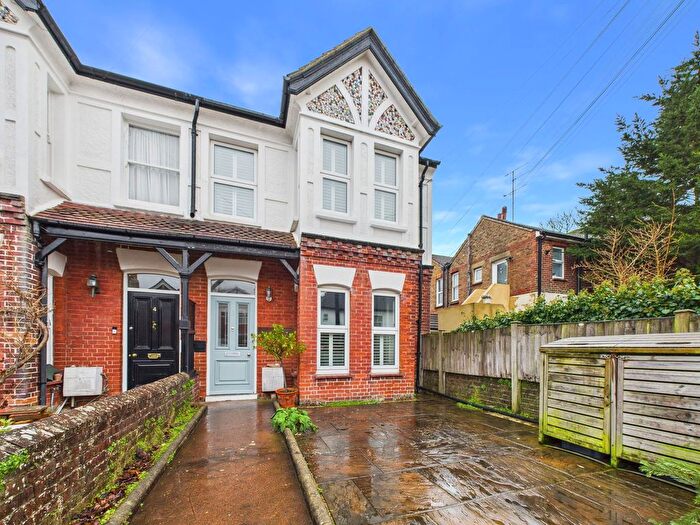
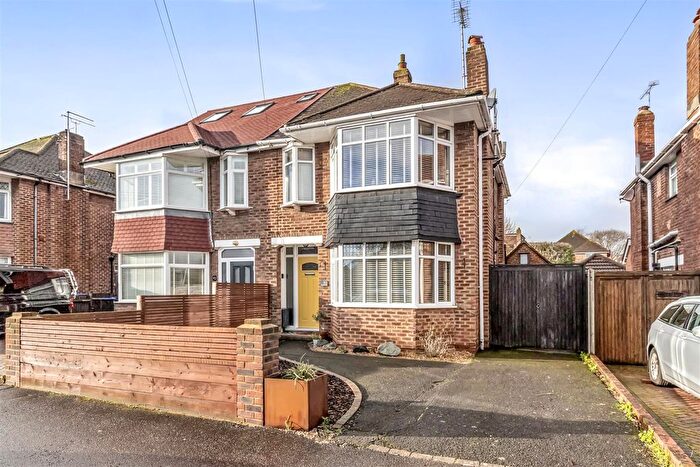
Properties for sale in Marine
Roads and Postcodes in Marine
Navigate through our locations to find the location of your next house in Marine, Worthing for sale or to rent.
Transport near Marine
-
West Worthing Station
-
Durrington-On-Sea Station
-
Worthing Station
-
Goring-By-Sea Station
-
East Worthing Station
- FAQ
- Price Paid By Year
- Property Type Price
Frequently asked questions about Marine
What is the average price for a property for sale in Marine?
The average price for a property for sale in Marine is £384,044. This amount is 0.42% higher than the average price in Worthing. There are 2,614 property listings for sale in Marine.
What streets have the most expensive properties for sale in Marine?
The streets with the most expensive properties for sale in Marine are Dover Road at an average of £806,666, Courtlands Way at an average of £785,000 and West Park Lane at an average of £713,750.
What streets have the most affordable properties for sale in Marine?
The streets with the most affordable properties for sale in Marine are Pevensey Garden at an average of £222,500, Rochester Court at an average of £223,333 and Downview Road at an average of £223,416.
Which train stations are available in or near Marine?
Some of the train stations available in or near Marine are West Worthing, Durrington-On-Sea and Worthing.
Property Price Paid in Marine by Year
The average sold property price by year was:
| Year | Average Sold Price | Price Change |
Sold Properties
|
|---|---|---|---|
| 2025 | £352,688 | -15% |
105 Properties |
| 2024 | £406,938 | 6% |
166 Properties |
| 2023 | £380,588 | 2% |
147 Properties |
| 2022 | £371,577 | 3% |
194 Properties |
| 2021 | £360,871 | 5% |
256 Properties |
| 2020 | £344,333 | 9% |
160 Properties |
| 2019 | £313,732 | -1% |
212 Properties |
| 2018 | £315,889 | 5% |
208 Properties |
| 2017 | £299,762 | -0,2% |
198 Properties |
| 2016 | £300,501 | 3% |
240 Properties |
| 2015 | £291,133 | 13% |
276 Properties |
| 2014 | £251,907 | 3% |
282 Properties |
| 2013 | £244,074 | 12% |
185 Properties |
| 2012 | £214,133 | -0,3% |
169 Properties |
| 2011 | £214,750 | -18% |
183 Properties |
| 2010 | £254,043 | 18% |
177 Properties |
| 2009 | £209,300 | -14% |
170 Properties |
| 2008 | £238,071 | 5% |
132 Properties |
| 2007 | £225,741 | 6% |
247 Properties |
| 2006 | £211,803 | 11% |
309 Properties |
| 2005 | £187,999 | -9% |
233 Properties |
| 2004 | £205,780 | 20% |
244 Properties |
| 2003 | £163,663 | 11% |
230 Properties |
| 2002 | £145,497 | 13% |
313 Properties |
| 2001 | £126,756 | 7% |
316 Properties |
| 2000 | £117,360 | 22% |
295 Properties |
| 1999 | £91,204 | 13% |
341 Properties |
| 1998 | £79,203 | 7% |
281 Properties |
| 1997 | £73,497 | 11% |
320 Properties |
| 1996 | £65,189 | -2% |
241 Properties |
| 1995 | £66,437 | - |
210 Properties |
Property Price per Property Type in Marine
Here you can find historic sold price data in order to help with your property search.
The average Property Paid Price for specific property types in the last three years are:
| Property Type | Average Sold Price | Sold Properties |
|---|---|---|
| Flat | £262,771.00 | 230 Flats |
| Semi Detached House | £525,106.00 | 61 Semi Detached Houses |
| Detached House | £670,584.00 | 65 Detached Houses |
| Terraced House | £394,735.00 | 62 Terraced Houses |

