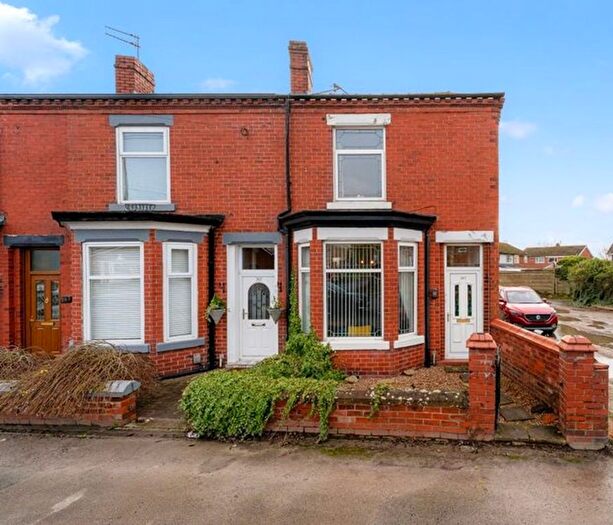
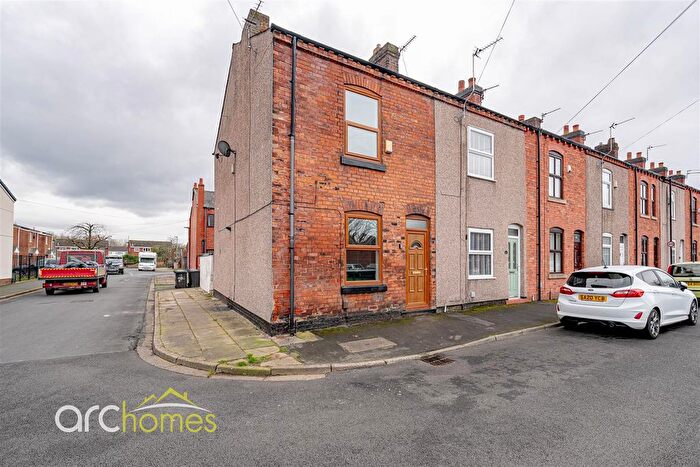
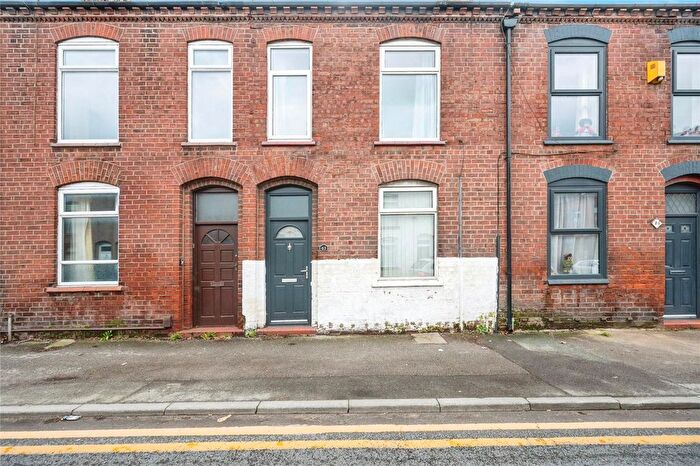
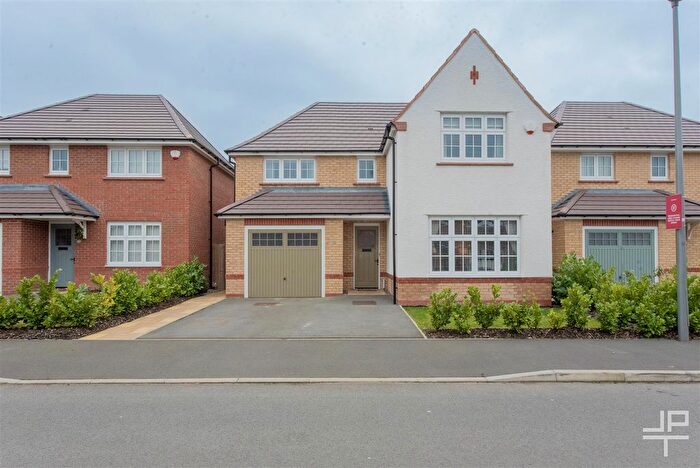
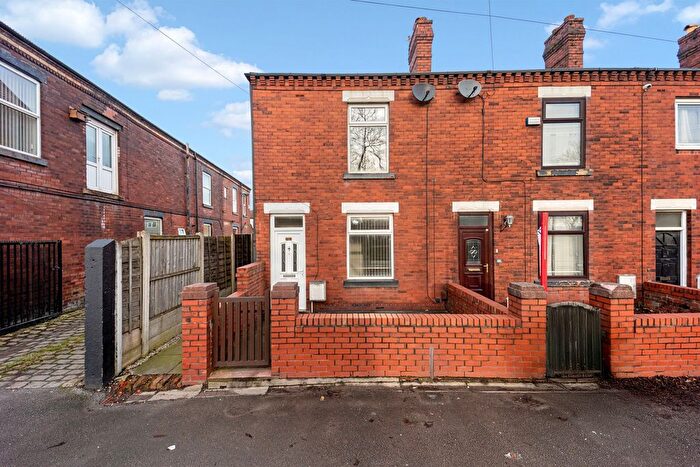
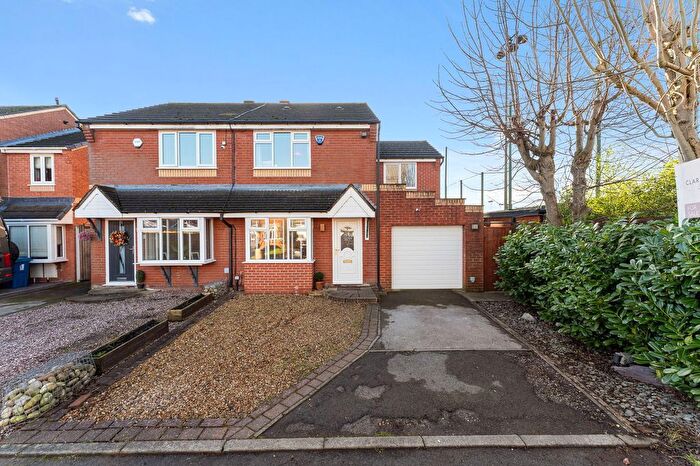
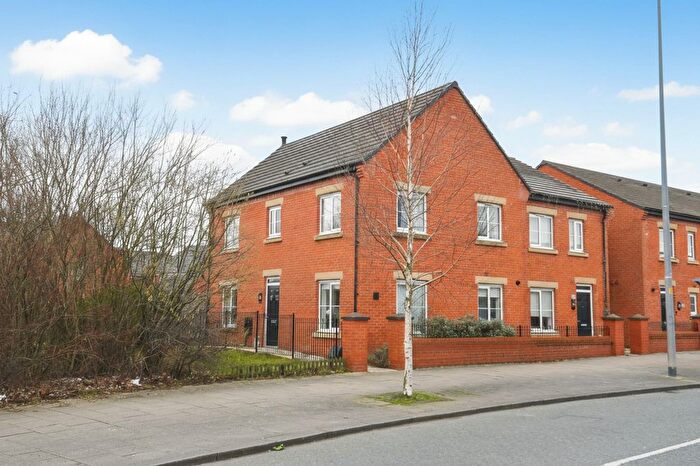
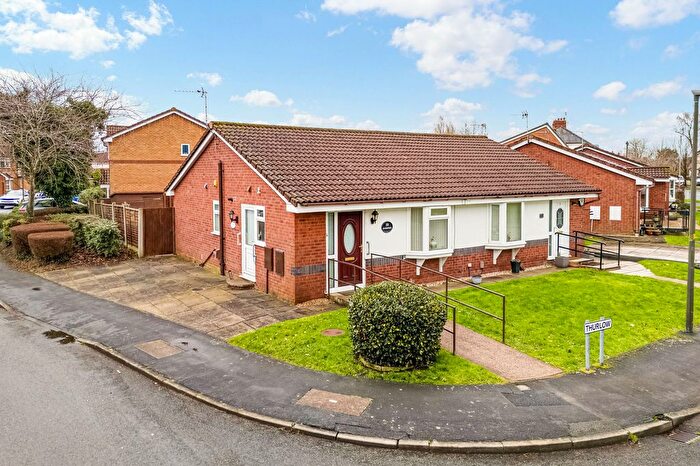
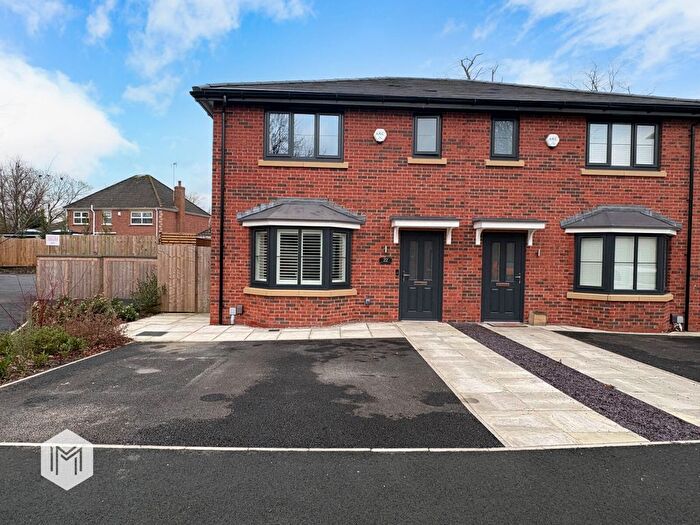
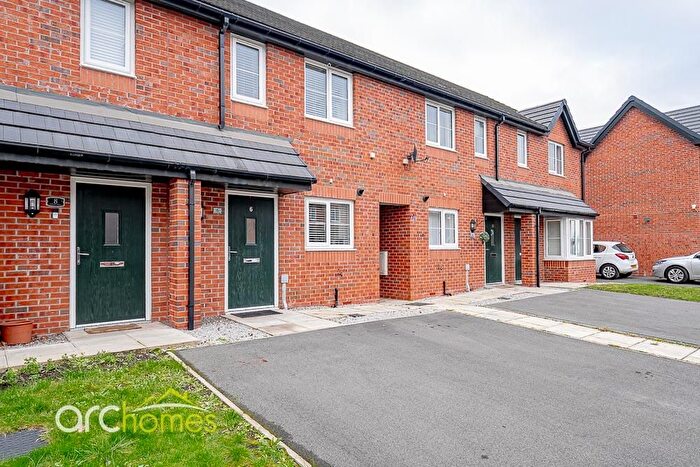
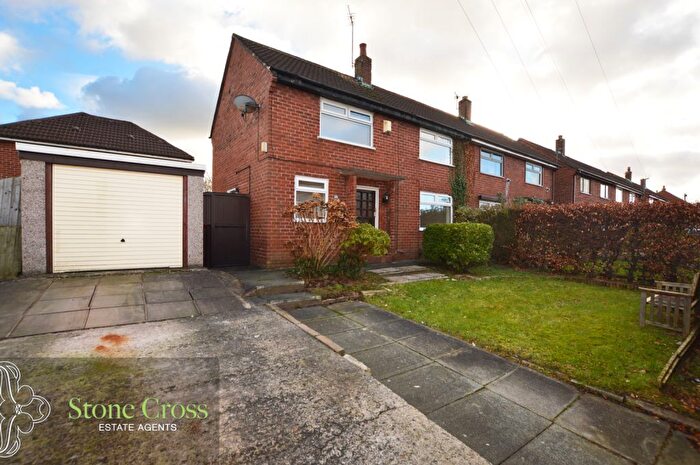
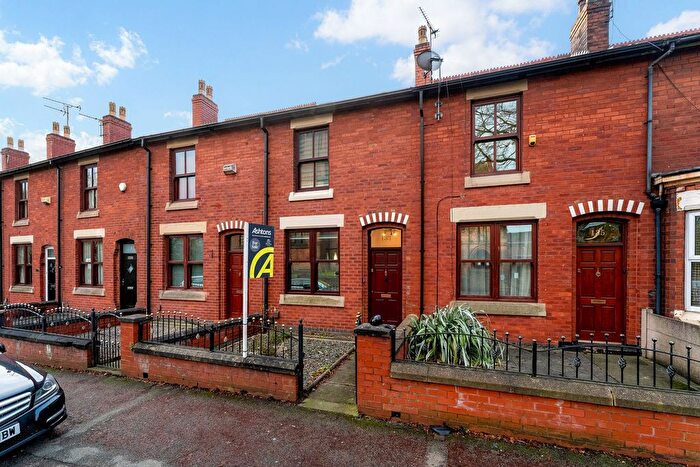
Houses for sale & to rent in Lowton East, Leigh
House Prices in Lowton East
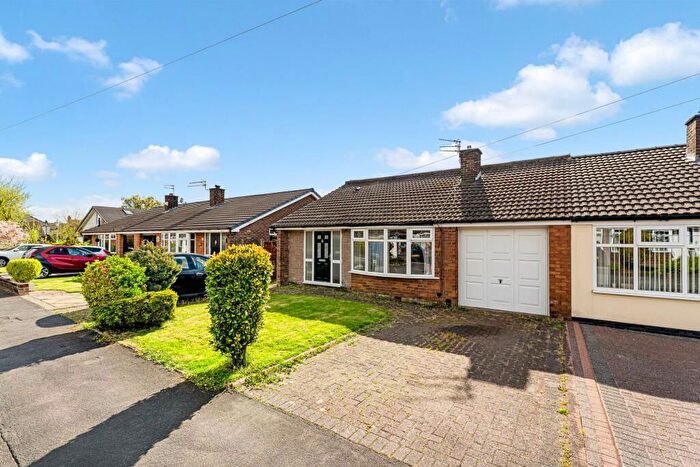
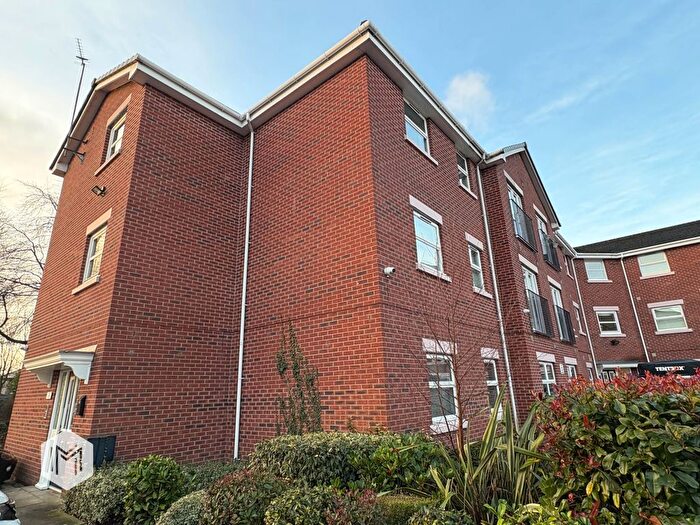
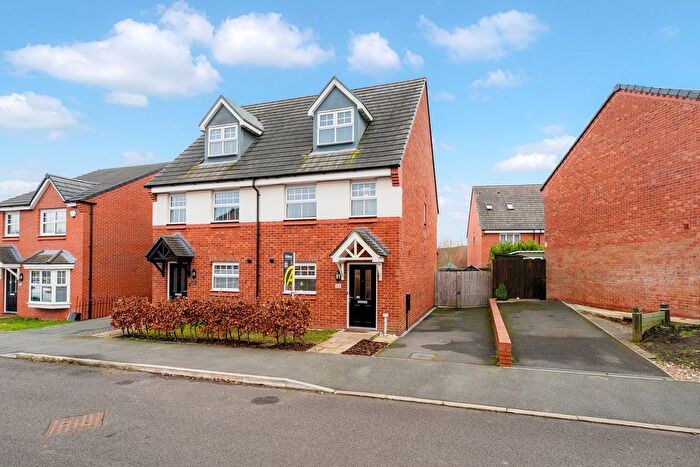
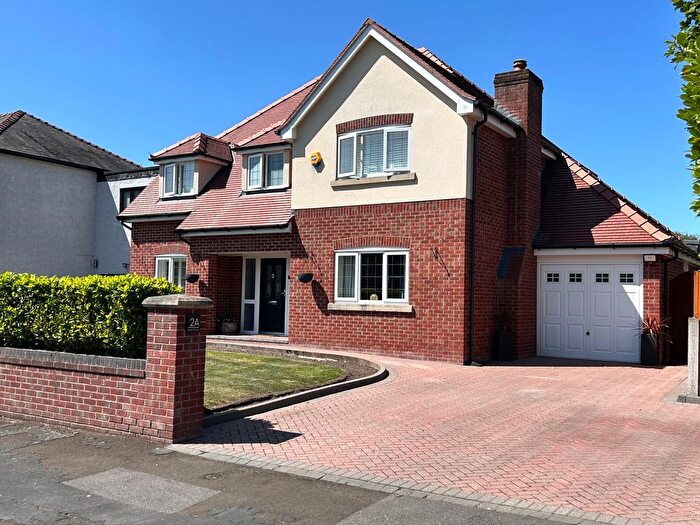
Properties in Lowton East have an average house price of £210,815.00 and had 52 Property Transactions within the last 3 years¹.
Lowton East is an area in Leigh, Wigan with 561 households², where the most expensive property was sold for £580,000.00.
Properties for sale in Lowton East
Previously listed properties in Lowton East
Roads and Postcodes in Lowton East
Navigate through our locations to find the location of your next house in Lowton East, Leigh for sale or to rent.
| Streets | Postcodes |
|---|---|
| Arlington Drive | WN7 3QN WN7 3QP |
| Aspull Common | WN7 3PB |
| Belgrave Close | WN7 3QR |
| Berkeley Close | WN7 3QJ |
| Canaan | WN7 3QS |
| Dalesford Close | WN7 3QL |
| Daric Close | WN7 3PR |
| Fieldsend Drive | WN7 3QU |
| Greenacres Close | WN7 3QX |
| Hallworthy Close | WN7 3PS |
| Kenyon Lane | WA3 4AU |
| Knotts Houses | WN7 3PW |
| Leighton Drive | WN7 3PN |
| Lincoln Close | WN7 3QW |
| Mayfield Drive | WN7 3QQ |
| Medway Close | WN7 3QT |
| Milldale Road | WN7 3PP |
| Moss Industrial Estate | WN7 3PT |
| Penfield Road | WN7 3PF WN7 3PG |
| St Helens Road | WN7 3PA WN7 3PD WN7 3PQ WN7 3QG WN7 3TS |
| The Poplars | WN7 3QH |
| Walter Leigh Way | WN7 3GP |
| William Way | WN7 3QA |
| Wilton Lane | WA3 4BA |
| Winwick Lane | WA3 7EH |
Transport near Lowton East
-
Newton-Le-Willows Station
-
Earlestown Station
-
Birchwood Station
-
Hag Fold Station
-
Daisy Hill Station
-
Atherton Station
-
Bryn Station
-
Hindley Station
-
Glazebrook Station
-
Padgate Station
- FAQ
- Price Paid By Year
- Property Type Price
Frequently asked questions about Lowton East
What is the average price for a property for sale in Lowton East?
The average price for a property for sale in Lowton East is £210,815. This amount is 24% higher than the average price in Leigh. There are 1,085 property listings for sale in Lowton East.
What streets have the most expensive properties for sale in Lowton East?
The streets with the most expensive properties for sale in Lowton East are Aspull Common at an average of £580,000, Medway Close at an average of £320,000 and Greenacres Close at an average of £261,000.
What streets have the most affordable properties for sale in Lowton East?
The streets with the most affordable properties for sale in Lowton East are Knotts Houses at an average of £125,750, St Helens Road at an average of £177,825 and Milldale Road at an average of £193,850.
Which train stations are available in or near Lowton East?
Some of the train stations available in or near Lowton East are Newton-Le-Willows, Earlestown and Birchwood.
Property Price Paid in Lowton East by Year
The average sold property price by year was:
| Year | Average Sold Price | Price Change |
Sold Properties
|
|---|---|---|---|
| 2025 | £196,446 | -11% |
19 Properties |
| 2024 | £217,368 | -2% |
19 Properties |
| 2023 | £221,425 | 12% |
14 Properties |
| 2022 | £194,655 | 19% |
19 Properties |
| 2021 | £158,267 | -6% |
28 Properties |
| 2020 | £167,437 | 3% |
24 Properties |
| 2019 | £163,000 | 16% |
27 Properties |
| 2018 | £136,771 | -8% |
21 Properties |
| 2017 | £147,749 | 6% |
16 Properties |
| 2016 | £138,594 | 5% |
20 Properties |
| 2015 | £131,895 | 7% |
26 Properties |
| 2014 | £123,173 | 5% |
15 Properties |
| 2013 | £117,113 | -15% |
18 Properties |
| 2012 | £134,914 | -4% |
12 Properties |
| 2011 | £140,777 | 24% |
9 Properties |
| 2010 | £106,846 | -14% |
13 Properties |
| 2009 | £122,287 | -31% |
12 Properties |
| 2008 | £160,305 | 14% |
9 Properties |
| 2007 | £137,090 | 0,5% |
26 Properties |
| 2006 | £136,456 | 10% |
32 Properties |
| 2005 | £122,725 | 10% |
22 Properties |
| 2004 | £110,089 | 17% |
24 Properties |
| 2003 | £91,088 | 30% |
26 Properties |
| 2002 | £63,876 | -11% |
32 Properties |
| 2001 | £71,024 | 25% |
26 Properties |
| 2000 | £53,043 | 6% |
31 Properties |
| 1999 | £49,637 | -3% |
25 Properties |
| 1998 | £50,969 | 12% |
21 Properties |
| 1997 | £44,639 | 13% |
32 Properties |
| 1996 | £39,000 | -10% |
29 Properties |
| 1995 | £42,905 | - |
18 Properties |
Property Price per Property Type in Lowton East
Here you can find historic sold price data in order to help with your property search.
The average Property Paid Price for specific property types in the last three years are:
| Property Type | Average Sold Price | Sold Properties |
|---|---|---|
| Semi Detached House | £216,033.00 | 22 Semi Detached Houses |
| Terraced House | £145,323.00 | 17 Terraced Houses |
| Flat | £90,500.00 | 1 Flat |
| Detached House | £304,056.00 | 12 Detached Houses |

