
Houses for sale in Leigh, Wigan
House Prices in Leigh
Properties in Leigh have an average house price of £170k and had 2,335 Property Transactions within the last 3 years.¹
Leigh is an area in Wigan with 21,100 households², where the most expensive property was sold for £1.14M.
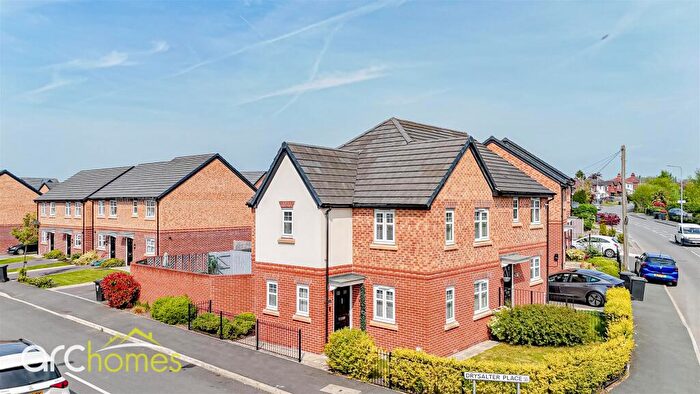
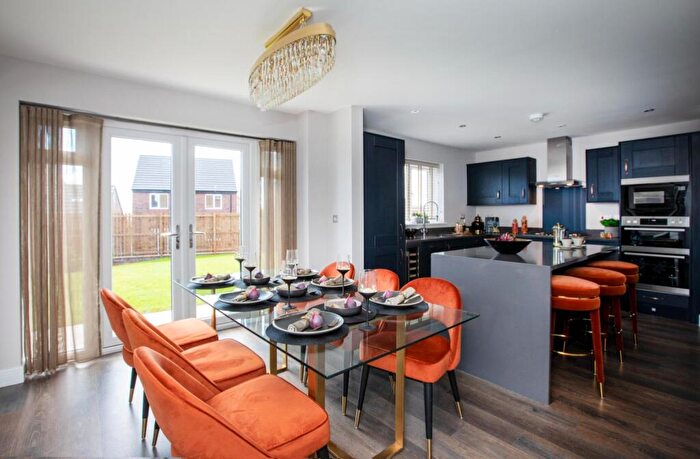
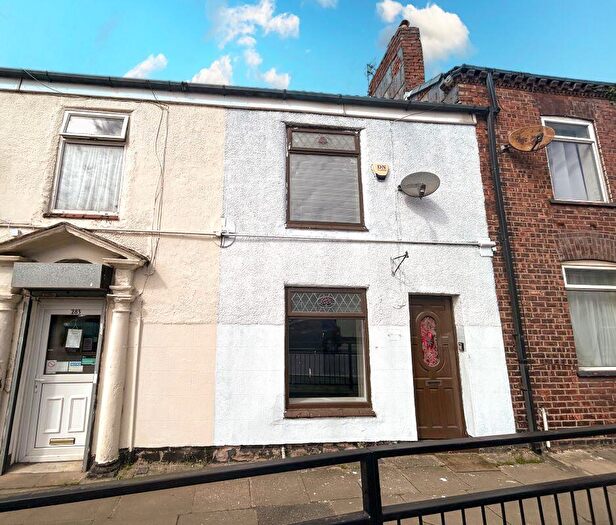
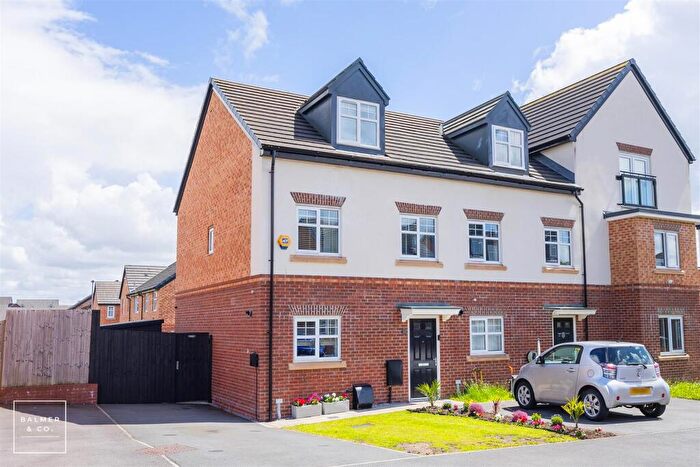
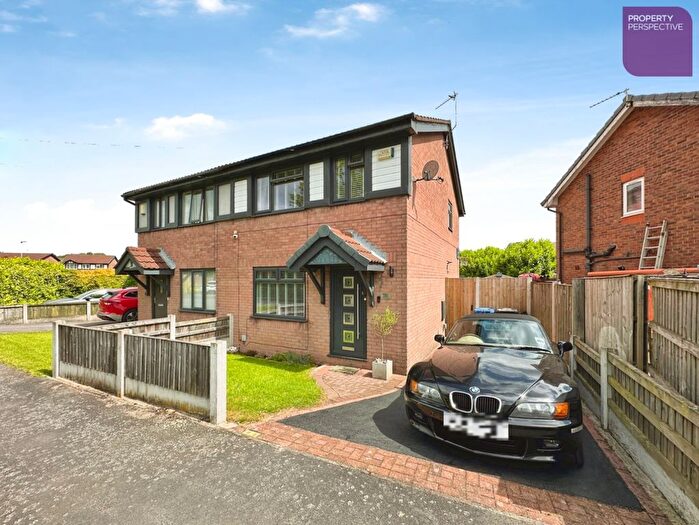
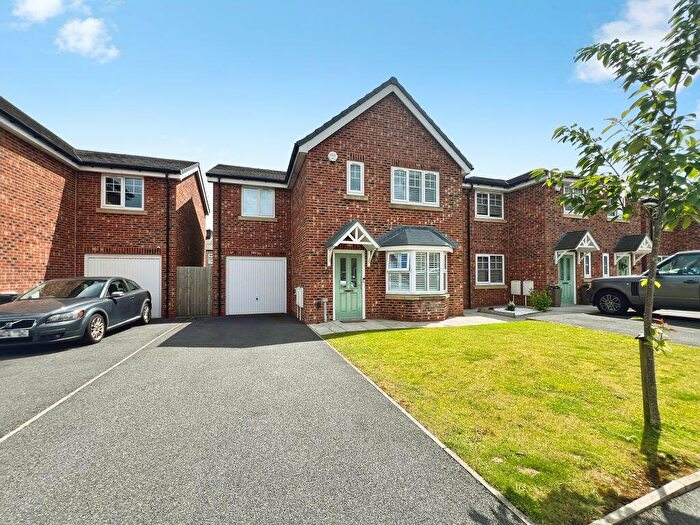
Properties for sale in Leigh
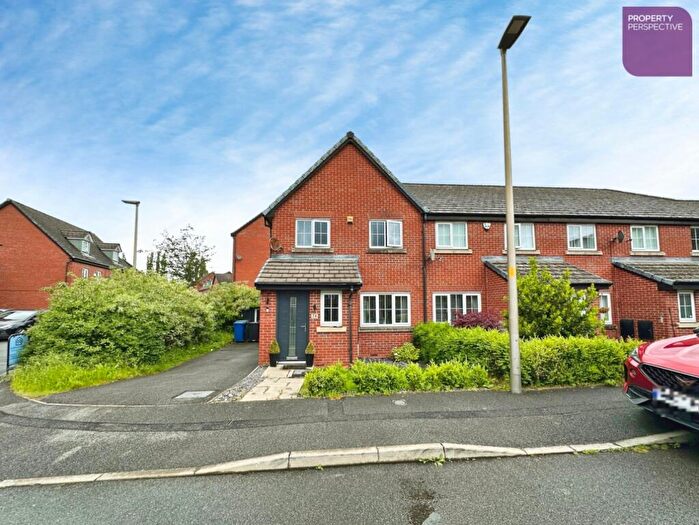
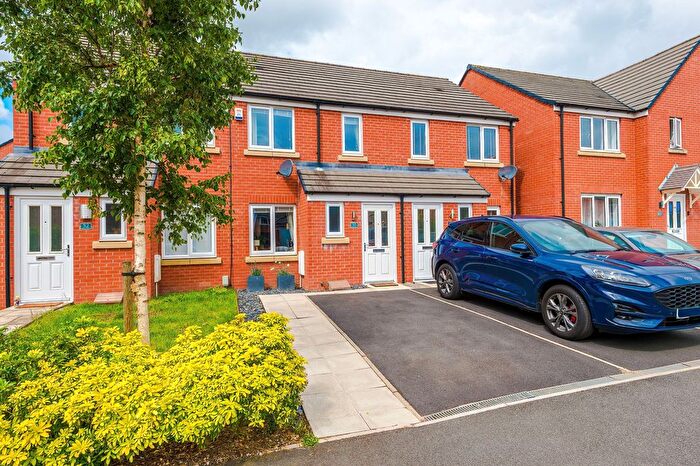
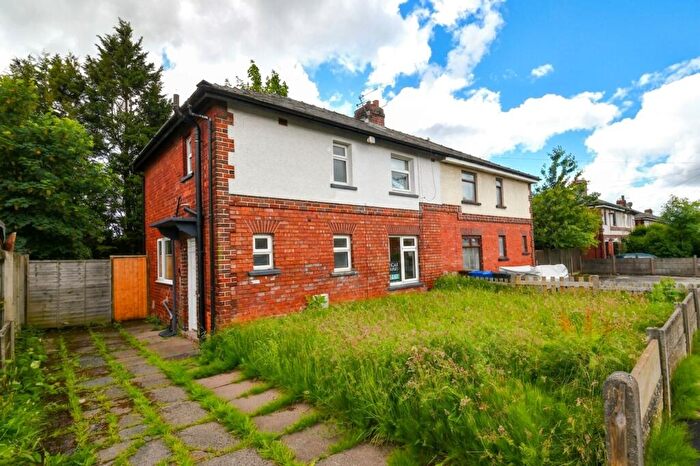
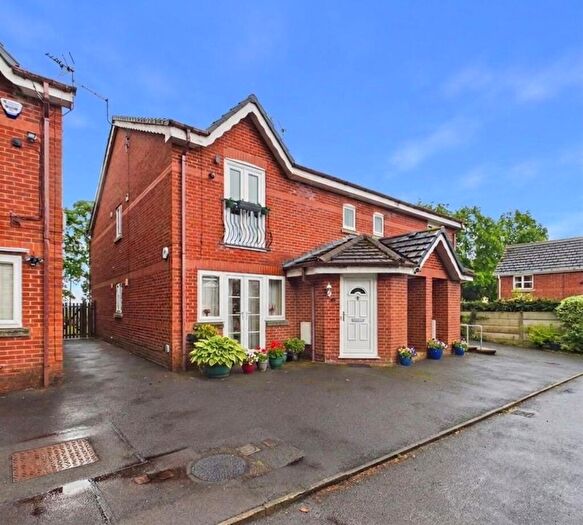
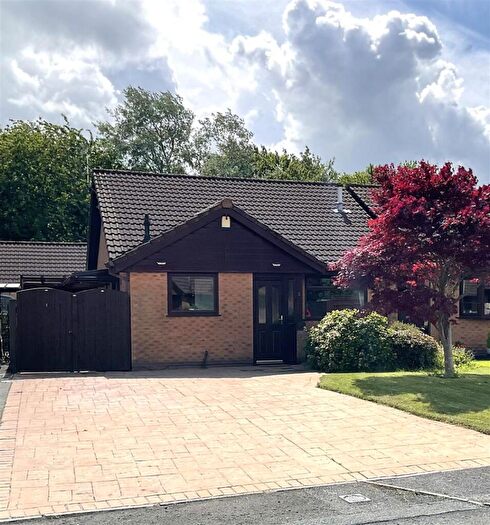
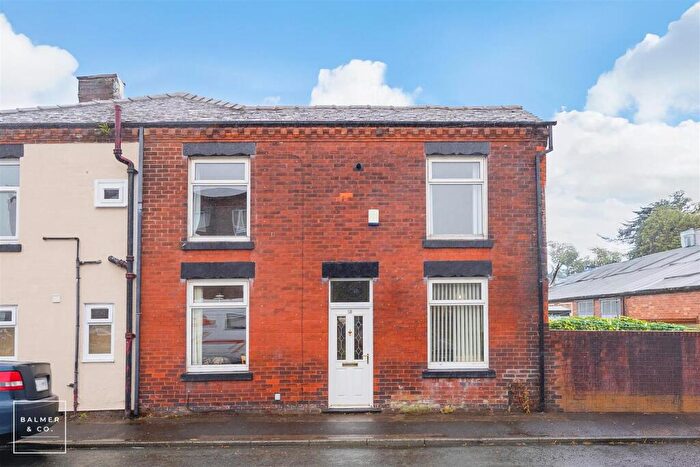
![]()
If you are looking to sell your house, let it out, or receive a property valuation, an expert can help you.
Click the button below to get started.


Neighbourhoods in Leigh
Navigate through our locations to find the location of your next house in Leigh, Wigan for sale or to rent.
Property price trends in Leigh
According to the latest Land Registry data, the average home in Leigh sold for £165,860 in 2026. That figure comes from a substantial record of 25,893 sales logged over the past 31 years.
Prices have moved up over the last three years. Compared with 2023, when the typical sale came in around £158,698, that's a rise of roughly 4.5%.
Looking back five years, average prices are up about 9% since 2021, a gain of around £13,695 in cash terms.
Zoom out to the past decade for the fuller picture. Back in 2016, homes here averaged £119,912, so the typical sold price has climbed about 38.3% since then, roughly 3.3% a year. Stretch the view to fifteen years and that annual pace edges up closer to 4%.
Frequently asked questions about Leigh
What is the average price for a property for sale in Leigh?
The average price for a property for sale in Leigh is £170,417. This amount is 11% lower than the average price in Wigan. There are 7,915 property listings for sale in Leigh.
What locations have the most expensive properties for sale in Leigh?
The locations with the most expensive properties for sale in Leigh are Lowton East at an average of £206,989, Hindley Green at an average of £197,576 and Leigh South at an average of £194,529.
What locations have the most affordable properties for sale in Leigh?
The locations with the most affordable properties for sale in Leigh are Leigh West at an average of £141,358, Atherleigh at an average of £172,520 and Leigh East at an average of £177,946.
Which train stations are available in or near Leigh?
Some of the train stations available in or near Leigh are Hag Fold, Atherton and Daisy Hill.
Property Price Paid in Leigh by Year
The average sold property price by year was:
| Year | Average Sold Price | Price Change |
Sold Properties
|
|---|---|---|---|
| 2026 | £165,860 | -11% |
46 Properties |
| 2025 | £183,958 | 7% |
667 Properties |
| 2024 | £171,045 | 7% |
825 Properties |
| 2023 | £158,698 | -3% |
797 Properties |
| 2022 | £162,836 | 7% |
920 Properties |
| 2021 | £152,165 | 0,4% |
1,111 Properties |
| 2020 | £151,499 | 13% |
849 Properties |
| 2019 | £132,222 | 6% |
1,035 Properties |
| 2018 | £124,038 | 1% |
906 Properties |
| 2017 | £122,730 | 2% |
925 Properties |
Property Price per Property Type in Leigh
Here you can find historic sold price data in order to help with your property search.
The average Property Paid Price for specific property types in the last three years are:
| Property Type | Average Sold Price | Sold Properties |
|---|---|---|
| Semi Detached House | £200,098.00 | 757 Semi Detached Houses |
| Terraced House | £129,991.00 | 1,146 Terraced Houses |
| Detached House | £318,001.00 | 247 Detached Houses |
| Flat | £102,338.00 | 185 Flats |
Transport in Leigh
Please see below transportation links in this area:
