
Houses for sale & to rent in Leigh West, Wigan
House Prices in Leigh West
Properties in Leigh West have an average house price of £123k and had 44 Property Transactions within the last 3 years¹.
Leigh West is an area in Wigan, Wigan with 263 households², where the most expensive property was sold for £270k.
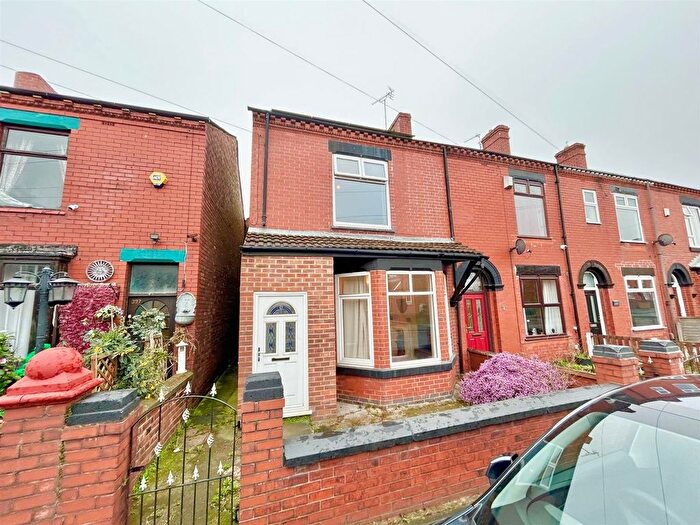
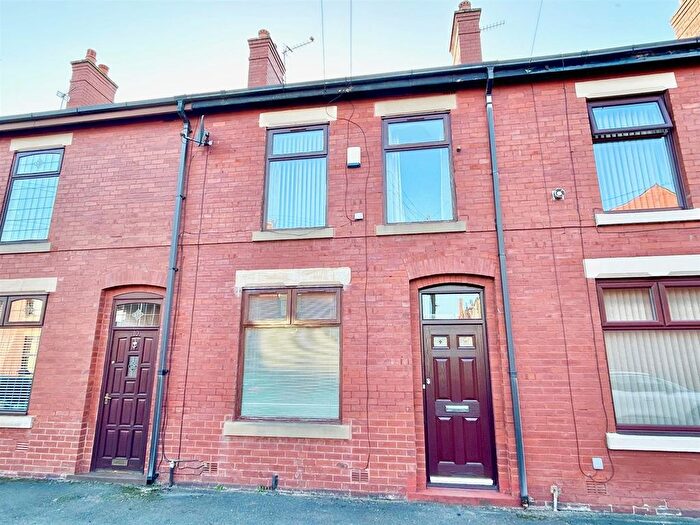
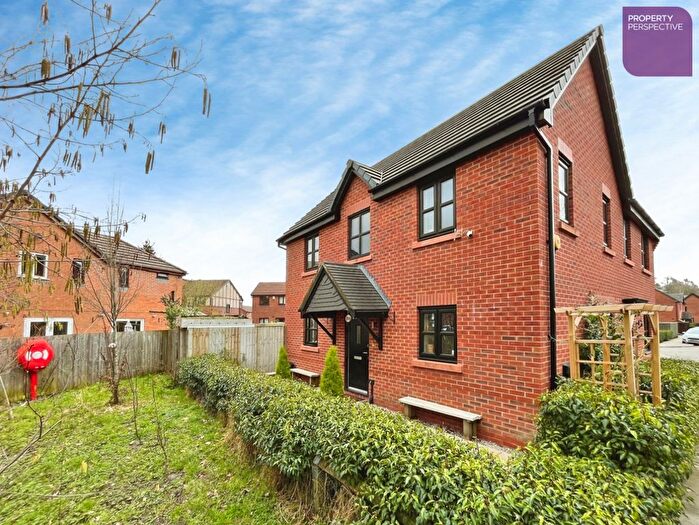
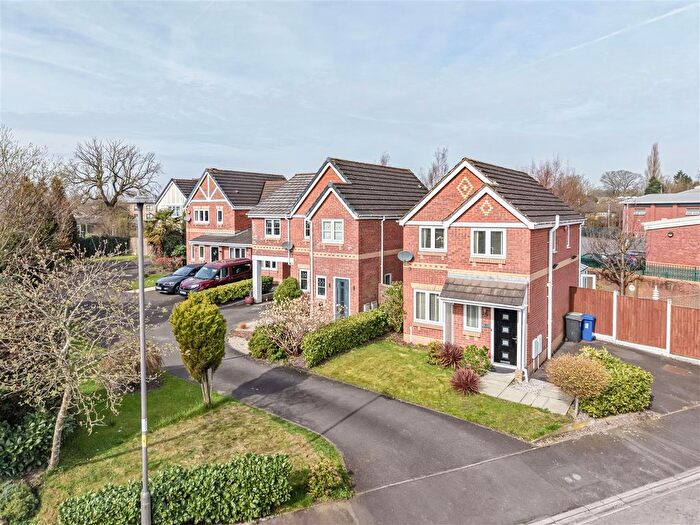
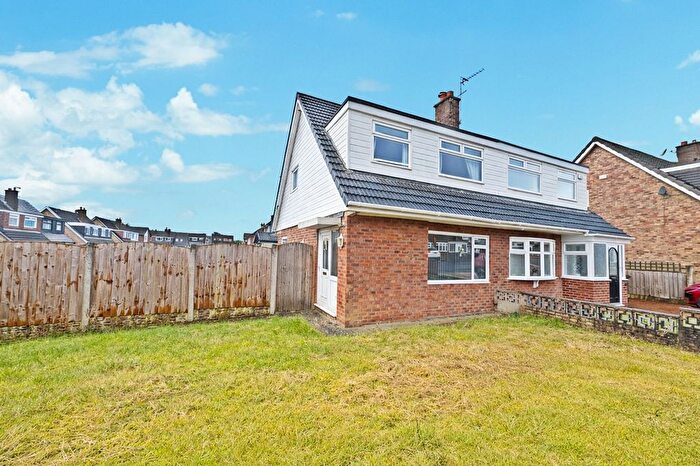
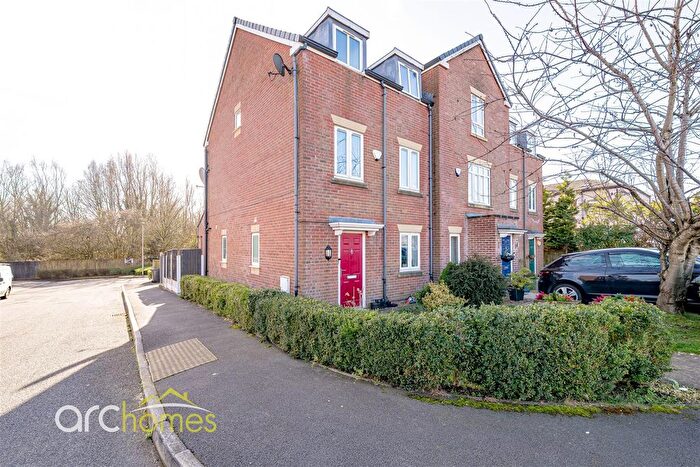
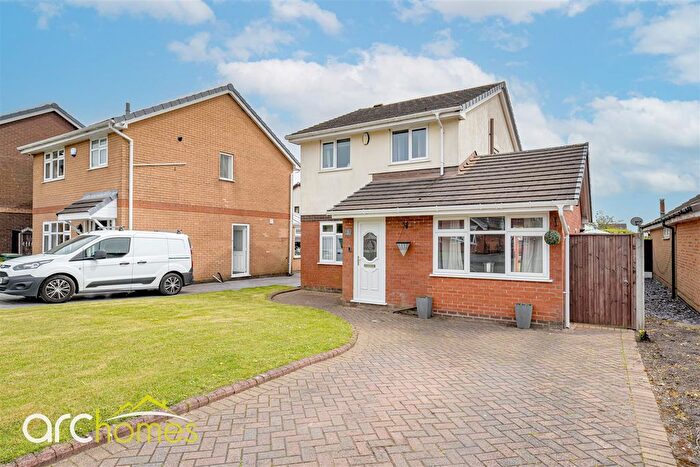
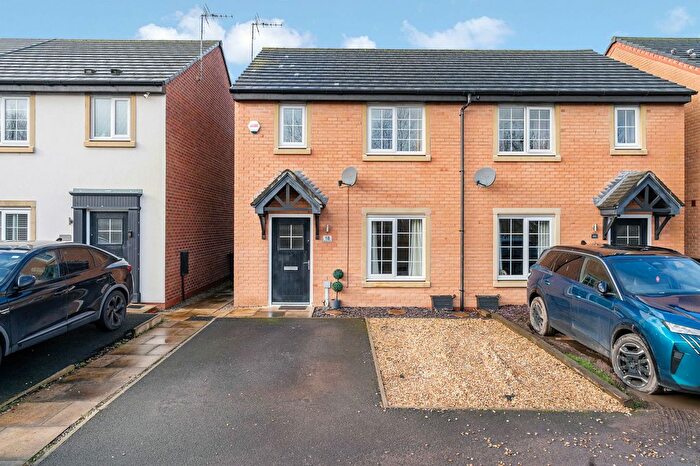
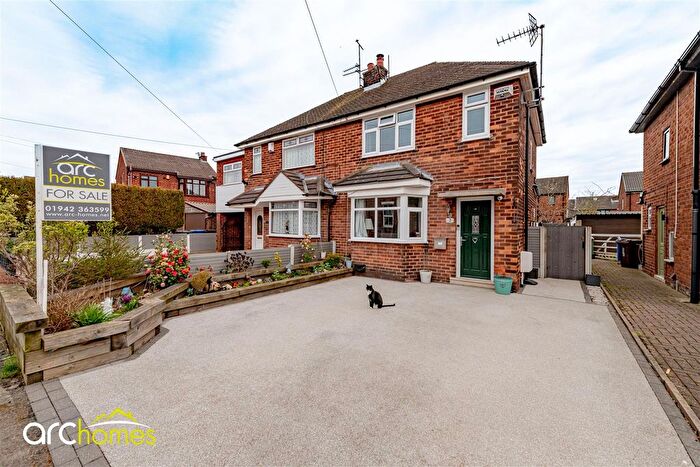
Properties for sale in Leigh West
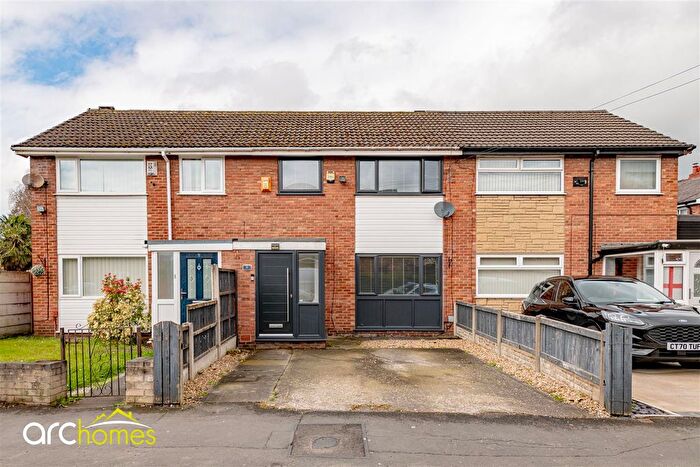
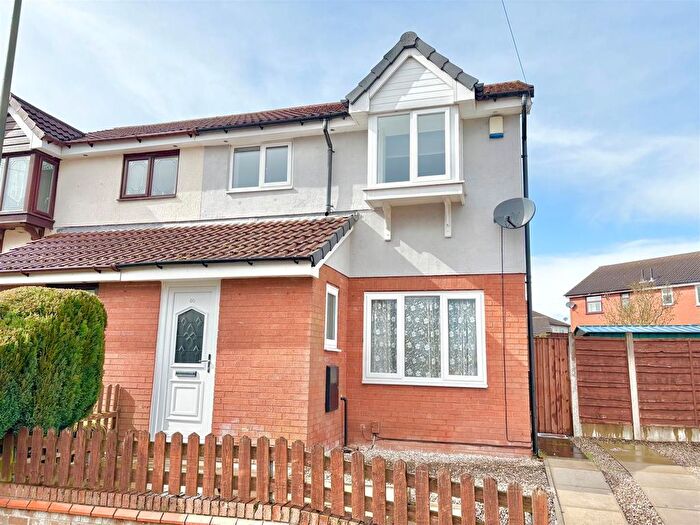
![]()
If you are looking to sell your house, let it out, or receive a property valuation, an expert can help you.
Click the button below to get started.

Roads and Postcodes in Leigh West
Navigate through our locations to find the location of your next house in Leigh West, Wigan for sale or to rent.
| Streets | Postcodes |
|---|---|
| Bank Houses | WN2 4XN |
| Bankhall Close | WN2 4UA |
| Crankwood Road | WN2 5YB WN2 5YD WN2 5YA |
| Harbrook Grove | WN2 4UB |
| Leigh Road | WN2 4XL |
| Leigh Street | WN2 4XP |
| Longacre | WN2 4LL |
| Meadow Field | WN2 4GQ |
| Smiths Lane | WN2 4XR |
Transport near Leigh West
-
 Hindley Station
 -
Daisy Hill Station
-
Hag Fold Station
-
Ince Station
-
Atherton Station
-
Westhoughton Station
-
Bryn Station
-
Wigan North Western Station
-
Wigan Wallgate Station
-
Newton-Le-Willows Station
- FAQ
- Price Paid By Year
- Property Type Price
Frequently asked questions about Leigh West
What is the average price for a property for sale in Leigh West?
The average price for a property for sale in Leigh West is £122,978. This amount is 34% lower than the average price in Wigan. There are 1,416 property listings for sale in Leigh West.
What streets have the most expensive properties for sale in Leigh West?
The streets with the most expensive properties for sale in Leigh West are Harbrook Grove at an average of £185,666, Longacre at an average of £138,285 and Leigh Road at an average of £123,289.
What streets have the most affordable properties for sale in Leigh West?
The streets with the most affordable properties for sale in Leigh West are Meadow Field at an average of £98,050 and Smiths Lane at an average of £111,000.
Which train stations are available in or near Leigh West?
Some of the train stations available in or near Leigh West are Hindley, Daisy Hill and Hag Fold.
Property Price Paid in Leigh West by Year
The average sold property price by year was:
| Year | Average Sold Price | Price Change |
Sold Properties
|
|---|---|---|---|
| 2026 | £230,000 | 50% |
1 Property |
| 2025 | £113,950 | -7% |
10 Properties |
| 2024 | £122,035 | -1% |
14 Properties |
| 2023 | £122,792 | -19% |
19 Properties |
| 2022 | £145,596 | -9% |
13 Properties |
| 2021 | £158,111 | 20% |
9 Properties |
| 2020 | £126,904 | 10% |
11 Properties |
| 2019 | £114,427 | -21% |
14 Properties |
| 2018 | £139,022 | 12% |
17 Properties |
| 2017 | £122,142 | 9% |
7 Properties |
| 2016 | £111,499 | 24% |
21 Properties |
| 2015 | £85,025 | -25% |
10 Properties |
| 2014 | £106,499 | 10% |
8 Properties |
| 2013 | £95,333 | -43% |
3 Properties |
| 2012 | £135,850 | 56% |
7 Properties |
| 2011 | £60,375 | -305% |
4 Properties |
| 2010 | £244,666 | 67% |
3 Properties |
| 2009 | £80,750 | -10% |
2 Properties |
| 2008 | £89,120 | -29% |
8 Properties |
| 2007 | £114,607 | -9% |
41 Properties |
| 2006 | £125,433 | 37% |
56 Properties |
| 2005 | £78,582 | -48% |
6 Properties |
| 2004 | £116,149 | 53% |
13 Properties |
| 2003 | £55,167 | -22% |
22 Properties |
| 2002 | £67,076 | -7% |
25 Properties |
| 2001 | £71,590 | 79% |
5 Properties |
| 2000 | £15,000 | -251% |
1 Property |
| 1999 | £52,690 | -39% |
5 Properties |
| 1998 | £73,166 | 51% |
3 Properties |
| 1997 | £35,812 | 44% |
4 Properties |
| 1996 | £20,110 | -2% |
3 Properties |
| 1995 | £20,450 | - |
4 Properties |
Property Price per Property Type in Leigh West
Here you can find historic sold price data in order to help with your property search.
The average Property Paid Price for specific property types in the last three years are:
| Property Type | Average Sold Price | Sold Properties |
|---|---|---|
| Semi Detached House | £166,750.00 | 4 Semi Detached Houses |
| Terraced House | £123,883.00 | 21 Terraced Houses |
| Flat | £86,406.00 | 16 Flats |
| Detached House | £253,333.00 | 3 Detached Houses |