
Houses for sale in Wigan, Wigan
House Prices in Wigan
Properties in Wigan have an average house price of £188k and had 8,373 Property Transactions within the last 3 years.¹
Wigan is an area in Wigan with 88,650 households², where the most expensive property was sold for £3.56M.
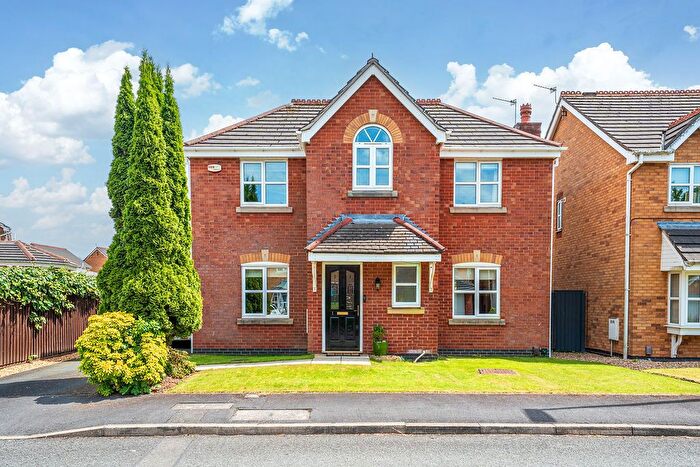
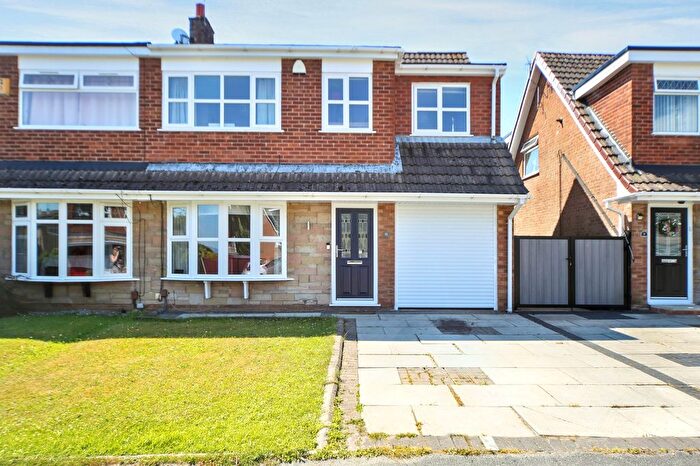
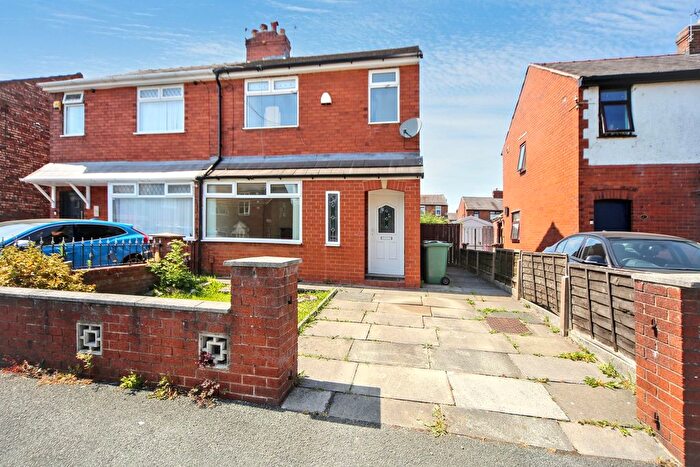
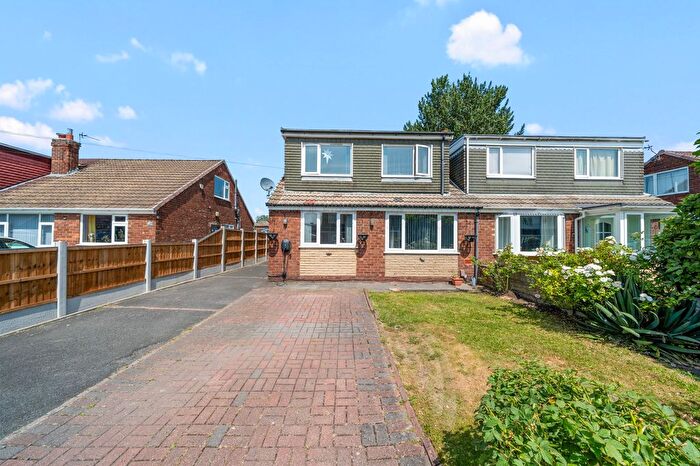
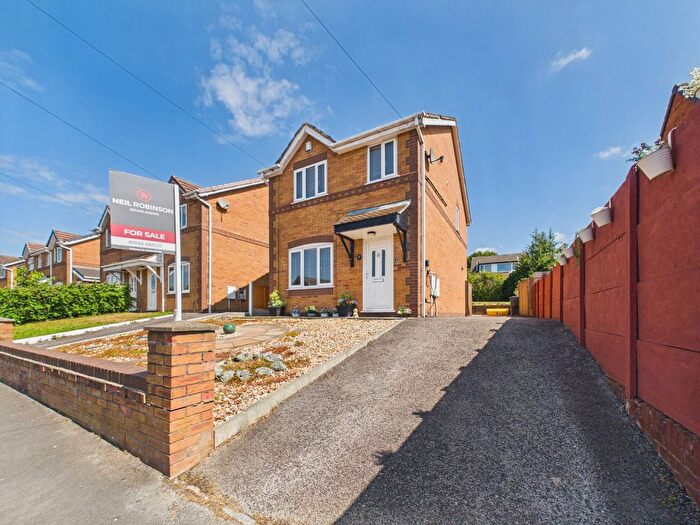
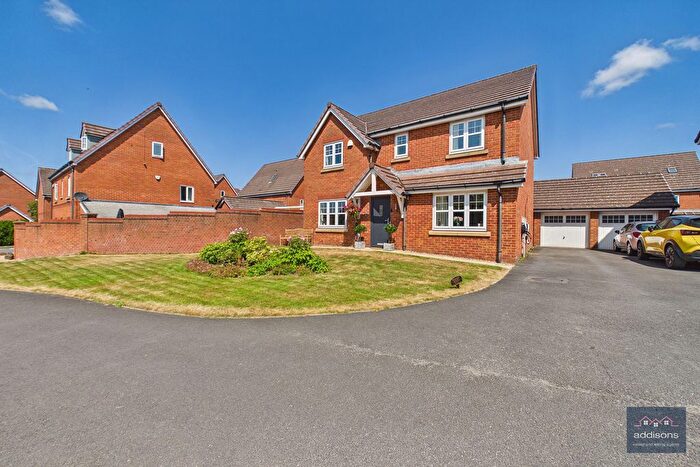
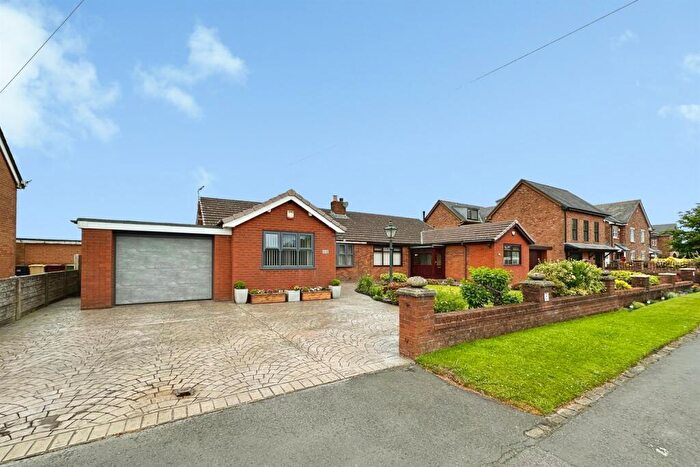
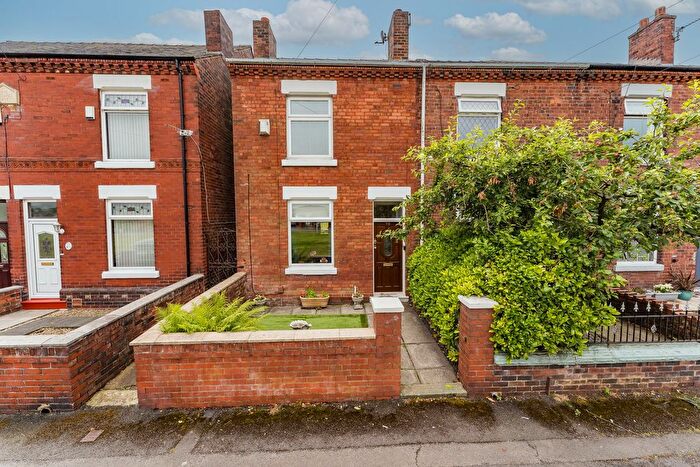
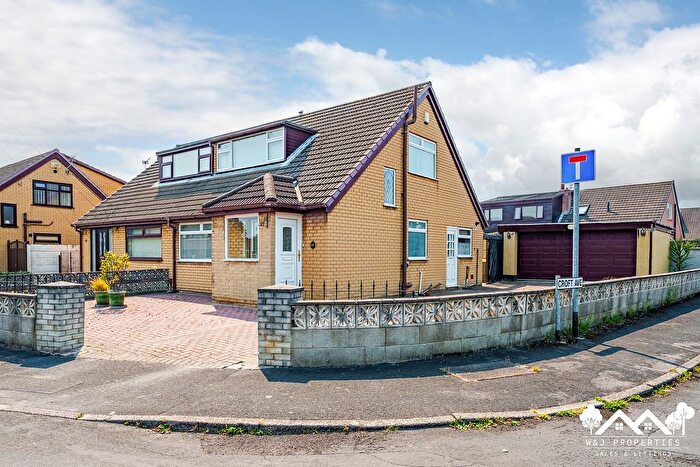
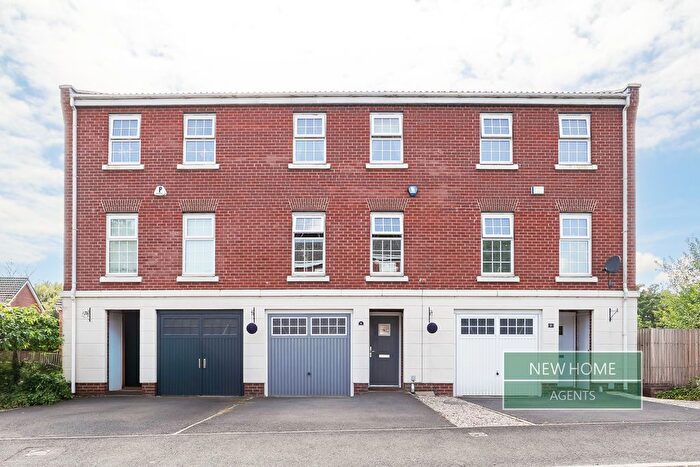
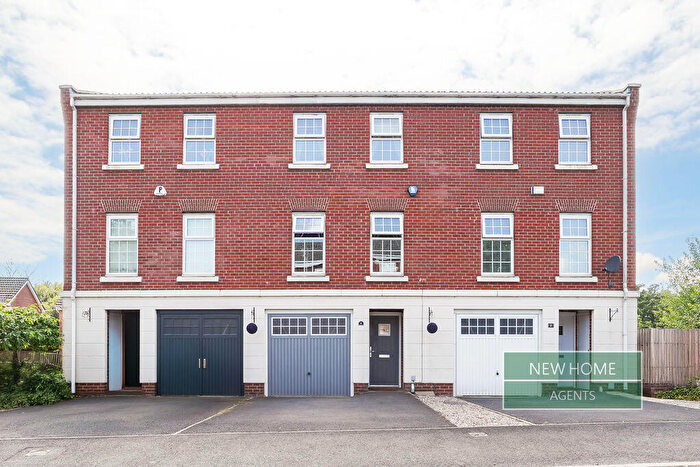
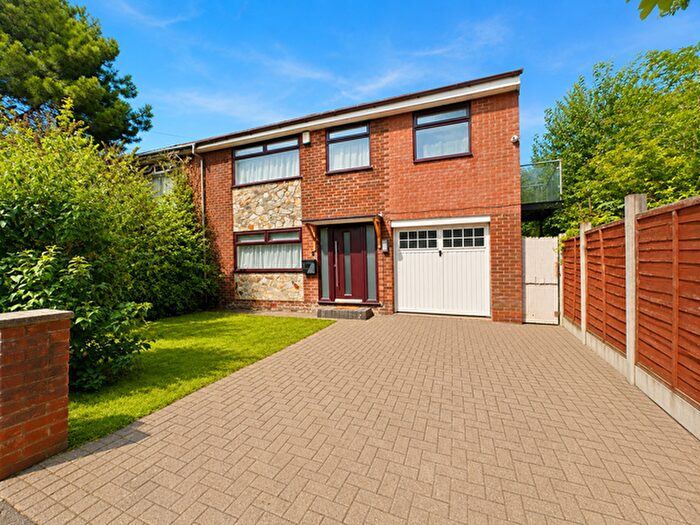
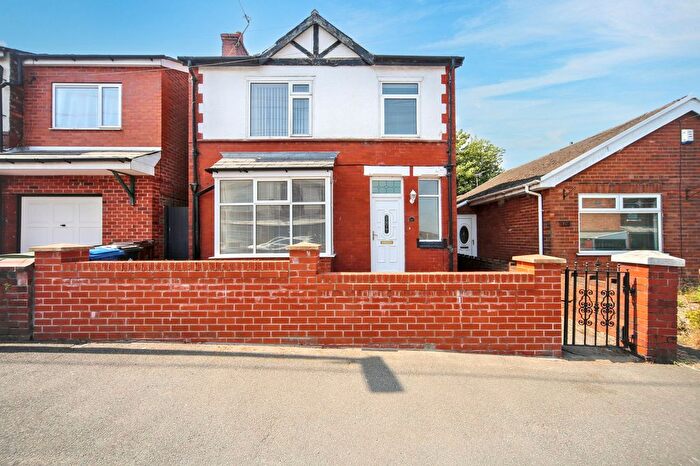
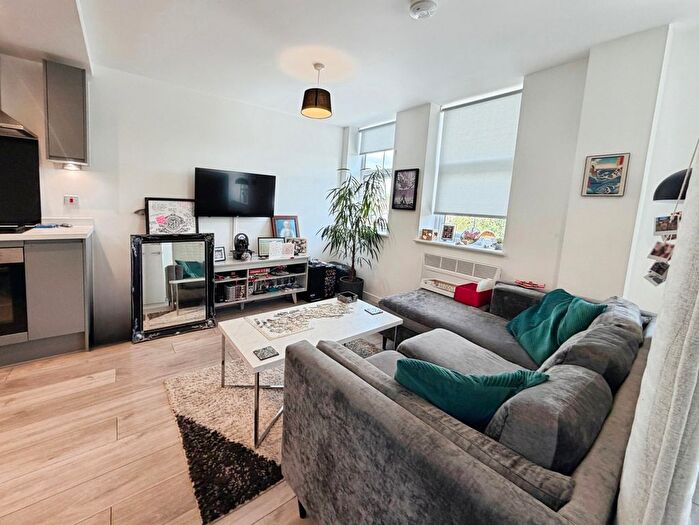
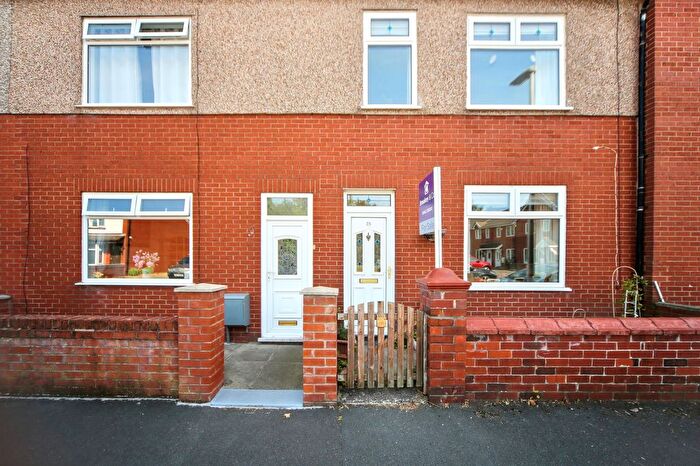
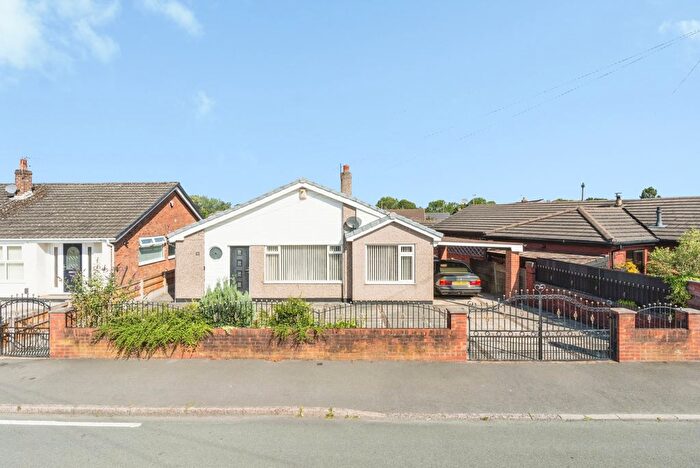
Properties for sale in Wigan
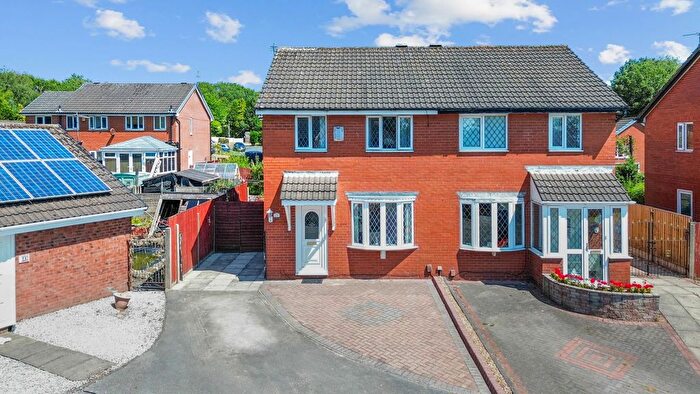
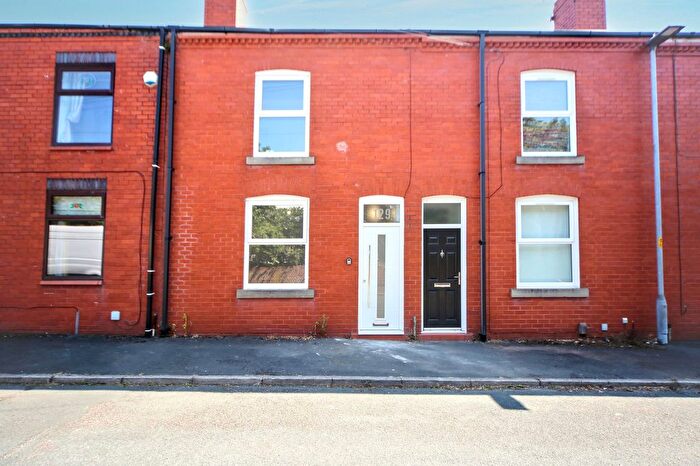
![]()
If you are looking to sell your house, let it out, or receive a property valuation, an expert can help you.
Click the button below to get started.

Neighbourhoods in Wigan
Navigate through our locations to find the location of your next house in Wigan, Wigan for sale or to rent.
- Abram
- Ashton
- Aspull New Springs Whelley
- Bryn
- Douglas
- Golborne And Lowton West
- Hindley
- Hindley Green
- Ince
- Leigh West
- Orrell
- Pemberton
- Shevington With Lower Ground
- Standish With Langtree
- Wigan Central
- Wigan West
- Winstanley
- Worsley Mesnes
- Bryn With Ashton-in-makerfield North
- Shevington With Lower Ground & Moor
Property price trends in Wigan
According to the latest Land Registry data, the average home in Wigan sold for £183,994 in 2026. That figure comes from a substantial record of 94,849 sales logged over the past 31 years.
Prices have moved up over the last three years. Compared with 2023, when the typical sale came in around £174,343, that's a rise of roughly 5.5%.
Looking back five years, average prices are up about 7% since 2021, a gain of around £12,061 in cash terms.
Zoom out to the past decade for the fuller picture. Back in 2016, homes here averaged £140,464, so the typical sold price has climbed about 31% since then, roughly 2.7% a year. Stretch the view to fifteen years and that annual pace holds at about 2.5%.
Frequently asked questions about Wigan
What is the average price for a property for sale in Wigan?
The average price for a property for sale in Wigan is £187,668. This amount is 2% lower than the average price in Wigan. There are more than 10,000 property listings for sale in Wigan.
What locations have the most expensive properties for sale in Wigan?
The locations with the most expensive properties for sale in Wigan are Standish With Langtree at an average of £254,793, Golborne And Lowton West at an average of £235,750 and Winstanley at an average of £229,497.
What locations have the most affordable properties for sale in Wigan?
The locations with the most affordable properties for sale in Wigan are Leigh West at an average of £122,327, Ince at an average of £129,145 and Douglas at an average of £141,810.
Which train stations are available in or near Wigan?
Some of the train stations available in or near Wigan are Wigan North Western, Wigan Wallgate and Ince.
Property Price Paid in Wigan by Year
The average sold property price by year was:
| Year | Average Sold Price | Price Change |
Sold Properties
|
|---|---|---|---|
| 2026 | £183,994 | -7% |
152 Properties |
| 2025 | £197,669 | 4% |
2,691 Properties |
| 2024 | £190,410 | 8% |
2,946 Properties |
| 2023 | £174,343 | -3% |
2,584 Properties |
| 2022 | £179,657 | 4% |
3,221 Properties |
| 2021 | £171,933 | 6% |
3,667 Properties |
| 2020 | £161,293 | 6% |
2,888 Properties |
| 2019 | £151,060 | 1% |
3,125 Properties |
| 2018 | £149,829 | 2% |
3,335 Properties |
| 2017 | £146,138 | 4% |
3,196 Properties |
Property Price per Property Type in Wigan
Here you can find historic sold price data in order to help with your property search.
The average Property Paid Price for specific property types in the last three years are:
| Property Type | Average Sold Price | Sold Properties |
|---|---|---|
| Semi Detached House | £190,303.00 | 3,391 Semi Detached Houses |
| Terraced House | £135,322.00 | 3,115 Terraced Houses |
| Detached House | £319,430.00 | 1,444 Detached Houses |
| Flat | £102,223.00 | 423 Flats |
Transport in Wigan
Please see below transportation links in this area:
