
Houses for sale & to rent in Orrell, Wigan
House Prices in Orrell
Properties in Orrell have an average house price of £228k and had 492 Property Transactions within the last 3 years¹.
Orrell is an area in Wigan, Wigan with 5,056 households², where the most expensive property was sold for £760k.
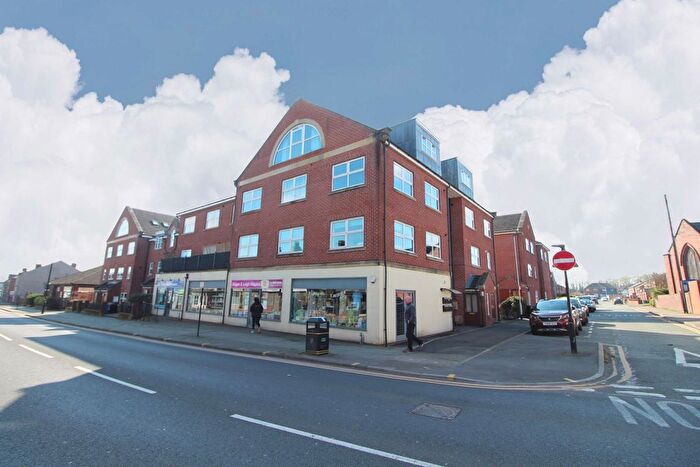
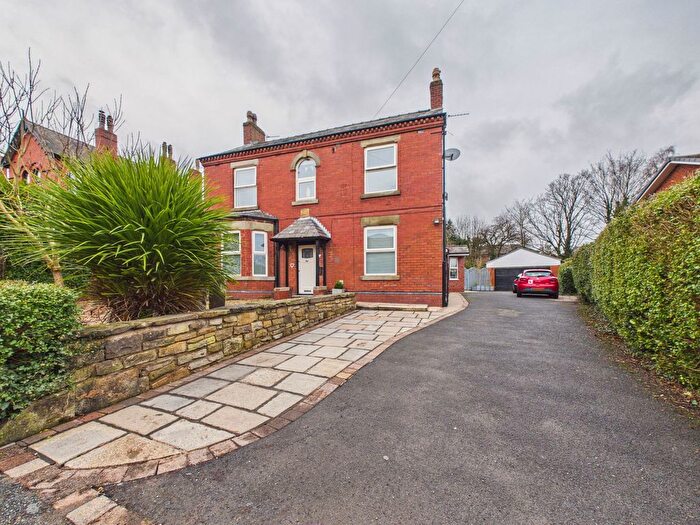
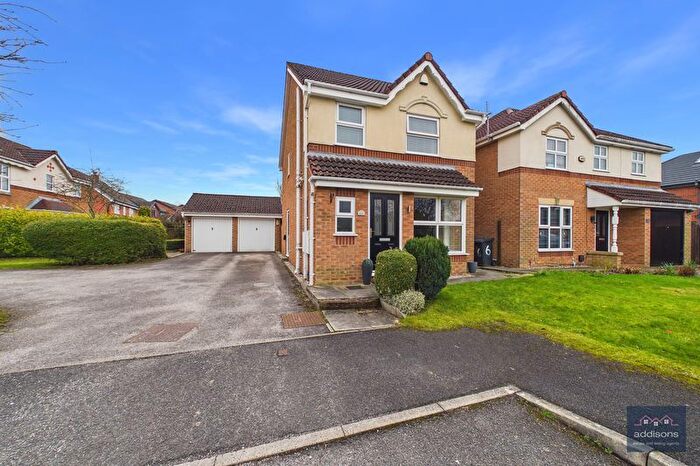
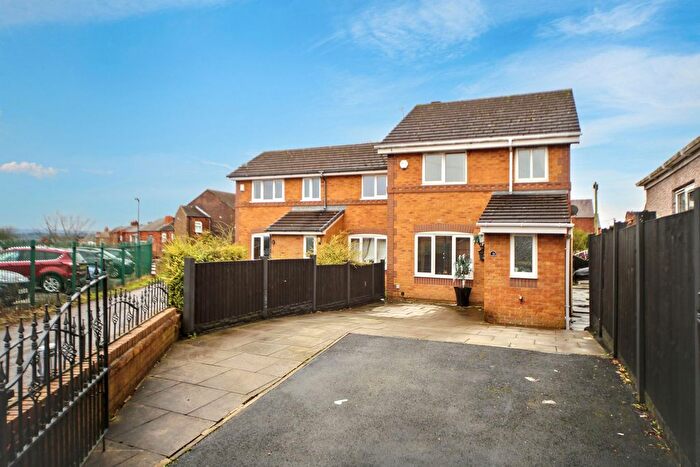
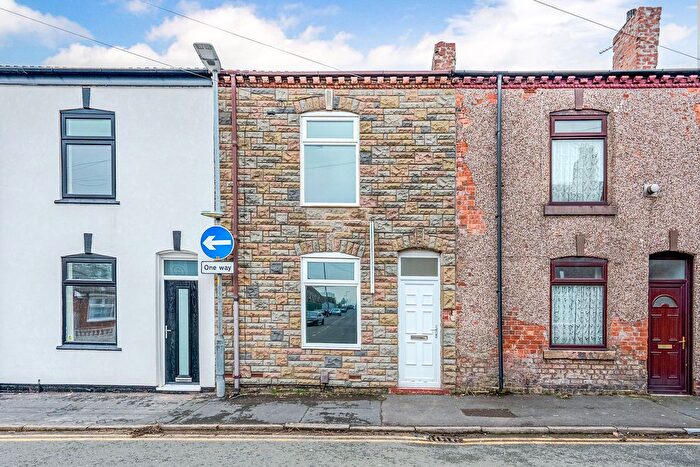
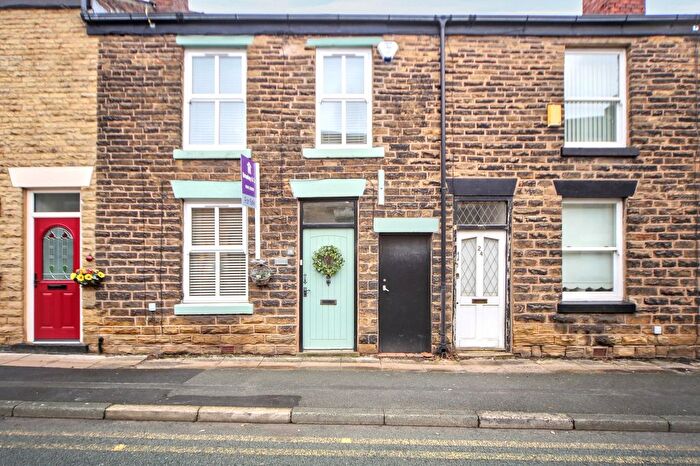
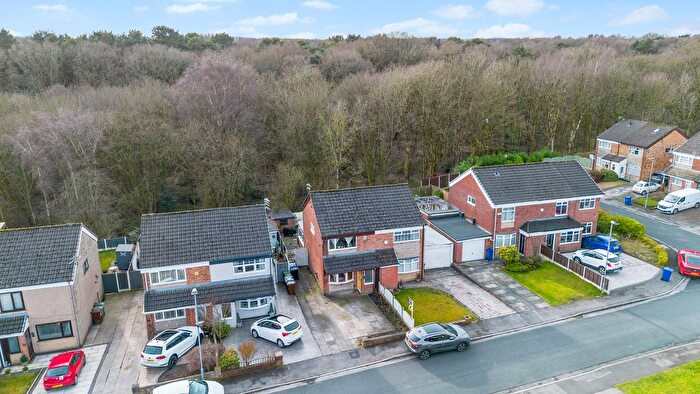
Properties for sale in Orrell
![]()
If you are looking to sell your house, let it out, or receive a property valuation, an expert can help you.
Click the button below to get started.
Roads and Postcodes in Orrell
Navigate through our locations to find the location of your next house in Orrell, Wigan for sale or to rent.
| Streets | Postcodes |
|---|---|
| Abbey Drive | WN5 8RW |
| Anvil Close | WN5 8TN |
| Ash Grove | WN5 8NG |
| Ashton Road | WN5 7XX WN5 7XZ |
| Banbury Road | WN5 7DZ |
| Bank Avenue | WN5 8TY |
| Beechwood Crescent | WN5 8NL |
| Belmont Avenue | WN5 7BZ |
| Bennett Drive | WN5 7AR |
| Beverley Avenue | WN5 7JL |
| Bispham Court | WN5 7ED |
| Blackledge Close | WN5 8TB |
| Brick Kiln Grove | WN5 7FR |
| Brooklands Drive | WN5 8TT |
| Brownlow Lane | WN5 7EY |
| Broxton Avenue | WN5 8NP |
| Bryony Close | WN5 8US |
| Burns Close | WN5 7EW |
| Byron Close | WN5 8PB |
| Cambridge Road | WN5 8PL |
| Cedar Grove | WN5 8NH |
| Cheltenham Drive | WN5 7DY |
| Church Drive | WN5 8ST |
| Church Street | WN5 7AS WN5 8TG WN5 8TQ |
| Clay Kiln Close | WN5 7FS |
| Cob Moor Road | WN5 7EH |
| Cobmoor Avenue | WN5 7EQ |
| Coleridge Road | WN5 7EB |
| Collisdene Road | WN5 8RL |
| Coniston Avenue | WN5 8NR WN5 8PR WN5 8PX |
| Coppice Drive | WN5 7DX |
| Cosgate Close | WN5 8SG |
| Crank Road | WN5 7DT WN5 7EX WN5 7EZ WN5 7DU WN5 7EU |
| Croft Avenue | WN5 8TW |
| Croftlands | WN5 7AD |
| Cross Lane | WN5 7DB |
| Dalecrest | WN5 7JZ |
| Deanwood Avenue | WN5 8QF |
| Deighton Close | WN5 8RZ |
| Delphside Close | WN5 8TS |
| Delphside Road | WN5 8TR |
| Derwent Road | WN5 8PJ WN5 8PP |
| Doric Green | WN5 7BP |
| Douglas Drive | WN5 8NT |
| Downham Walk | WN5 7ER |
| East Mount | WN5 8LR |
| Edge Hall Road | WN5 8TL |
| Eton Way | WN5 8PN |
| Farm Meadow Road | WN5 8TE |
| Fisher Drive | WN5 8QX |
| Foxwood Close | WN5 8TD |
| Gantley Avenue | WN5 7AF |
| Gantley Crescent | WN5 7AG |
| Gantley Road | WN5 7AE |
| Gategill Grove | WN5 7DS |
| Gathurst Road | WN5 8QD WN5 8QE WN5 8QH WN5 8QJ |
| Gauntley Gardens | WN5 7FP |
| Georges Terrace | WN5 8SZ |
| Gordonstoun Crescent | WN5 8NZ |
| Grasmere Avenue | WN5 8PS |
| Green Lane | WN5 7DD |
| Greenbank Avenue | WN5 7BX |
| Greenford Close | WN5 8RH |
| Greenlea Close | WN5 8UR |
| Greenslate Court | WN5 7BH |
| Greenslate Road | WN5 7BG WN5 7BQ WN5 7DQ |
| Greenways | WN5 7DF |
| Hall Lane | WN5 7XN |
| Hanstock Close | WN5 8SW |
| Harrow Close | WN5 8PH |
| Harswell Close | WN5 8RG |
| Hartley Green Gardens | WN5 7GA WN5 7GB |
| Hartley Way | WN5 7GL |
| Hawthorn Avenue | WN5 8NQ |
| Hewitt Business Park | WN5 7XB |
| Heyes Road | WN5 8RJ |
| Higher End Close | WN5 7EE |
| Holgate Drive | WN5 8SL |
| Holt Street | WN5 8TA |
| Howards Lane | WN5 8PY WN5 8PZ WN5 8NU |
| Hunters Chase | WN5 7HZ |
| Irwell Road | WN5 8NX |
| Jacob Court | WN5 7GE |
| Jubilee Avenue | WN5 7BB |
| Keats Avenue | WN5 7EN |
| Lakes Drive | WN5 8RP |
| Lakeside Avenue | WN5 7BJ |
| Latimer Close | WN5 8PD |
| Linden Avenue | WN5 8RY |
| Linden Court | WN5 8RU |
| Linden Grove | WN5 8RX |
| Linden Walk | WN5 8RT |
| Lodge Road | WN5 7AT |
| Longshaw Avenue | WN5 7JT |
| Longshaw Close | WN5 7JP |
| Longshaw Common | WN5 7JD WN5 7JE |
| Longshaw Old Road | WN5 7JJ |
| Lynbridge Close | WN5 8SR |
| Majestic Mews | WN5 8UU |
| Marl Grove | WN5 7BA |
| Meadow Gardens | WN5 8DU |
| Meadow View | WN5 8QA WN5 8QG |
| Melford Drive | WN5 7DG |
| Melling Avenue | WN5 7JN |
| Mereland Close | WN5 8RQ |
| Mersey Road | WN5 8NY WN5 8PE |
| Middlecot Close | WN5 8SQ |
| Mill Road | WN5 8TX |
| Millcroft Avenue | WN5 8TP |
| Milton Grove | WN5 7EL |
| Moor Road | WN5 8ND WN5 8RR WN5 8SA WN5 8SH WN5 8SJ |
| Moorfield Meadow | WN5 7FQ |
| Moss Avenue | WN5 7BY |
| Moss Road | WN5 7BS WN5 7BT WN5 7BU |
| Mount Crescent | WN5 8LS |
| Munro Avenue | WN5 8RS |
| Naburn Drive | WN5 8SB |
| Norfolk Road | WN5 7JR |
| Old Station Court | WN5 7AP |
| Orchard Court | WN5 7BF |
| Orrell Gardens | WN5 8NA |
| Orrell Road | WN5 8HG WN5 8HH WN5 8HQ WN5 8LY WN5 8NB WN5 8QU WN5 8QY WN5 8QZ WN5 8LZ |
| Oxford Road | WN5 8PQ |
| Oxhouse Road | WN5 7AN |
| Paignton Close | WN5 7JF |
| Park Avenue | WN5 7JW |
| Park Road | WN5 7JS WN5 7XL |
| Parkside Crescent | WN5 8LU |
| Pemberton Road | WN5 7YB |
| Pinewood Crescent | WN5 8NF |
| Red Chestnut Close | WN5 7AQ |
| Rivers Street | WN5 8NE WN5 8NJ |
| Rosemont Place | WN5 8EE |
| Rugby Close | WN5 8UY |
| Rugby Drive | WN5 8PW |
| Rydal Avenue | WN5 8PU |
| Sallowfields | WN5 8UT |
| Sandbrook Gardens | WN5 8TZ |
| Sandcross Close | WN5 7AH |
| Sandy Lane | WN5 7AY WN5 7AZ |
| Sefton Road | WN5 8UP |
| Sefton View | WN5 8UL |
| Shirewell Road | WN5 8SP |
| Smethurst Hall Park | WN5 7DR |
| Smethurst Road | WN5 7DP WN5 7DW |
| Smithy Glen Drive | WN5 7XH |
| Spencers Lane | WN5 8RA WN5 8RB |
| Spring Road | WN5 8QB |
| St James Road | WN5 7AA WN5 7AB WN5 8SS WN5 8SX WN5 8SY WN5 8TU WN5 7BD |
| St Lukes Drive | WN5 7AU |
| Station Avenue | WN5 8TH WN5 8TJ |
| Storwood Close | WN5 8SD |
| Sunny Drive | WN5 8LP |
| Swinburn Grove | WN5 7JX |
| Tarnside Road | WN5 8RN |
| Tennyson Drive | WN5 7EJ |
| Thames Drive | WN5 8NS |
| The Avenue | WN5 7BN |
| The Croft | WN5 7DA |
| The Orchards | WN5 8SE |
| Thirlmere Avenue | WN5 8PT |
| Torquay Drive | WN5 7JG |
| Tracks Lane | WN5 7BL |
| Trevelyan Drive | WN5 7JU |
| Turners Yard | WN5 8SN |
| Ullswater Avenue | WN5 8PF |
| Union Close | WN5 8UX |
| Upholland Road | WN5 7AJ WN5 7DH WN5 7DJ WN5 7DL WN5 7DN WN5 7EF WN5 7EG WN5 7JB WN5 7JH WN5 7JQ |
| Vicarage Road | WN5 7AX |
| Wallbrook Avenue | WN5 7JY |
| Watermede | WN5 7BE |
| Welburn Close | WN5 8RF |
| Wescoe Close | WN5 8TF |
| West Mount | WN5 8LX |
| Westgate Drive | WN5 8SU |
| Wigan Road | WN5 7XS |
| Willard Avenue | WN5 7DE |
| Wilsham Road | WN5 8SF |
| Winchester Close | WN5 8PA |
| Winchester Road | WN5 7EA |
| Windermere Road | WN5 8PG |
| Winstanley Road | WN5 7XA WN5 7XD WN5 7XE WN5 7XG WN5 7XF |
| Wordsworth Avenue | WN5 7EP WN5 8LT |
Transport near Orrell

- FAQ
- Price Paid By Year
- Property Type Price
Frequently asked questions about Orrell
What is the average price for a property for sale in Orrell?
The average price for a property for sale in Orrell is £227,912. This amount is 22% higher than the average price in Wigan. There are 662 property listings for sale in Orrell.
What streets have the most expensive properties for sale in Orrell?
The streets with the most expensive properties for sale in Orrell are Meadow Gardens at an average of £670,000, Bennett Drive at an average of £470,000 and Middlecot Close at an average of £445,000.
What streets have the most affordable properties for sale in Orrell?
The streets with the most affordable properties for sale in Orrell are Gantley Avenue at an average of £70,225, Majestic Mews at an average of £88,333 and Howards Lane at an average of £104,998.
Which train stations are available in or near Orrell?
Some of the train stations available in or near Orrell are Orrell, Upholland and Pemberton.
Property Price Paid in Orrell by Year
The average sold property price by year was:
| Year | Average Sold Price | Price Change |
Sold Properties
|
|---|---|---|---|
| 2025 | £237,752 | 5% |
156 Properties |
| 2024 | £225,974 | 3% |
184 Properties |
| 2023 | £220,160 | -3% |
152 Properties |
| 2022 | £226,905 | 10% |
182 Properties |
| 2021 | £204,625 | -1% |
262 Properties |
| 2020 | £206,376 | 11% |
185 Properties |
| 2019 | £184,623 | -8% |
214 Properties |
| 2018 | £198,646 | 6% |
232 Properties |
| 2017 | £186,731 | 6% |
254 Properties |
| 2016 | £176,091 | 0,3% |
237 Properties |
| 2015 | £175,619 | 12% |
204 Properties |
| 2014 | £154,877 | -5% |
237 Properties |
| 2013 | £162,193 | 3% |
185 Properties |
| 2012 | £158,064 | 3% |
133 Properties |
| 2011 | £153,545 | -7% |
159 Properties |
| 2010 | £163,766 | -2% |
134 Properties |
| 2009 | £167,287 | 1% |
105 Properties |
| 2008 | £164,804 | -4% |
142 Properties |
| 2007 | £171,731 | -2% |
229 Properties |
| 2006 | £175,072 | 12% |
232 Properties |
| 2005 | £153,539 | 6% |
189 Properties |
| 2004 | £144,543 | 6% |
252 Properties |
| 2003 | £135,361 | 30% |
307 Properties |
| 2002 | £95,084 | 23% |
227 Properties |
| 2001 | £73,074 | -5% |
189 Properties |
| 2000 | £76,910 | 7% |
211 Properties |
| 1999 | £71,324 | 4% |
244 Properties |
| 1998 | £68,376 | 18% |
170 Properties |
| 1997 | £56,378 | 7% |
146 Properties |
| 1996 | £52,447 | 4% |
185 Properties |
| 1995 | £50,215 | - |
121 Properties |
Property Price per Property Type in Orrell
Here you can find historic sold price data in order to help with your property search.
The average Property Paid Price for specific property types in the last three years are:
| Property Type | Average Sold Price | Sold Properties |
|---|---|---|
| Flat | £99,099.00 | 19 Flats |
| Semi Detached House | £218,284.00 | 231 Semi Detached Houses |
| Detached House | £363,801.00 | 92 Detached Houses |
| Terraced House | £175,710.00 | 150 Terraced Houses |