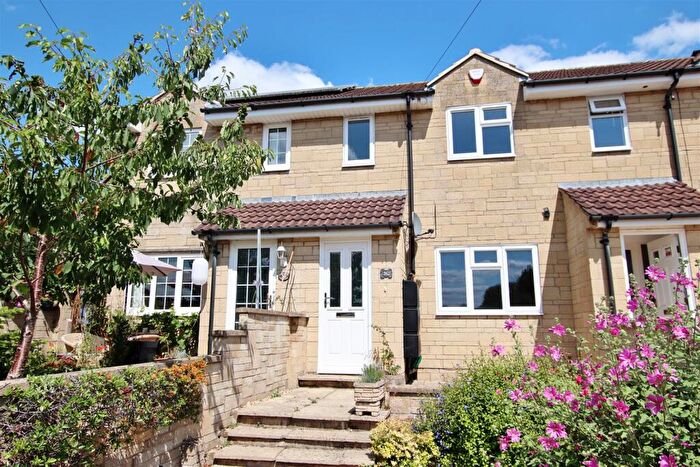
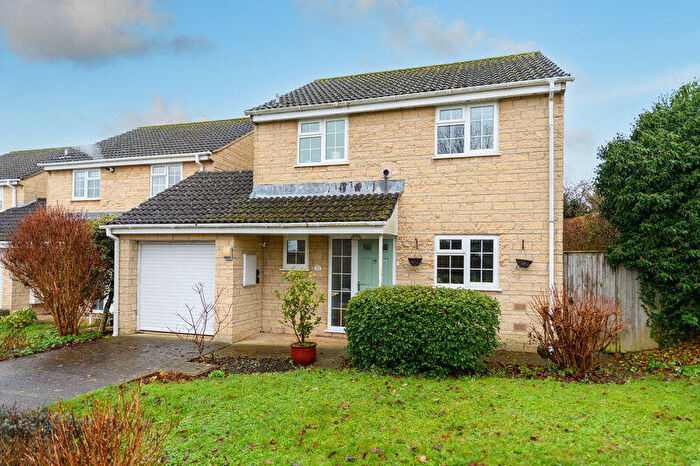
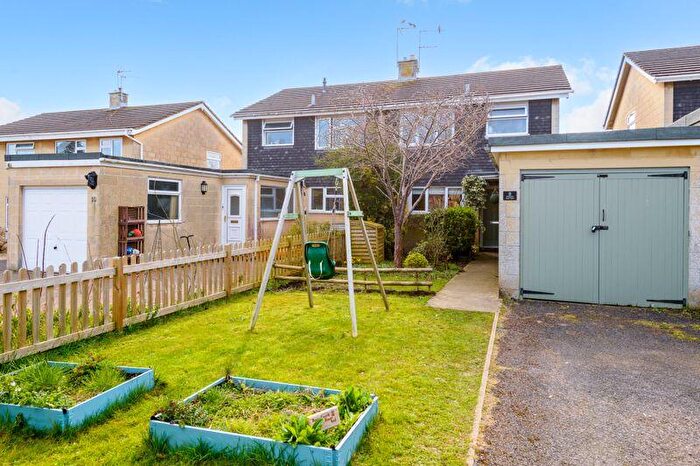
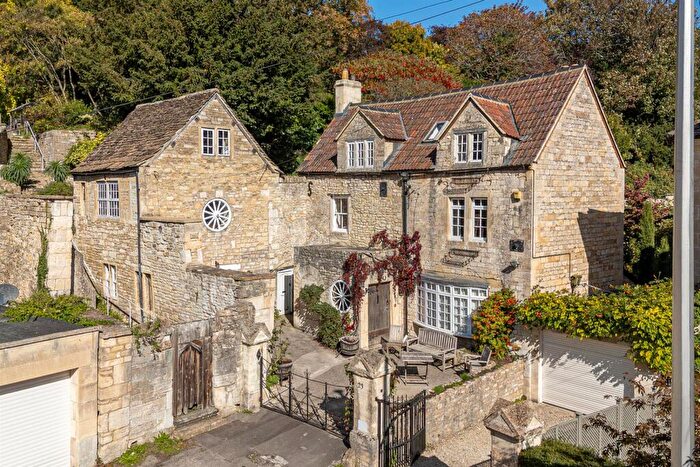
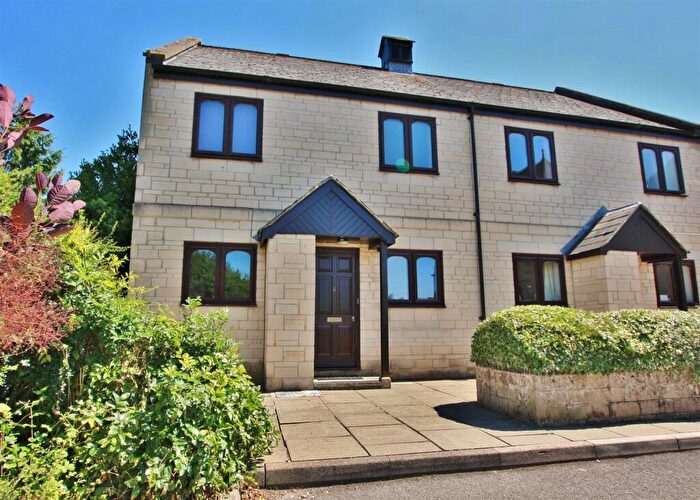
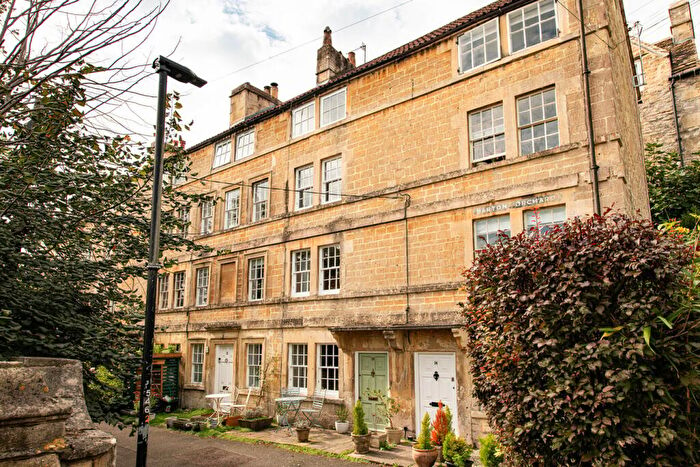
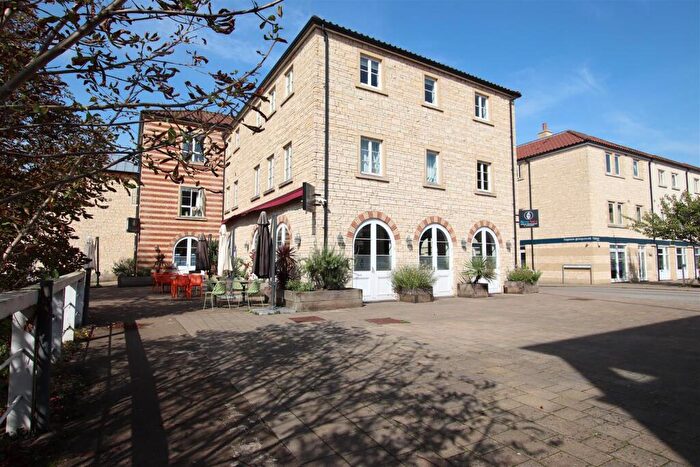
Houses for sale & to rent in Bradford-on-avon South, Bradford-on-avon
House Prices in Bradford-on-avon South
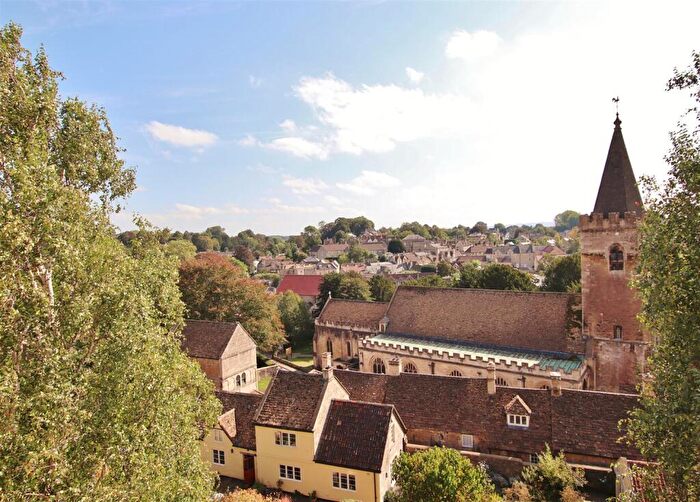
Properties in Bradford-on-avon South have an average house price of £424,065.00 and had 314 Property Transactions within the last 3 years¹.
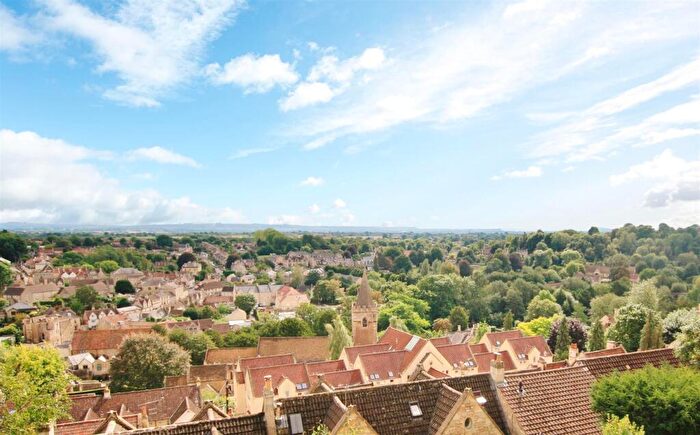
Bradford-on-avon South is an area in Bradford-on-avon, Wiltshire with 2,245 households², where the most expensive property was sold for £2,150,000.00.
Properties for sale in Bradford-on-avon South
Roads and Postcodes in Bradford-on-avon South
Navigate through our locations to find the location of your next house in Bradford-on-avon South, Bradford-on-avon for sale or to rent.
| Streets | Postcodes |
|---|---|
| Avon Close | BA15 1JJ |
| Avonfield Avenue | BA15 1JD BA15 1JE BA15 1JF |
| Baileys Barn | BA15 1BW BA15 1BX |
| Barn Piece | BA15 1XB |
| Barton Close | BA15 1EF |
| Barton Orchard | BA15 1LU |
| Bassetts Pasture | BA15 1XE |
| Beddoe Close | BA15 1UP |
| Belcombe Place | BA15 1NA |
| Belcombe Road | BA15 1LY BA15 1LZ |
| Bridge Street | BA15 1BY BA15 1BZ |
| Church Street | BA15 1HB BA15 1LN BA15 1LW BA15 1LR BA15 1LS |
| Conigre Hill | BA15 1NJ |
| Coppice Hill | BA15 1JT |
| Culver Road | BA15 1HY BA15 1HZ BA15 1JA |
| Deverell Close | BA15 1UX BA15 1UY BA15 1UZ BA15 1UU |
| Down Avon | BA15 1JH |
| Elmcross Business Park | BA15 2AY |
| Elms Cross Drive | BA15 2EH BA15 2EJ BA15 2EL |
| Fitzmaurice Close | BA15 1UE |
| Fitzmaurice Place | BA15 1EL |
| Folly Field | BA15 1XA |
| Frenchgrass | BA15 1DX |
| Frome Road | BA15 1LA BA15 1LB BA15 1LE BA15 2AD BA15 2EA BA15 2ED BA15 1FS BA15 1FT BA15 1HA BA15 2DZ |
| Greenland Mills | BA15 1BL |
| Greenland View | BA15 1JL |
| Grist Court | BA15 1FJ |
| Hobhouse Close | BA15 1UR |
| Horton Close | BA15 1UG |
| John Rennie Close | BA15 1UJ |
| Jones Hill | BA15 2EE BA15 2EF |
| Junction Road | BA15 1DY |
| Kennet Gardens | BA15 1LT |
| Kingston Avenue | BA15 1JB |
| Kingston Road | BA15 1AB BA15 1EJ BA15 1AA BA15 1ES |
| Kingston Square | BA15 1FH |
| Lamb Yard | BA15 1FG |
| Loddon Way | BA15 1HG |
| Longs Yard | BA15 1DH |
| Market Street | BA15 1LH BA15 1LL BA15 1LJ |
| Methuen Close | BA15 1UQ |
| Middle Rank | BA15 1NL |
| Midland Close | BA15 1DB |
| Mill Lane | BA15 1FB |
| Moulton Drive | BA15 1UF |
| Mythern Meadow | BA15 1HF |
| Newtown | BA15 1NE BA15 1NF BA15 1NG BA15 1NQ |
| Norden | BA15 1FL |
| Orchard Gardens | BA15 1BN |
| Palairet Close | BA15 1US BA15 1UT |
| Piplar Ground | BA15 1XF |
| Poulton | BA15 1EA |
| Poulton Lane | BA15 1EZ |
| Pound Lane | BA15 1LF |
| Regents Place | BA15 1ED |
| Rosemary Walk | BA15 1BP |
| Rowden Lane | BA15 2AB BA15 2AZ |
| Sandy Leaze | BA15 1LX |
| Silver Street | BA15 1JX BA15 1JY BA15 1JZ |
| Southleigh | BA15 2EQ |
| Southville Close | BA15 1HJ |
| Southville Road | BA15 1HP BA15 1HR BA15 1HS BA15 1HT BA15 1HU BA15 1HX BA15 1HW |
| Southway Road | BA15 1UL BA15 1UN BA15 1UW |
| Spencers Orchard | BA15 1TJ |
| St Aldhelm Road | BA15 1HL BA15 1HN |
| St Katherines Quay | BA15 1LG |
| St Laurence Road | BA15 1JG BA15 1JQ |
| St Margarets Court | BA15 1DR |
| St Margarets Hill | BA15 1DP |
| St Margarets Place | BA15 1DT |
| St Margarets Steps | BA15 1DS |
| St Margarets Street | BA15 1DA BA15 1DD BA15 1DE BA15 1DN BA15 1DW BA15 1DF |
| St Margarets Villas | BA15 1DU |
| Station Approach | BA15 1DQ BA15 1FQ |
| Stonefield Close | BA15 1ER |
| Sully | BA15 1FP |
| Taylors Row | BA15 1JP |
| The Maltings | BA15 2EP |
| The Paddock | BA15 1FN |
| The Ropewalk | BA15 1LQ |
| The Saw Mills | BA15 2DB |
| The Shambles | BA15 1JS |
| Tory | BA15 1NN |
| Tory Place | BA15 1NW |
| Treenwood Industrial Estate | BA15 2AA BA15 2AU |
| Trowbridge Road | BA15 1EE BA15 1EG BA15 1EN BA15 1EP BA15 1EQ BA15 1ET BA15 1EU BA15 1EW BA15 1EX BA15 1EY BA15 1UA BA15 1UB |
| Upper Regents Park | BA15 1EB |
| Victory Fields | BA15 1PD |
| Whiteheads Lane | BA15 1JU BA15 1GE |
| Widbrook | BA15 1UD BA15 1UH |
| Widbrook View | BA15 1HH BA15 1HQ |
| BA15 1EH BA15 1NB BA15 1NH BA15 1YS BA15 1ZY BA15 5BR BA15 5BT BA15 5BU BA15 5BW BA15 5DA BA15 5DD BA15 5DE BA15 5DF BA15 5DG |
Transport near Bradford-on-avon South
- FAQ
- Price Paid By Year
- Property Type Price
Frequently asked questions about Bradford-on-avon South
What is the average price for a property for sale in Bradford-on-avon South?
The average price for a property for sale in Bradford-on-avon South is £424,065. This amount is 12% lower than the average price in Bradford-on-avon. There are 867 property listings for sale in Bradford-on-avon South.
What streets have the most expensive properties for sale in Bradford-on-avon South?
The streets with the most expensive properties for sale in Bradford-on-avon South are Belcombe Place at an average of £1,136,333, St Margarets Steps at an average of £1,126,550 and Junction Road at an average of £782,500.
What streets have the most affordable properties for sale in Bradford-on-avon South?
The streets with the most affordable properties for sale in Bradford-on-avon South are The Maltings at an average of £167,166, Mythern Meadow at an average of £178,750 and Fitzmaurice Place at an average of £179,350.
Which train stations are available in or near Bradford-on-avon South?
Some of the train stations available in or near Bradford-on-avon South are Bradford-On-Avon, Avoncliff and Trowbridge.
Property Price Paid in Bradford-on-avon South by Year
The average sold property price by year was:
| Year | Average Sold Price | Price Change |
Sold Properties
|
|---|---|---|---|
| 2025 | £417,478 | -5% |
46 Properties |
| 2024 | £436,553 | 16% |
93 Properties |
| 2023 | £364,771 | -26% |
75 Properties |
| 2022 | £459,952 | 18% |
100 Properties |
| 2021 | £377,540 | -4% |
150 Properties |
| 2020 | £391,963 | 11% |
101 Properties |
| 2019 | £348,017 | 8% |
92 Properties |
| 2018 | £319,057 | -12% |
89 Properties |
| 2017 | £356,482 | 13% |
96 Properties |
| 2016 | £311,645 | -4% |
140 Properties |
| 2015 | £322,820 | 11% |
115 Properties |
| 2014 | £286,352 | 1% |
151 Properties |
| 2013 | £284,867 | 5% |
123 Properties |
| 2012 | £269,208 | 9% |
94 Properties |
| 2011 | £244,187 | -4% |
136 Properties |
| 2010 | £254,307 | 1% |
110 Properties |
| 2009 | £252,610 | 5% |
81 Properties |
| 2008 | £240,938 | -5% |
74 Properties |
| 2007 | £253,591 | 6% |
129 Properties |
| 2006 | £237,687 | 6% |
142 Properties |
| 2005 | £223,570 | 5% |
87 Properties |
| 2004 | £212,311 | 14% |
101 Properties |
| 2003 | £182,706 | 11% |
122 Properties |
| 2002 | £162,555 | -3% |
160 Properties |
| 2001 | £167,639 | 16% |
121 Properties |
| 2000 | £140,362 | 13% |
134 Properties |
| 1999 | £122,340 | 10% |
167 Properties |
| 1998 | £109,511 | 31% |
154 Properties |
| 1997 | £75,744 | 4% |
130 Properties |
| 1996 | £72,440 | 0,3% |
108 Properties |
| 1995 | £72,195 | - |
76 Properties |
Property Price per Property Type in Bradford-on-avon South
Here you can find historic sold price data in order to help with your property search.
The average Property Paid Price for specific property types in the last three years are:
| Property Type | Average Sold Price | Sold Properties |
|---|---|---|
| Flat | £227,348.00 | 89 Flats |
| Semi Detached House | £426,830.00 | 61 Semi Detached Houses |
| Detached House | £654,328.00 | 54 Detached Houses |
| Terraced House | £468,656.00 | 110 Terraced Houses |

