
Houses for sale & to rent in SP3 5NU, Fovant And Chalke Valley, Salisbury
House Prices in SP3 5NU, Fovant And Chalke Valley
Properties in SP3 5NU have no sales history available within the last 3 years. SP3 5NU is a postcode in Fovant And Chalke Valley, an area in Salisbury, Wiltshire, with 6 households².
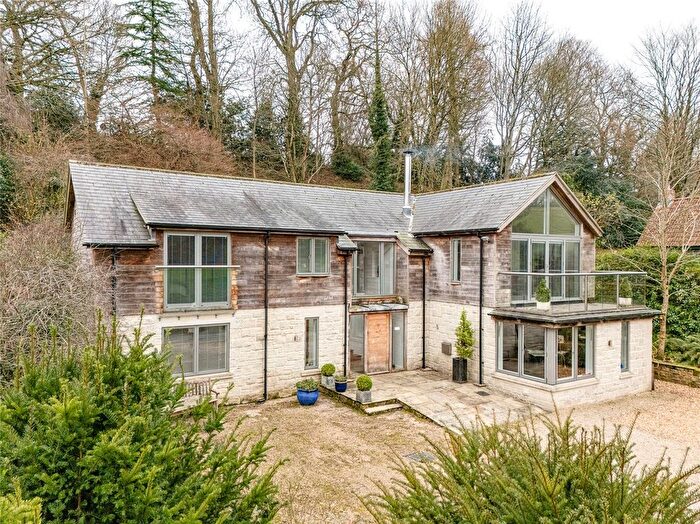
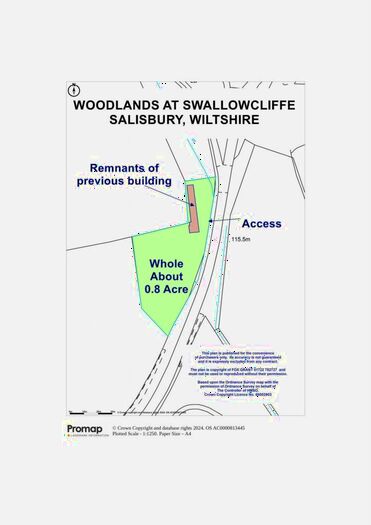
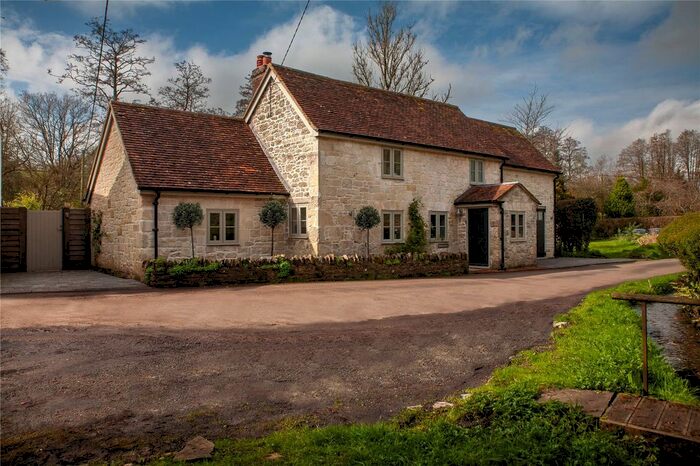
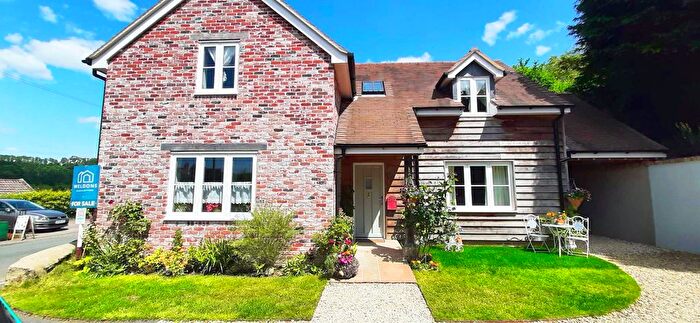
Previously listed properties near SP3 5NU
![]()
If you are looking to sell your house, let it out, or receive a property valuation, an expert can help you.
Click the button below to get started.

Price Paid in SP3 5NU, Fovant And Chalke Valley
MYRTLE HILL SP3 5NU, Fovant And Chalke Valley Salisbury
Property MYRTLE HILL has been sold 2 times. The last time it was sold was in 17/06/2013 and the sold price was £410,000.00.
This detached house, sold as a freehold on 17/06/2013, is a 120 sqm detached bungalow with an EPC rating of D.
| Date | Price | Property Type | Tenure | Classification |
|---|---|---|---|---|
| 17/06/2013 | £410,000.00 | Detached House | freehold | Established Building |
| 23/07/2009 | £370,000.00 | Detached House | freehold | Established Building |
THE BARN SP3 5NU, Fovant And Chalke Valley Salisbury
Property THE BARN has been sold 1 time. The last time it was sold was in 16/02/2001 and the sold price was £345,000.00.
This is a Detached House which was sold as a freehold in 16/02/2001
| Date | Price | Property Type | Tenure | Classification |
|---|---|---|---|---|
| 16/02/2001 | £345,000.00 | Detached House | freehold | Established Building |
PARSONAGE FARM SP3 5NU, Fovant And Chalke Valley Salisbury
Property PARSONAGE FARM has been sold 1 time. The last time it was sold was in 31/07/2000 and the sold price was £498,000.00.
This detached house, sold as a freehold on 31/07/2000, is a 298 sqm detached house with an EPC rating of D.
| Date | Price | Property Type | Tenure | Classification |
|---|---|---|---|---|
| 31/07/2000 | £498,000.00 | Detached House | freehold | New Build |
Transport near SP3 5NU

House price paid reports for SP3 5NU
Click on the buttons below to see price paid reports by year or property price:
- Price Paid By Year
Property Price Paid in SP3 5NU by Year
The average sold property price by year was:
| Year | Average Sold Price | Price Change |
Sold Properties
|
|---|---|---|---|
| 2013 | £410,000 | 10% |
1 Property |
| 2009 | £370,000 | 7% |
1 Property |
| 2001 | £345,000 | -44% |
1 Property |
| 2000 | £498,000 | - |
1 Property |