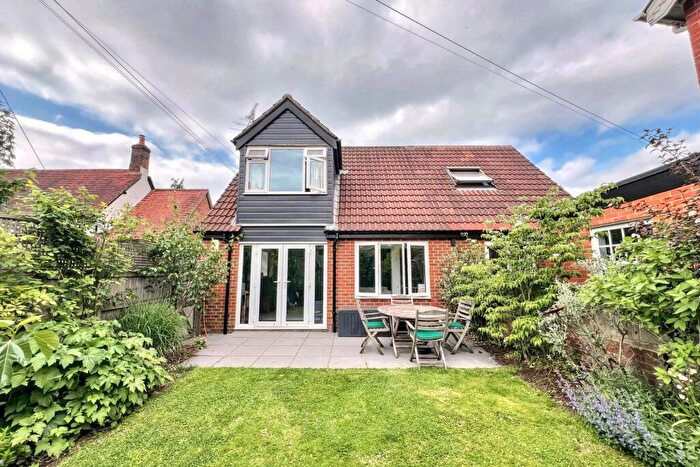
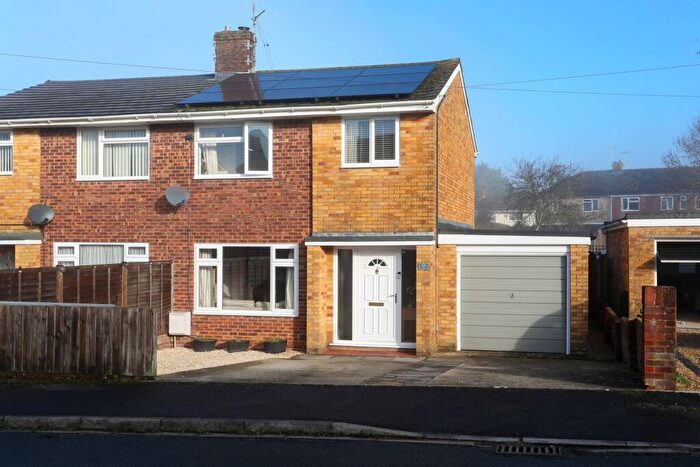
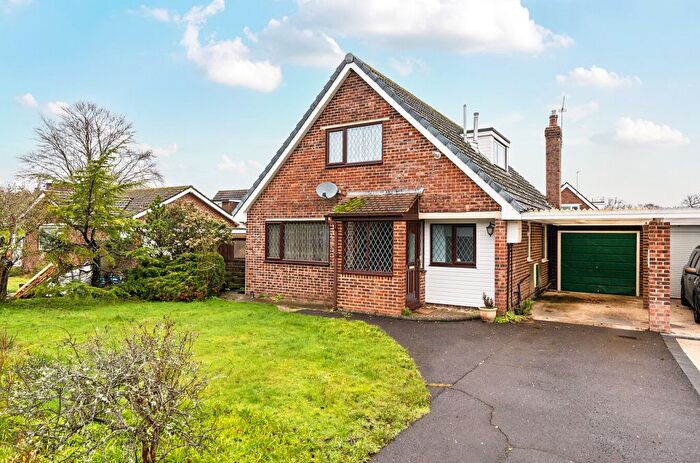
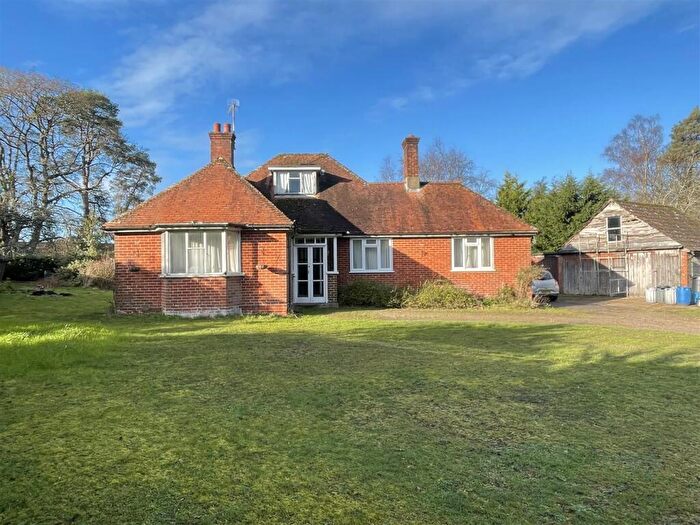
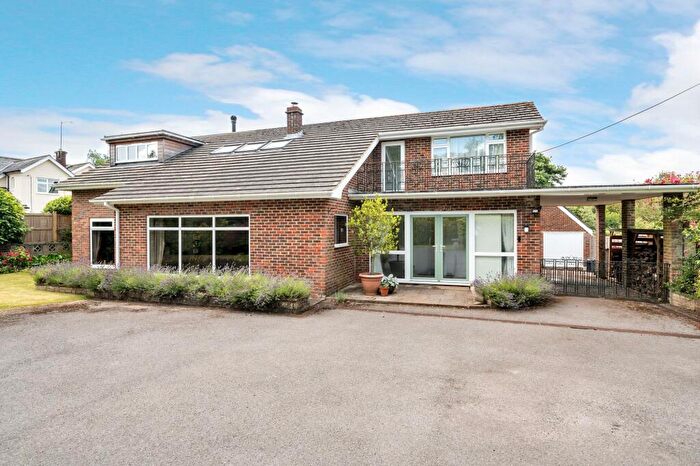
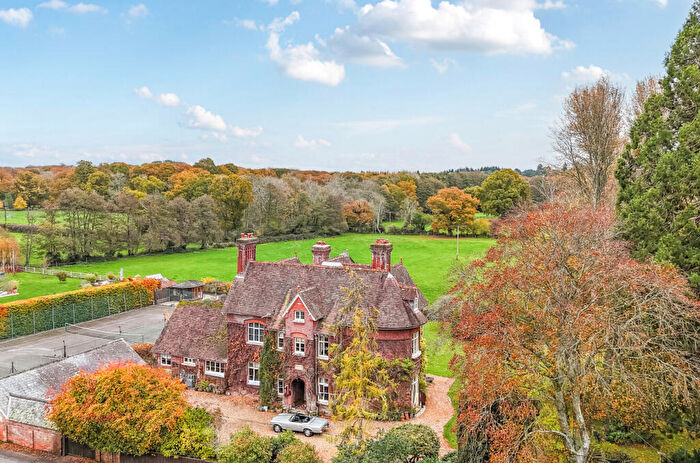
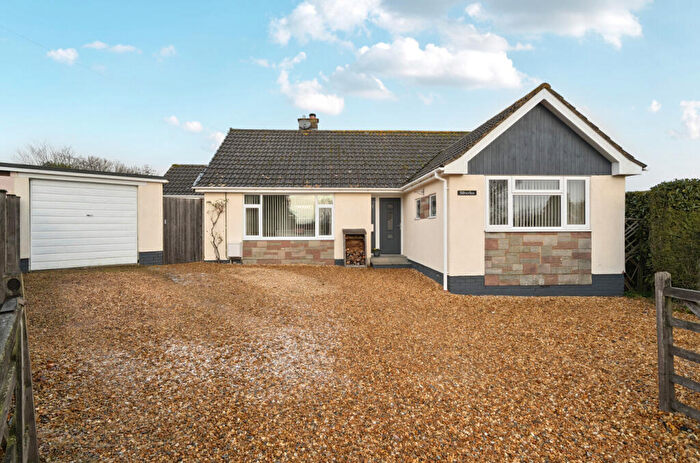
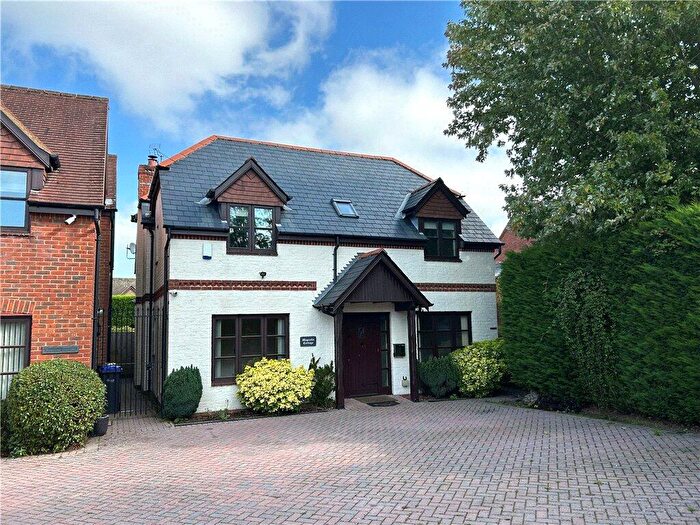
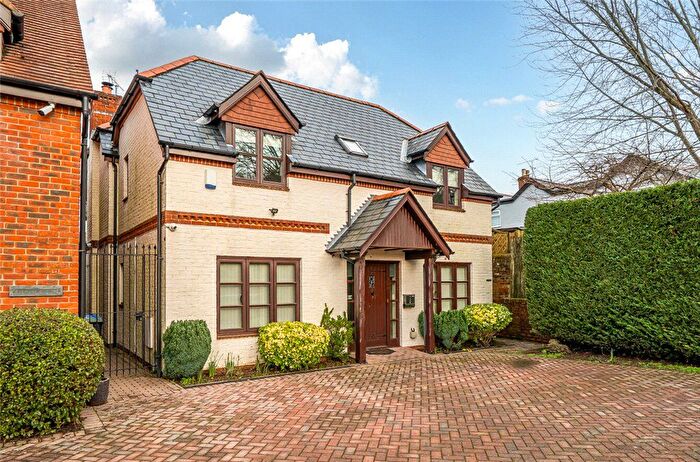
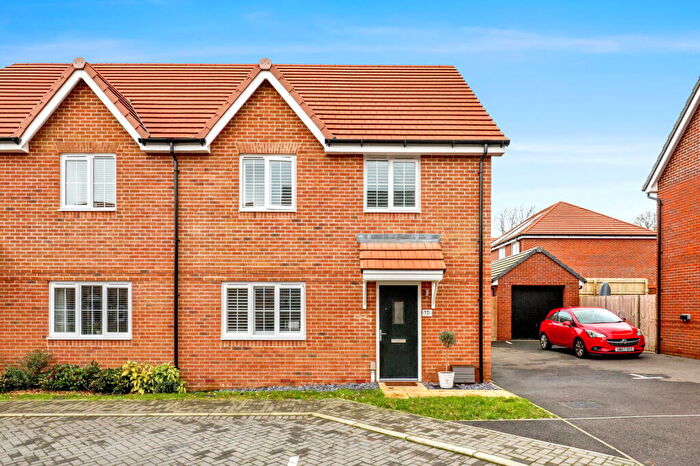
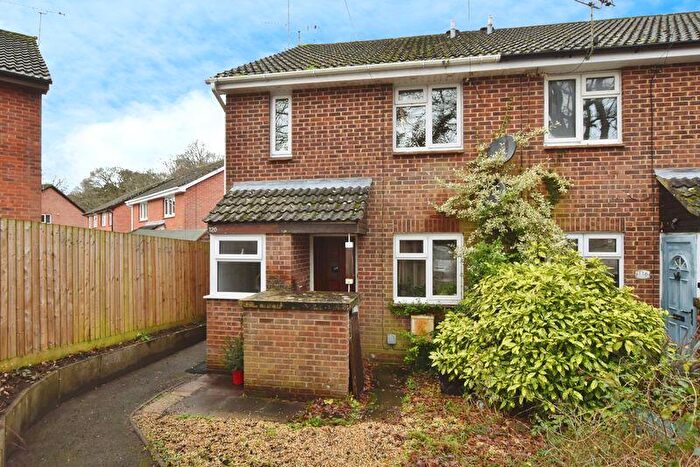
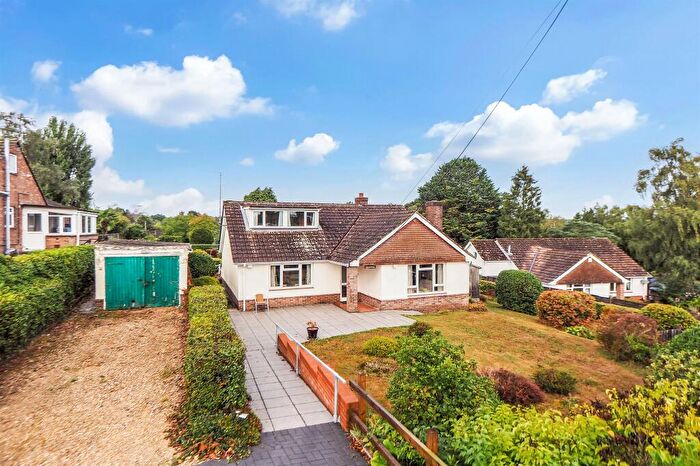
Houses for sale & to rent in Redlynch And Landford, Salisbury
House Prices in Redlynch And Landford
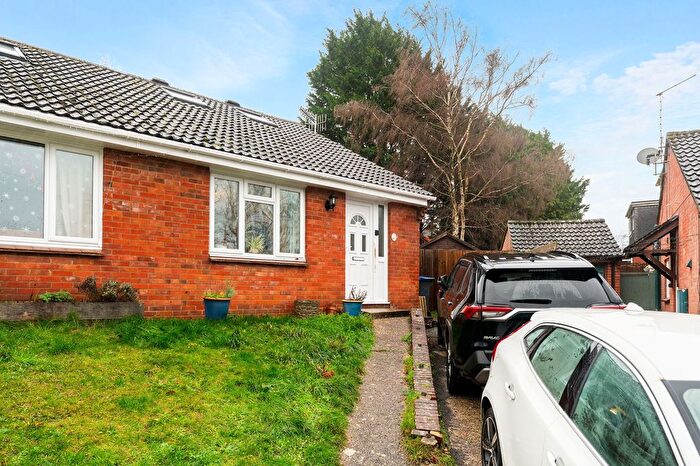
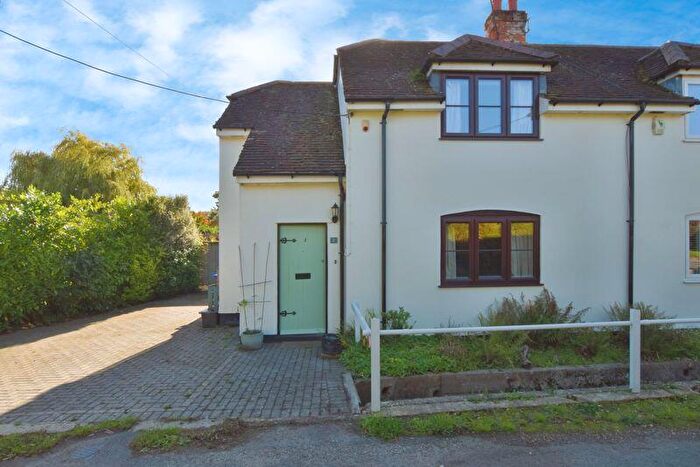
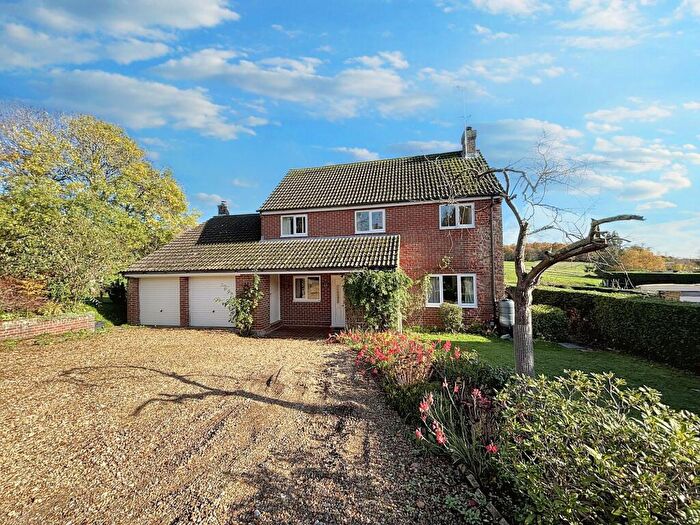
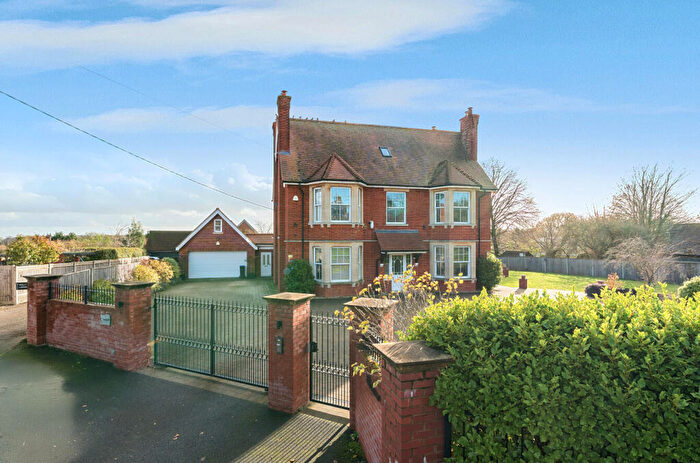
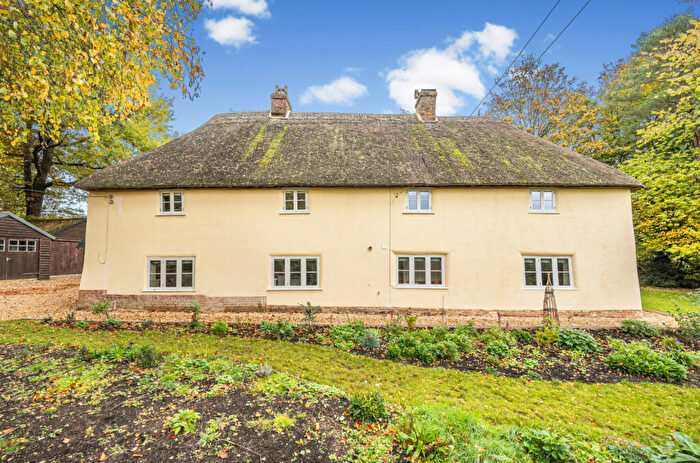
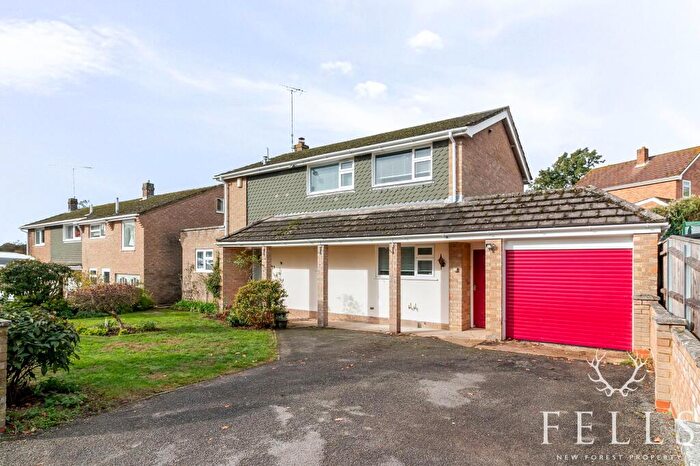
Properties in Redlynch And Landford have an average house price of £632,942.00 and had 166 Property Transactions within the last 3 years¹.
Redlynch And Landford is an area in Salisbury, Wiltshire with 1,847 households², where the most expensive property was sold for £1,500,000.00.
Properties for sale in Redlynch And Landford
Roads and Postcodes in Redlynch And Landford
Navigate through our locations to find the location of your next house in Redlynch And Landford, Salisbury for sale or to rent.
| Streets | Postcodes |
|---|---|
| Appletree Close | SP5 2JG |
| Appletree Road | SP5 2BL SP5 2JH SP5 2JQ |
| Beech Grange | SP5 2AL SP5 2AN |
| Bennett Close | SP5 2HX |
| Besomers Drove | SP5 2PN |
| Black Lane | SP5 2PH SP5 2PQ |
| Bohemia | SP5 2PT |
| Bowers Hill | SP5 2HD |
| Brookside | SP5 2AD |
| Broomhill Terrace | SP5 2AR |
| Castle Woods | SP5 2PY |
| Chalks Close | SP5 2JY |
| Chapel Lane | SP5 2DA SP5 2HN SP5 2HW |
| Church Hill | SP5 2HS SP5 2PJ SP5 2PL |
| Church Walk | SP5 2PF |
| Coles Lane | SP5 2DZ |
| Collingwood Close | SP5 2EE |
| Coundley Court | SP5 2DL |
| Dairy Close | SP5 2NP |
| Downton Hill | SP5 2BQ SP5 2JF |
| Elmfield Close | SP5 2BF |
| Forders Close | SP5 2QB |
| Forest Edge | SP5 3LN |
| Forest Road | SP5 2BN SP5 2BP SP5 2BW SP5 2BS SP5 2PU |
| Foundary Road | SP5 2JW |
| Giles Lane | SP5 2BG |
| Glebe Lane | SP5 2AB |
| Goggs Lane | SP5 2HP SP5 2NY |
| Greens Meade | SP5 2NL |
| Grove Lane | SP5 2NR SP5 2NU |
| Hamptworth Road | SP5 2DT SP5 2EA |
| Harthill Drove | SP5 2HR |
| Herbert Road | SP5 2LF |
| Highfield Lane | SP5 2NG |
| Hillcroft | SP5 2LX |
| Kiln Lane | SP5 2HT |
| Kingford Close | SP5 2NQ |
| Lane End Cottages | SP5 2AQ |
| Langford Lane | SP5 2JS |
| Latchmore Drove | SP5 2BJ |
| Little Woodfalls Drive | SP5 2NN |
| Lode Hill | SP5 3PP |
| Lodge Drove | SP5 2NH |
| Loosehanger | SP5 2PS |
| Lyburn Road | SP5 2DD SP5 2DP SP5 2DR SP5 2DE SP5 2DF SP5 2DG SP5 2DN |
| Lyndhurst Road | SP5 2AF SP5 2AG SP5 2AJ SP5 2AP SP5 2AS SP5 2AE SP5 2AH |
| Manor View | SP5 2ET |
| Meadow View | SP5 2PD |
| Mitchells Close | SP5 2LG |
| Morgans Corner | SP5 2HE |
| Morgans Rise Road | SP5 2JL |
| Morgans Vale Road | SP5 2HU SP5 2HY SP5 2HA |
| Muddyford Road | SP5 2JP |
| New Road | SP5 2AZ |
| Nomansland | SP5 2WG |
| North Common Lane | SP5 2EJ SP5 2EL |
| North Lane | SP5 2BU |
| Oakleigh Drive | SP5 2AT |
| Orchard Road | SP5 2JA SP5 2JB |
| Paccombe | SP5 2JJ |
| Park Row | SP5 2HB |
| Partridge Hill | SP5 2BB |
| Pear Tree Drive | SP5 2AY |
| Pine Close | SP5 2AW |
| Pine View Close | SP5 2LR |
| Pound Hill | SP5 2AA |
| Primrose Lane | SP5 2NA SP5 2NB |
| Princes Close | SP5 2HQ |
| Princes Hill | SP5 2HF SP5 2HG |
| Prospect Place | SP5 2NT |
| Quavey Road | SP5 2HH SP5 2HJ SP5 2HL |
| Sandy Lane | SP5 2NS |
| School Road | SP5 2BX SP5 2BY SP5 2PW |
| Sherfield English Road | SP5 2BD |
| Slab Lane | SP5 2ND SP5 2NE SP5 2NF |
| South Lane | SP5 2BZ |
| Southampton Road | SP5 2BE SP5 2ED SP5 2EQ SP5 2EF SP5 2EG SP5 2EN |
| Springfield Crescent | SP5 2LS |
| St Birinus Road | SP5 2LE |
| St Marys Close | SP5 2PP |
| Stock Lane | SP5 2ER SP5 2EW |
| Telegraph | SP5 2PX |
| The Barracks | SP5 2JD |
| The Close | SP5 2JN |
| The Drove | SP5 2HZ SP5 2LL |
| The Green | SP5 2JR |
| The Ridge | SP5 2LD SP5 2LH SP5 2LN SP5 2LQ SP5 2LW SP5 2NJ |
| The Row | SP5 2JT |
| Timberley Lane | SP5 2PA |
| Tinneys Close | SP5 2LU |
| Vale Road | SP5 2LT SP5 2LY |
| Valley Close | SP5 2LZ |
| Vicarage Park | SP5 2JZ |
| Vicarage Road | SP5 2PE SP5 2PG |
| White Cottages | SP5 2JE |
| Whitehorn Drive | SP5 2AX |
| Whiteshoot | SP5 2PR |
| Whiteshoot Hill | SP5 2NW |
| York Drove | SP5 2BT |
| SP5 2AU SP5 2DU SP5 2DW SP5 2ES SP5 2EU SP5 2QP SP5 2BH SP5 2DS SP5 2DX SP5 2DY SP5 2EB SP5 2EH SP5 2JU SP5 2LJ SP5 2NX SP5 2PB SP5 2WU |
Transport near Redlynch And Landford
-
Dean Station
-
Mottisfont and Dunbridge Station
-
Salisbury Station
-
Romsey Station
-
Ashurst New Forest Station
-
Totton Station
- FAQ
- Price Paid By Year
- Property Type Price
Frequently asked questions about Redlynch And Landford
What is the average price for a property for sale in Redlynch And Landford?
The average price for a property for sale in Redlynch And Landford is £632,942. This amount is 65% higher than the average price in Salisbury. There are 908 property listings for sale in Redlynch And Landford.
What streets have the most expensive properties for sale in Redlynch And Landford?
The streets with the most expensive properties for sale in Redlynch And Landford are North Common Lane at an average of £1,300,000, New Road at an average of £1,033,333 and South Lane at an average of £947,500.
What streets have the most affordable properties for sale in Redlynch And Landford?
The streets with the most affordable properties for sale in Redlynch And Landford are Chapel Lane at an average of £320,333, Vale Road at an average of £370,000 and Glebe Lane at an average of £380,000.
Which train stations are available in or near Redlynch And Landford?
Some of the train stations available in or near Redlynch And Landford are Dean, Mottisfont and Dunbridge and Salisbury.
Property Price Paid in Redlynch And Landford by Year
The average sold property price by year was:
| Year | Average Sold Price | Price Change |
Sold Properties
|
|---|---|---|---|
| 2025 | £610,400 | 3% |
30 Properties |
| 2024 | £589,729 | -15% |
37 Properties |
| 2023 | £680,800 | 6% |
41 Properties |
| 2022 | £638,339 | 10% |
58 Properties |
| 2021 | £573,940 | -6% |
63 Properties |
| 2020 | £605,644 | 15% |
50 Properties |
| 2019 | £516,875 | 2% |
60 Properties |
| 2018 | £506,275 | -1% |
55 Properties |
| 2017 | £508,852 | 2% |
49 Properties |
| 2016 | £499,103 | 9% |
62 Properties |
| 2015 | £452,442 | 4% |
64 Properties |
| 2014 | £433,496 | 17% |
78 Properties |
| 2013 | £359,196 | -13% |
63 Properties |
| 2012 | £406,878 | 21% |
40 Properties |
| 2011 | £322,897 | -5% |
49 Properties |
| 2010 | £338,466 | -8% |
51 Properties |
| 2009 | £363,937 | -16% |
50 Properties |
| 2008 | £420,462 | -2% |
41 Properties |
| 2007 | £427,775 | 14% |
68 Properties |
| 2006 | £369,928 | 3% |
66 Properties |
| 2005 | £360,657 | 8% |
73 Properties |
| 2004 | £333,152 | 9% |
52 Properties |
| 2003 | £304,629 | 8% |
62 Properties |
| 2002 | £281,098 | 14% |
60 Properties |
| 2001 | £240,502 | -2% |
78 Properties |
| 2000 | £244,598 | 26% |
79 Properties |
| 1999 | £180,579 | 20% |
66 Properties |
| 1998 | £145,362 | 3% |
81 Properties |
| 1997 | £140,899 | 19% |
85 Properties |
| 1996 | £114,221 | 13% |
82 Properties |
| 1995 | £99,376 | - |
63 Properties |
Property Price per Property Type in Redlynch And Landford
Here you can find historic sold price data in order to help with your property search.
The average Property Paid Price for specific property types in the last three years are:
| Property Type | Average Sold Price | Sold Properties |
|---|---|---|
| Semi Detached House | £473,000.00 | 15 Semi Detached Houses |
| Detached House | £661,637.00 | 145 Detached Houses |
| Terraced House | £339,333.00 | 6 Terraced Houses |

