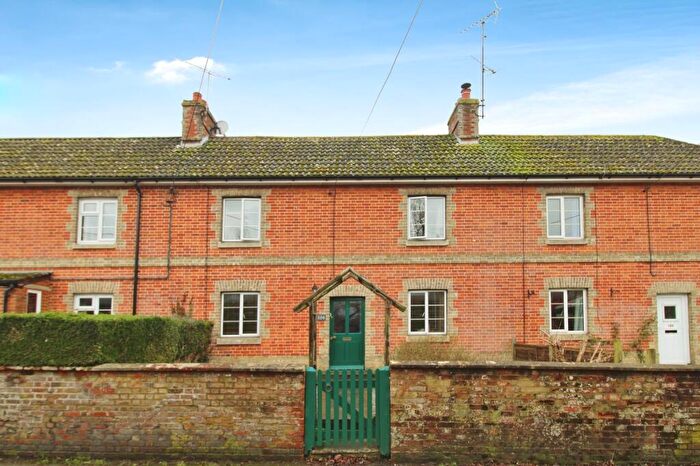
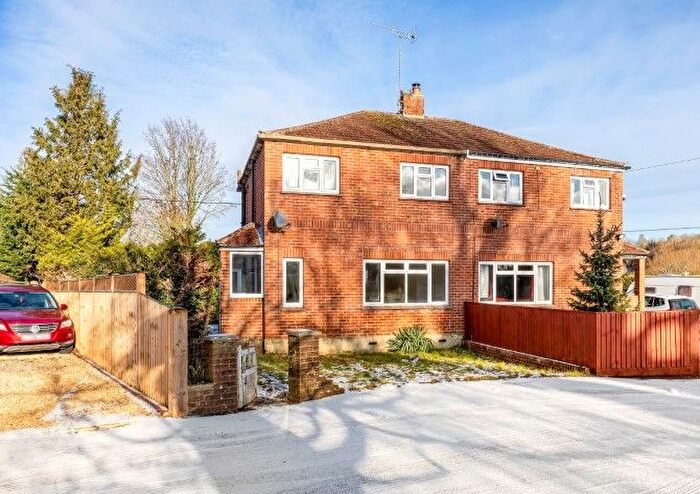
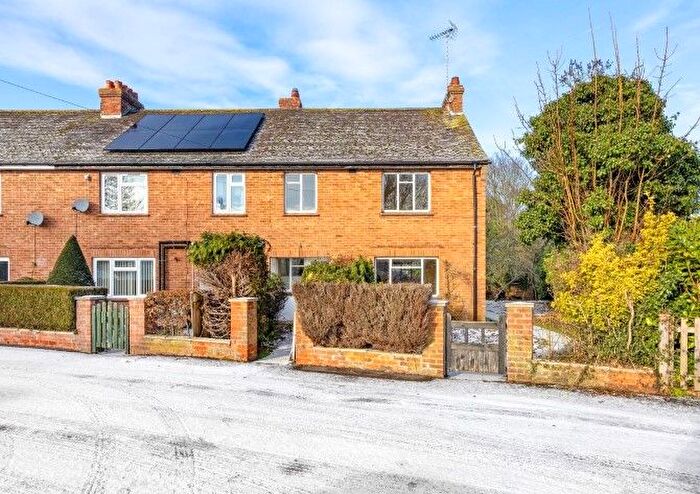
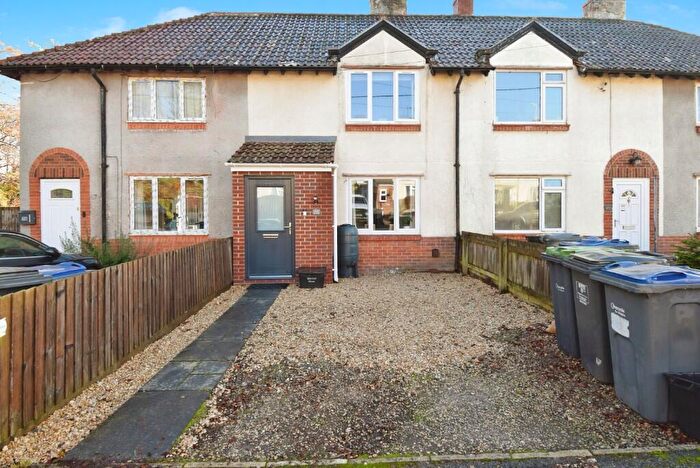
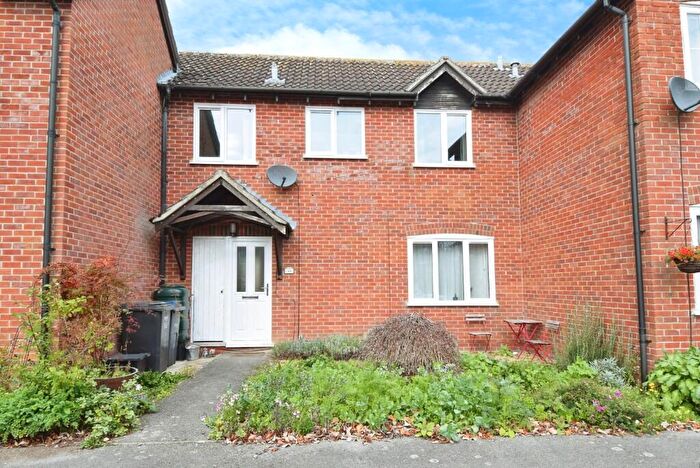
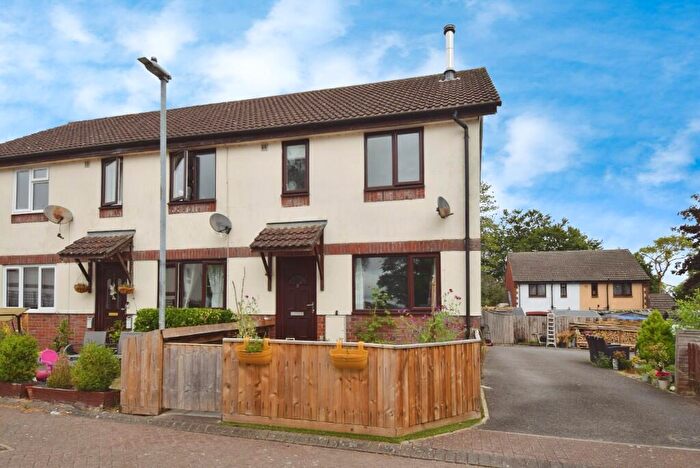
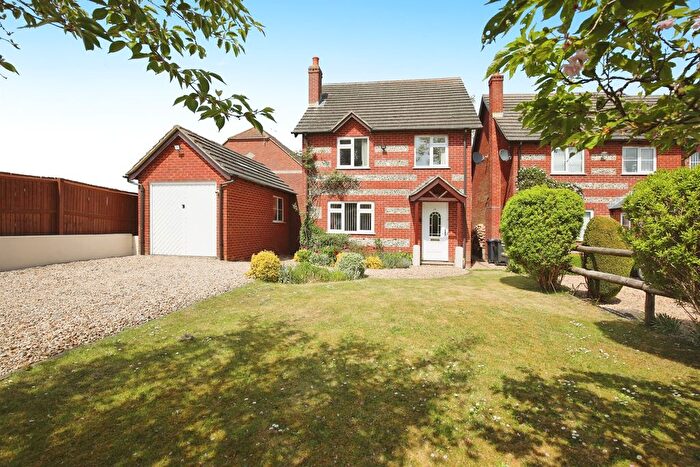
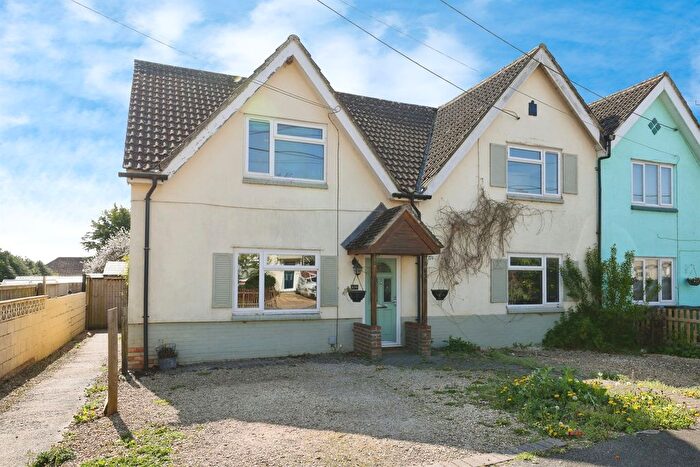
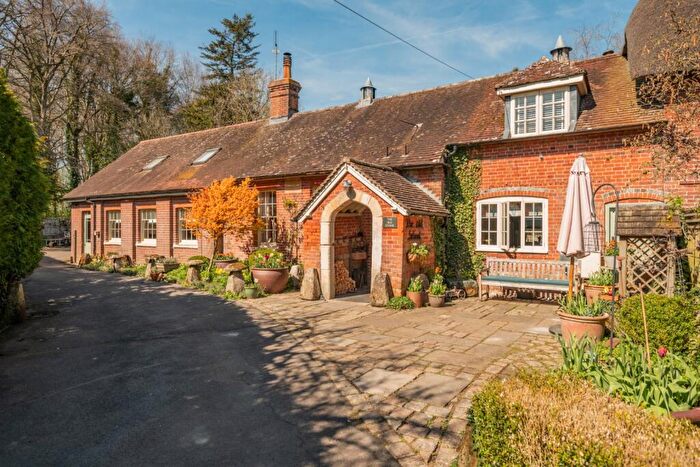
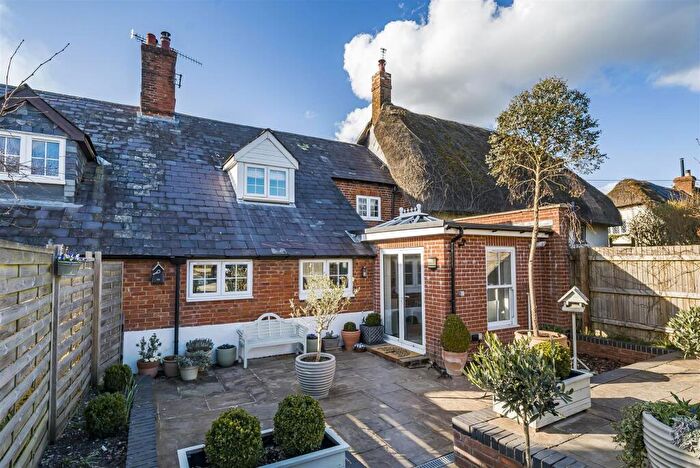
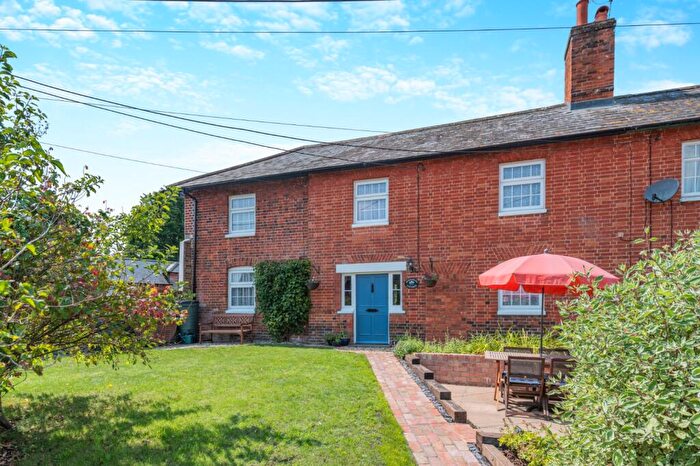
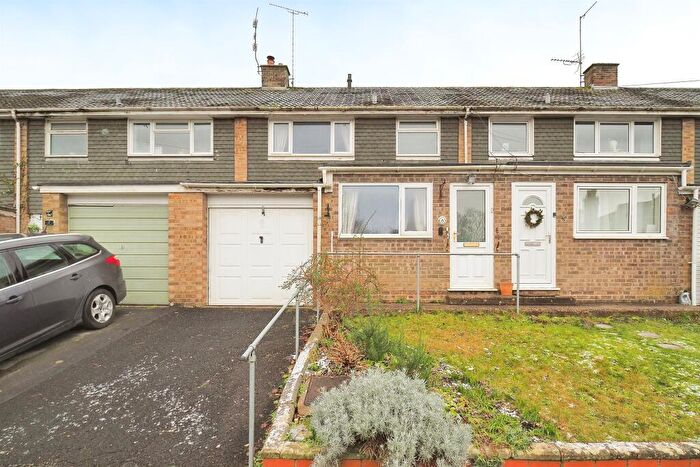
Houses for sale & to rent in The Collingbournes And Netheravon, Salisbury
House Prices in The Collingbournes And Netheravon
Properties in The Collingbournes And Netheravon have an average house price of £401,690.00 and had 48 Property Transactions within the last 3 years¹.
The Collingbournes And Netheravon is an area in Salisbury, Wiltshire with 581 households², where the most expensive property was sold for £1,965,000.00.
Properties for sale in The Collingbournes And Netheravon
Previously listed properties in The Collingbournes And Netheravon
Roads and Postcodes in The Collingbournes And Netheravon
Navigate through our locations to find the location of your next house in The Collingbournes And Netheravon, Salisbury for sale or to rent.
| Streets | Postcodes |
|---|---|
| Avon Park | SP4 9RA |
| Avon Villas | SP4 9PN |
| Berry Close | SP4 9QH |
| Chestnut Rise | SP4 9PR |
| Coronation Villa | SP4 9PW |
| Court Farm Close | SP4 9QX |
| Court Farm Road | SP4 9QU |
| Downs View Close | SP4 9PS |
| Downside Road | SP4 9QY |
| Everleigh Road | SP4 9PT |
| Hales Road | SP4 9QE |
| Harefield Crescent | SP4 9RN |
| High Street | SP4 9PJ SP4 9PQ SP4 9QP SP4 9QW SP4 9RT |
| Horseshoe Villas | SP4 9QT |
| Jacks Lodge | SP4 9RJ |
| Kennel Row | SP4 9RH |
| Kings Hill | SP4 9PL |
| Lower Road | SP4 9SY |
| Lower Street | SP4 9PU |
| Manor Cottages | SP4 9PZ |
| Meadow View | SP4 9PX |
| Mill Road | SP4 9QB |
| Old Post Office Lane | SP4 9RD |
| Old School Close | SP4 9QJ |
| Pigott Close | SP4 9QF |
| Queensway | SP4 9QQ |
| Salisbury Road | SP4 9ED SP4 9EE SP4 9QL SP4 9QZ SP4 9RQ |
| Stones Villas | SP4 9PG |
| The Pound | SP4 9PP |
| Thorne Road | SP4 9QG |
| Vicarage Gardens | SP4 9RW |
| Wains Way | SP4 9RU |
| Walnut Close | SP4 9QS |
| Wexland Avenue | SP4 9RE |
| Whitmarsh Close | SP4 9QD |
| Worsdell Close | SP4 9BF |
| SP4 9PY SP4 9QA SP4 9RB SP4 9RF SP4 9RG SP4 9SQ |
Transport near The Collingbournes And Netheravon
- FAQ
- Price Paid By Year
- Property Type Price
Frequently asked questions about The Collingbournes And Netheravon
What is the average price for a property for sale in The Collingbournes And Netheravon?
The average price for a property for sale in The Collingbournes And Netheravon is £401,690. This amount is 5% higher than the average price in Salisbury. There are 89 property listings for sale in The Collingbournes And Netheravon.
What streets have the most expensive properties for sale in The Collingbournes And Netheravon?
The streets with the most expensive properties for sale in The Collingbournes And Netheravon are Court Farm Road at an average of £685,750, Wexland Avenue at an average of £513,771 and High Street at an average of £456,428.
What streets have the most affordable properties for sale in The Collingbournes And Netheravon?
The streets with the most affordable properties for sale in The Collingbournes And Netheravon are Court Farm Close at an average of £125,000, Thorne Road at an average of £208,333 and Hales Road at an average of £237,500.
Which train stations are available in or near The Collingbournes And Netheravon?
Some of the train stations available in or near The Collingbournes And Netheravon are Pewsey, Grateley and Salisbury.
Property Price Paid in The Collingbournes And Netheravon by Year
The average sold property price by year was:
| Year | Average Sold Price | Price Change |
Sold Properties
|
|---|---|---|---|
| 2025 | £502,303 | 31% |
13 Properties |
| 2024 | £345,609 | -12% |
19 Properties |
| 2023 | £386,537 | 14% |
16 Properties |
| 2022 | £331,150 | -14% |
20 Properties |
| 2021 | £377,277 | 9% |
24 Properties |
| 2020 | £344,133 | 7% |
15 Properties |
| 2019 | £319,575 | 13% |
26 Properties |
| 2018 | £277,785 | 3% |
16 Properties |
| 2017 | £270,267 | 1% |
29 Properties |
| 2016 | £268,565 | 11% |
19 Properties |
| 2015 | £239,473 | -11% |
19 Properties |
| 2014 | £264,628 | 20% |
21 Properties |
| 2013 | £212,206 | 5% |
15 Properties |
| 2012 | £201,317 | 27% |
14 Properties |
| 2011 | £147,721 | -56% |
9 Properties |
| 2010 | £229,941 | 15% |
18 Properties |
| 2009 | £195,266 | -56% |
12 Properties |
| 2008 | £303,722 | 15% |
9 Properties |
| 2007 | £258,481 | 17% |
38 Properties |
| 2006 | £215,059 | -10% |
38 Properties |
| 2005 | £236,990 | -0,5% |
23 Properties |
| 2004 | £238,077 | 29% |
22 Properties |
| 2003 | £168,112 | -12% |
28 Properties |
| 2002 | £187,758 | 36% |
35 Properties |
| 2001 | £120,353 | -31% |
28 Properties |
| 2000 | £157,152 | 26% |
20 Properties |
| 1999 | £116,534 | 29% |
41 Properties |
| 1998 | £82,449 | 21% |
31 Properties |
| 1997 | £65,383 | -6% |
45 Properties |
| 1996 | £69,210 | 21% |
38 Properties |
| 1995 | £54,364 | - |
26 Properties |
Property Price per Property Type in The Collingbournes And Netheravon
Here you can find historic sold price data in order to help with your property search.
The average Property Paid Price for specific property types in the last three years are:
| Property Type | Average Sold Price | Sold Properties |
|---|---|---|
| Semi Detached House | £423,469.00 | 13 Semi Detached Houses |
| Detached House | £479,708.00 | 17 Detached Houses |
| Terraced House | £305,058.00 | 17 Terraced Houses |
| Flat | £435,000.00 | 1 Flat |

