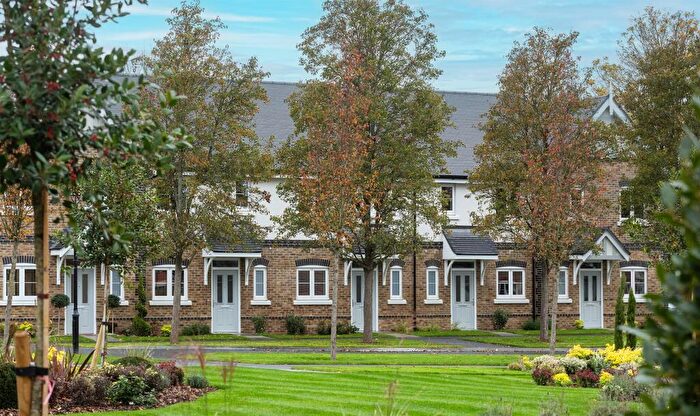
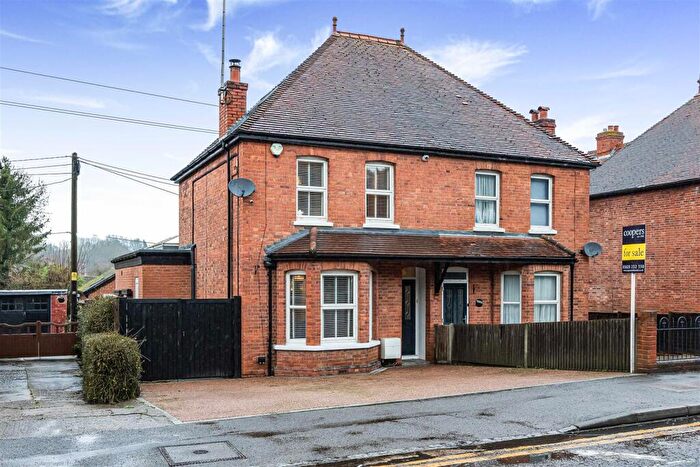
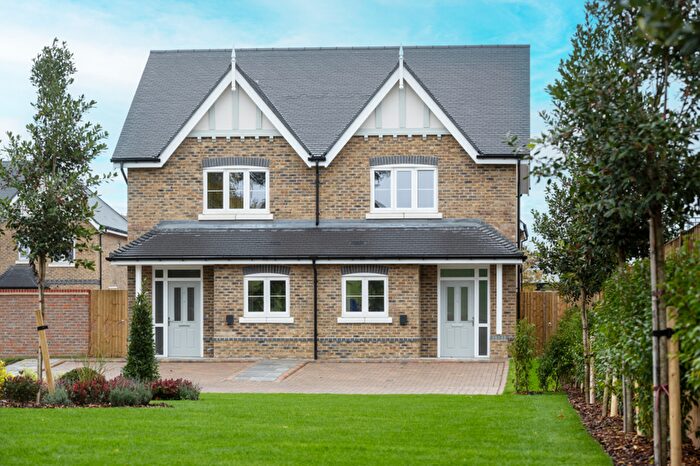
Houses for sale & to rent in Hurley And Walthams, Reading
House Prices in Hurley And Walthams
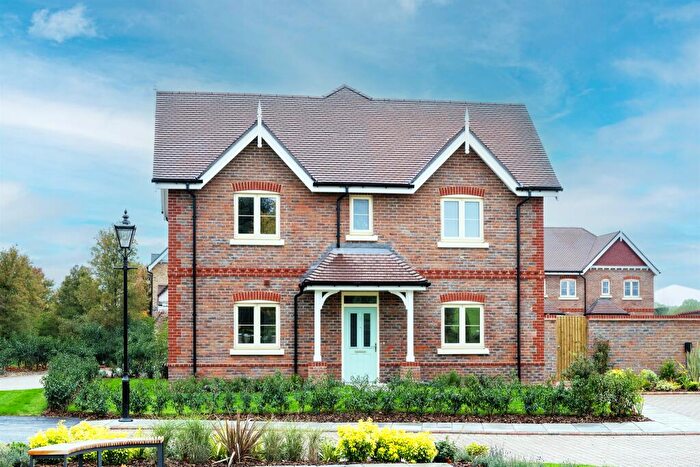
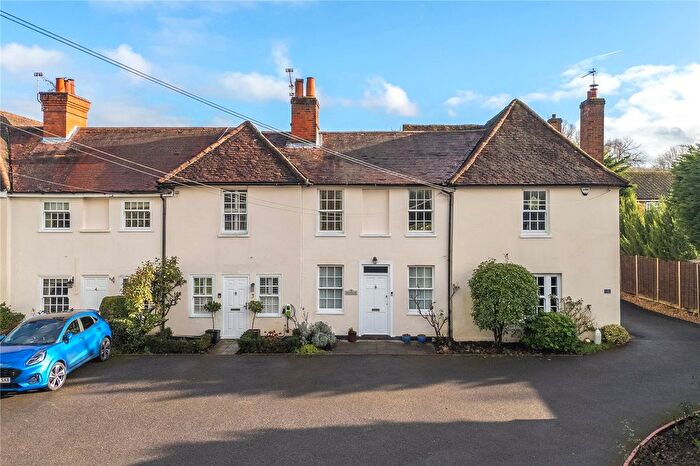
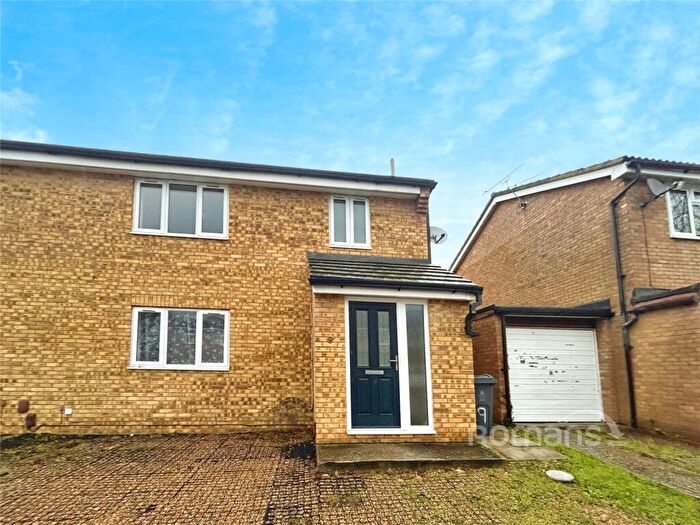
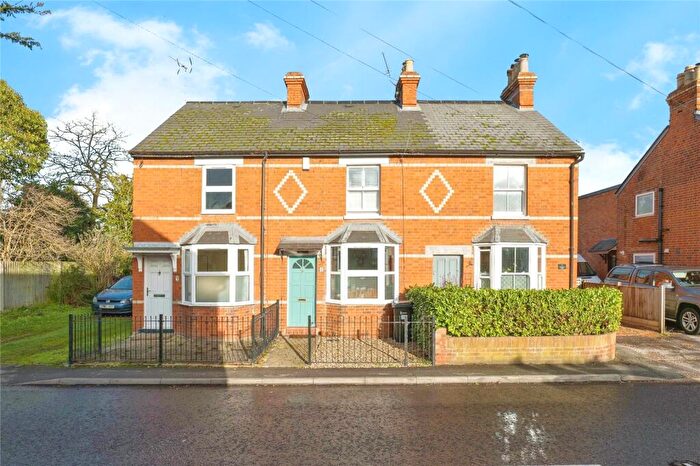
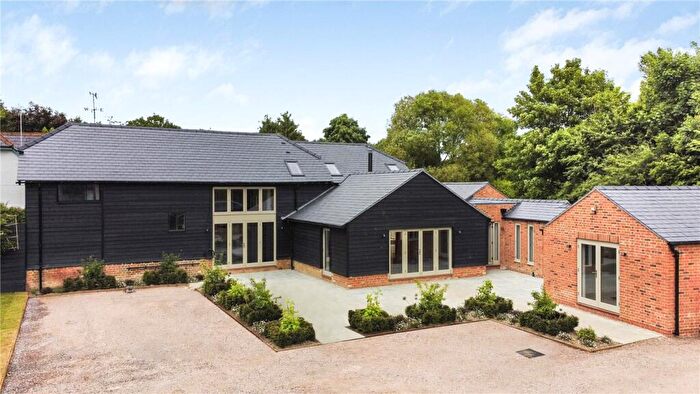
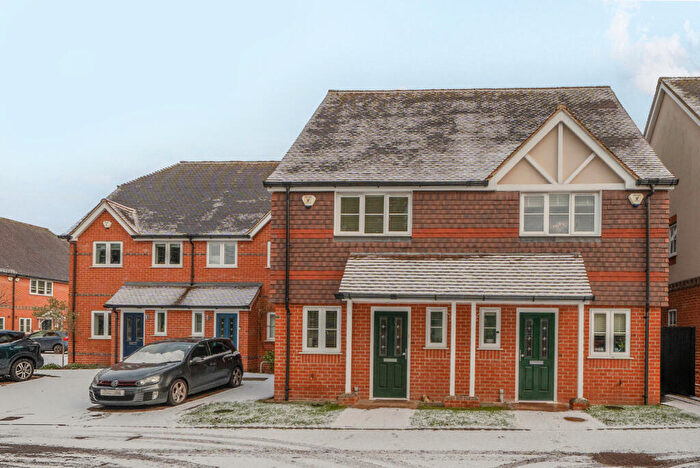
Properties in Hurley And Walthams have an average house price of £977,320.00 and had 54 Property Transactions within the last 3 years¹.
Hurley And Walthams is an area in Reading, Windsor and Maidenhead with 682 households², where the most expensive property was sold for £2,480,000.00.
Properties for sale in Hurley And Walthams
Roads and Postcodes in Hurley And Walthams
Navigate through our locations to find the location of your next house in Hurley And Walthams, Reading for sale or to rent.
| Streets | Postcodes |
|---|---|
| Adkins Road | RG10 0LJ |
| Ashley Hill Place | RG10 8NL |
| Baileys Lane | RG10 0NS |
| Bath Road | RG10 9UR |
| Bears Copse Cottages | RG10 0NP |
| Beenhams Heath | RG10 0QE |
| Binfield Road | RG10 0QJ RG10 0QL |
| Broadmoor Road | RG10 0HY |
| Brook Lane | RG10 0NX |
| Choseley Close | RG10 9YU |
| Choseley Cottages | RG10 9YP |
| Choseley Road | RG10 9YS RG10 9YT |
| Cockpole Green | RG10 8NT |
| Darvills Lane | RG10 0PF |
| Dene Cottages | RG10 0JU |
| Downfield Road | RG10 0HU |
| Halls Lane | RG10 0JB RG10 0JD RG10 0JG |
| Hillside Cottages | RG10 9YG |
| Hodgedale Lane | RG10 8QY |
| Hungerford Lane | RG10 0NY RG10 0PB RG10 0PH |
| Knowl Hill Common | RG10 9YD RG10 9YE |
| Lutmans Haven | RG10 9YN RG10 9YR |
| Manor Drive | RG10 0PX |
| Melba Cottages | RG10 0LG |
| Milley Bridge | RG10 0LA RG10 0LD RG10 0LE RG10 0LF |
| Milley Road | RG10 0JP RG10 0JR RG10 0JT RG10 0JY |
| Mire Lane West End | RG10 0NJ |
| Orchard Cottages | RG10 0JX |
| Paddock View | RG10 0RF |
| Parkers Cottages | RG10 0JS |
| Rose Lane | RG10 8QN |
| School Road | RG10 0NU |
| Shurlock Road | RG10 0HN RG10 0HR RG10 0HT |
| Shurlock Row | RG10 0PL |
| Sill Bridge Lane | RG10 0NT |
| Spring Cottages | RG10 9YH |
| Star Lane | RG10 9XY |
| The Straight Mile | RG10 0QN RG10 0QP |
| The Street | RG10 0JH RG10 0JJ RG10 0JL RG10 0JN RG10 0PR RG10 0PS RG10 0PT RG10 0PU |
| The Terrace | RG10 9XB |
| Twyford Road | RG10 0HE RG10 0HG RG10 0HL |
| Upper Culham Road | RG10 8NJ |
| Warren Row | RG10 8QL RG10 8QS RG10 8QT RG10 8QX |
| West End | RG10 0NL RG10 0NN RG10 0NR |
| Wicks Lane | RG10 0PJ |
| Woods Grove | RG10 0GH |
| Woodside Cottages | RG10 8QU |
Transport near Hurley And Walthams
- FAQ
- Price Paid By Year
- Property Type Price
Frequently asked questions about Hurley And Walthams
What is the average price for a property for sale in Hurley And Walthams?
The average price for a property for sale in Hurley And Walthams is £977,320. This amount is 0.19% higher than the average price in Reading. There are 1,598 property listings for sale in Hurley And Walthams.
What streets have the most expensive properties for sale in Hurley And Walthams?
The streets with the most expensive properties for sale in Hurley And Walthams are West End at an average of £1,770,000, Knowl Hill Common at an average of £1,614,780 and Woods Grove at an average of £1,500,000.
What streets have the most affordable properties for sale in Hurley And Walthams?
The streets with the most affordable properties for sale in Hurley And Walthams are Orchard Cottages at an average of £420,000, The Terrace at an average of £425,600 and Choseley Close at an average of £435,000.
Which train stations are available in or near Hurley And Walthams?
Some of the train stations available in or near Hurley And Walthams are Twyford and Wargrave.
Property Price Paid in Hurley And Walthams by Year
The average sold property price by year was:
| Year | Average Sold Price | Price Change |
Sold Properties
|
|---|---|---|---|
| 2025 | £871,750 | -19% |
8 Properties |
| 2024 | £1,038,133 | 10% |
28 Properties |
| 2023 | £929,641 | -6% |
18 Properties |
| 2022 | £985,648 | -1% |
20 Properties |
| 2021 | £992,780 | -23% |
26 Properties |
| 2020 | £1,225,300 | 57% |
22 Properties |
| 2019 | £532,133 | -58% |
15 Properties |
| 2018 | £842,888 | 20% |
18 Properties |
| 2017 | £676,301 | -20% |
19 Properties |
| 2016 | £813,434 | 15% |
23 Properties |
| 2015 | £691,911 | -19% |
27 Properties |
| 2014 | £821,656 | 20% |
16 Properties |
| 2013 | £658,372 | 0,4% |
20 Properties |
| 2012 | £656,027 | -18% |
18 Properties |
| 2011 | £776,470 | 17% |
17 Properties |
| 2010 | £648,250 | 6% |
14 Properties |
| 2009 | £608,407 | 11% |
11 Properties |
| 2008 | £541,291 | -53% |
12 Properties |
| 2007 | £830,161 | 40% |
21 Properties |
| 2006 | £499,395 | 4% |
31 Properties |
| 2005 | £479,512 | -18% |
32 Properties |
| 2004 | £564,000 | 29% |
28 Properties |
| 2003 | £398,348 | 2% |
33 Properties |
| 2002 | £390,325 | 4% |
32 Properties |
| 2001 | £375,045 | -28% |
41 Properties |
| 2000 | £480,818 | 44% |
25 Properties |
| 1999 | £267,631 | 4% |
41 Properties |
| 1998 | £256,176 | 18% |
31 Properties |
| 1997 | £210,446 | 19% |
38 Properties |
| 1996 | £171,253 | -11% |
25 Properties |
| 1995 | £190,869 | - |
18 Properties |
Property Price per Property Type in Hurley And Walthams
Here you can find historic sold price data in order to help with your property search.
The average Property Paid Price for specific property types in the last three years are:
| Property Type | Average Sold Price | Sold Properties |
|---|---|---|
| Semi Detached House | £634,233.00 | 15 Semi Detached Houses |
| Detached House | £1,224,685.00 | 33 Detached Houses |
| Terraced House | £474,525.00 | 6 Terraced Houses |

