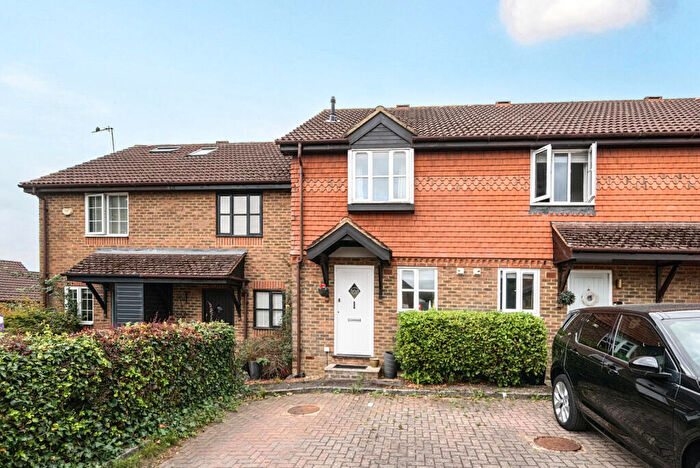
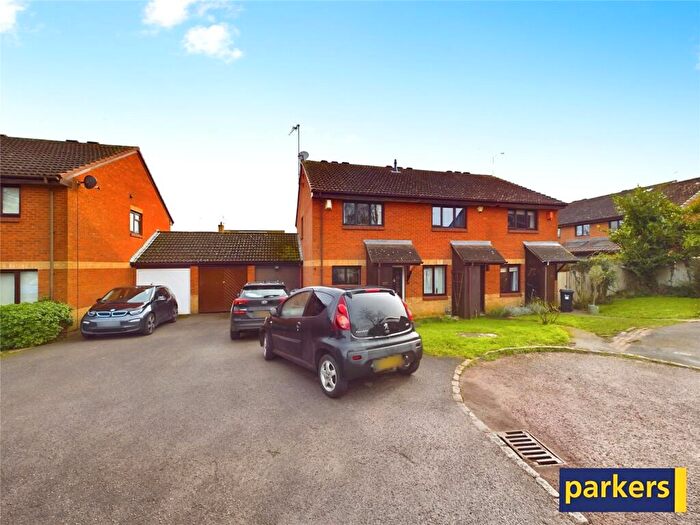
Houses for sale & to rent in Twyford, Reading
House Prices in Twyford
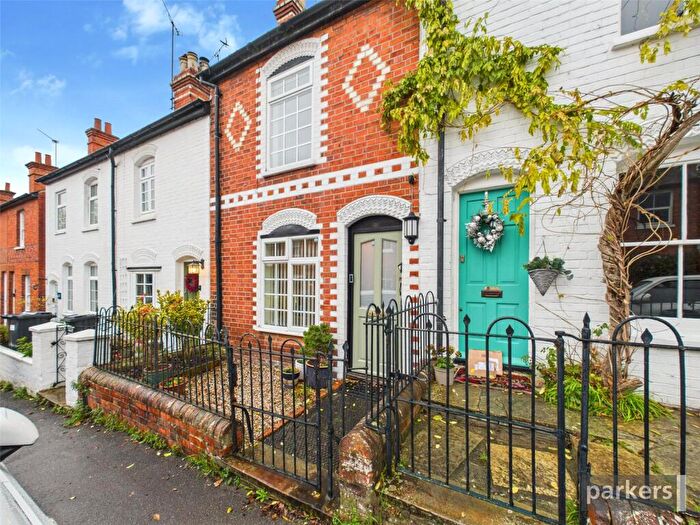
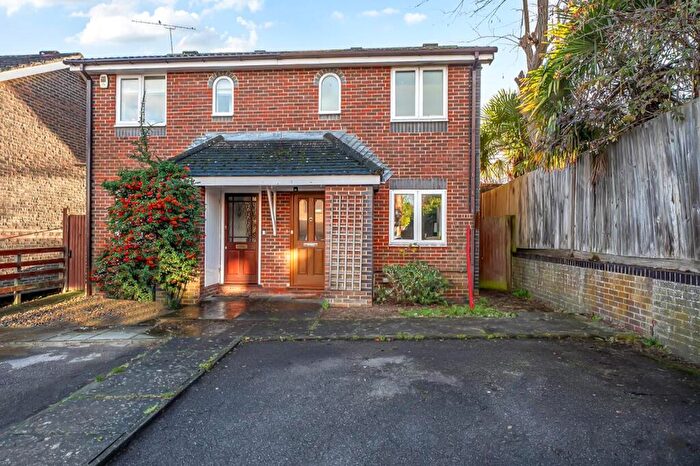
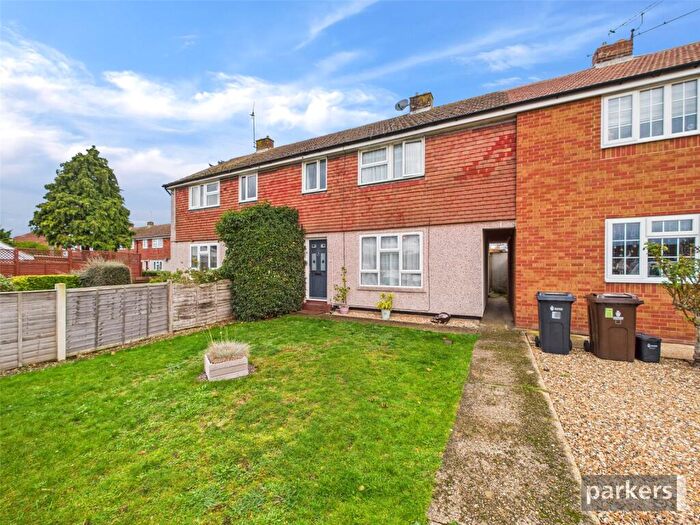
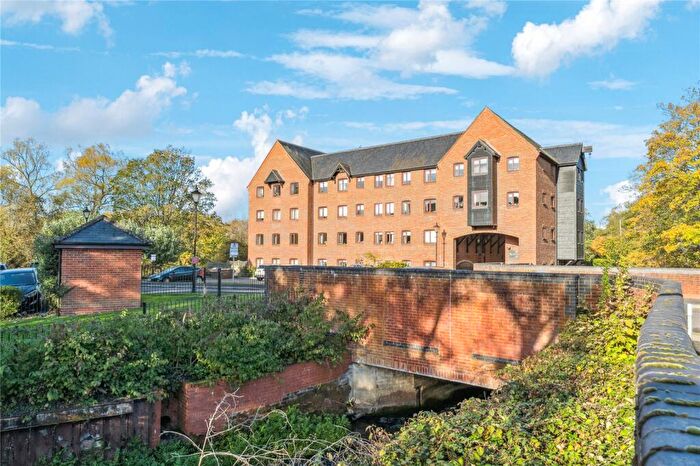
Properties in Twyford have an average house price of £527,707.00 and had 279 Property Transactions within the last 3 years¹.
Twyford is an area in Reading, Wokingham with 2,534 households², where the most expensive property was sold for £1,695,000.00.
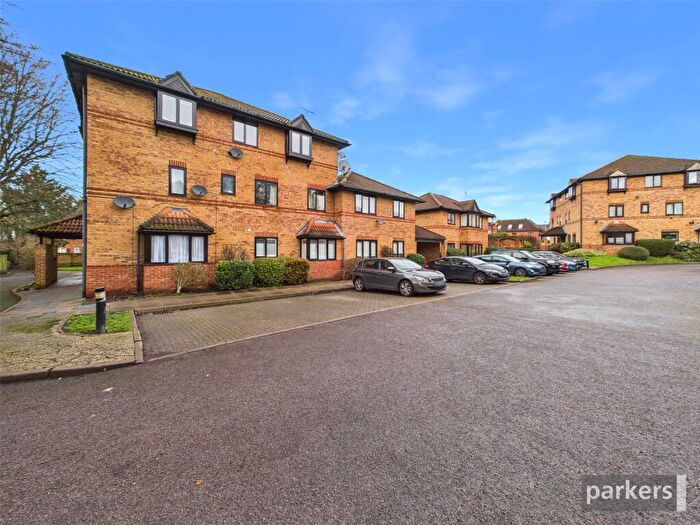
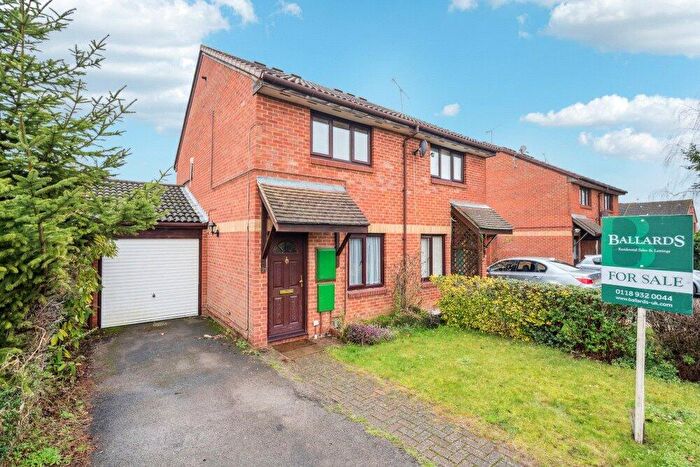
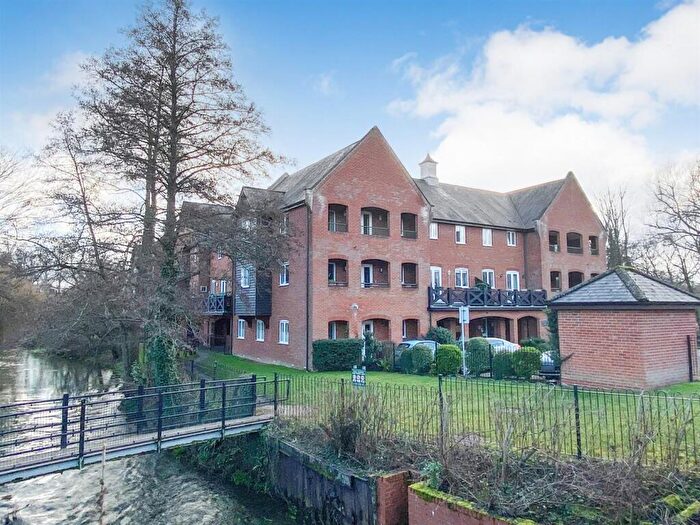
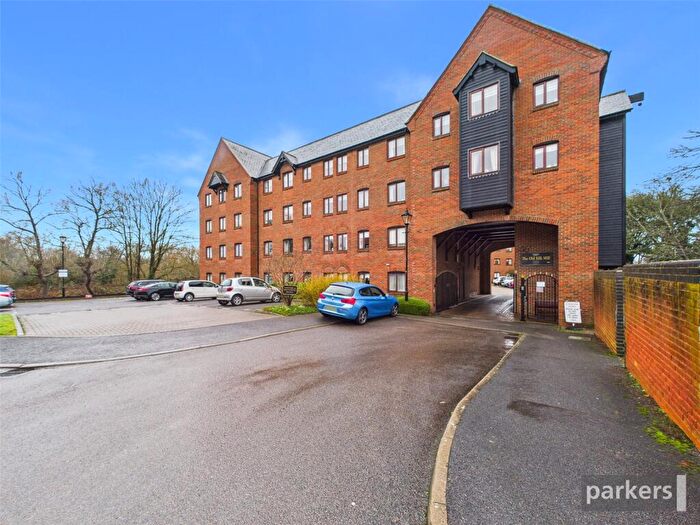
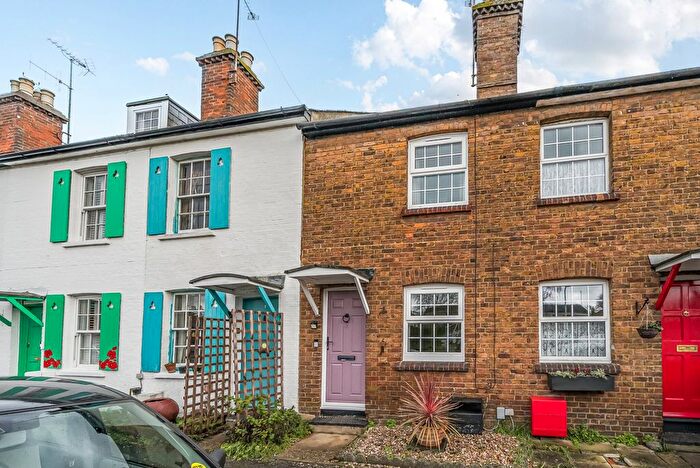
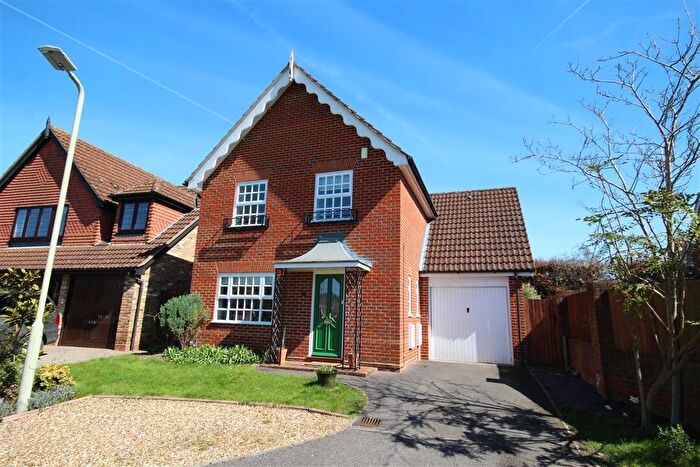
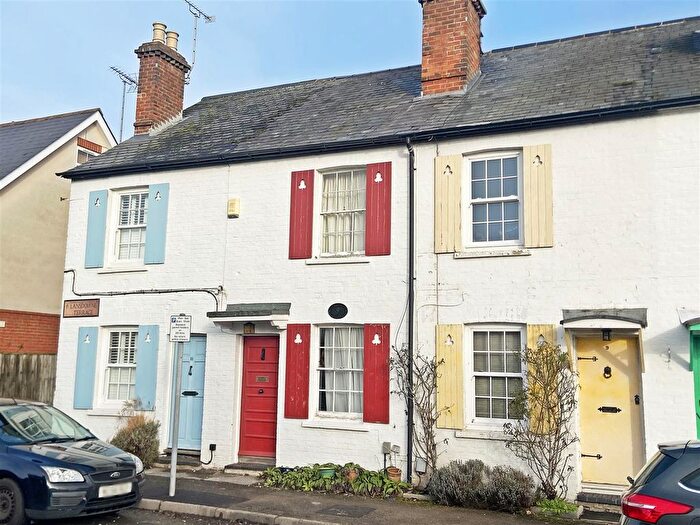
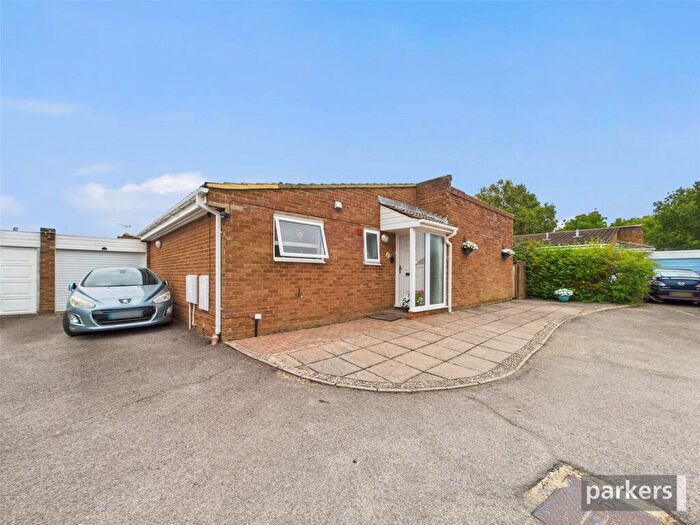
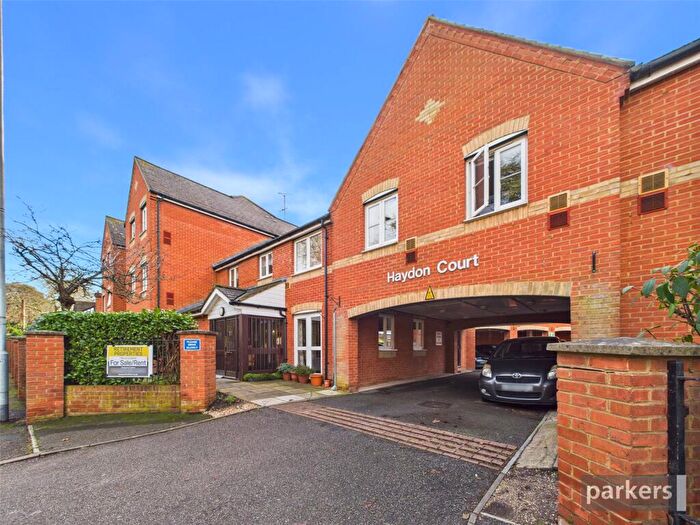
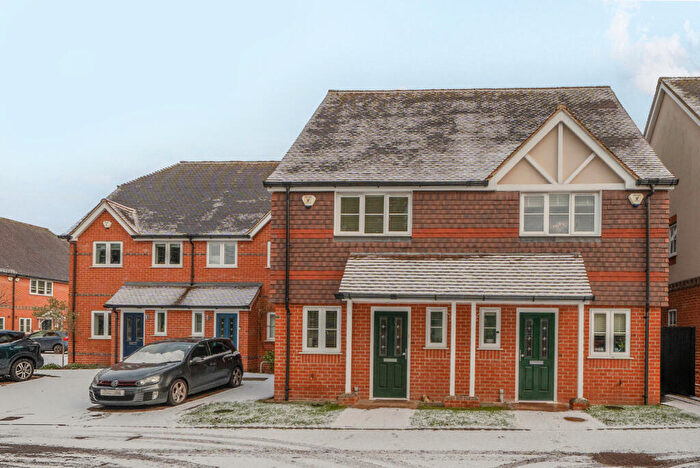
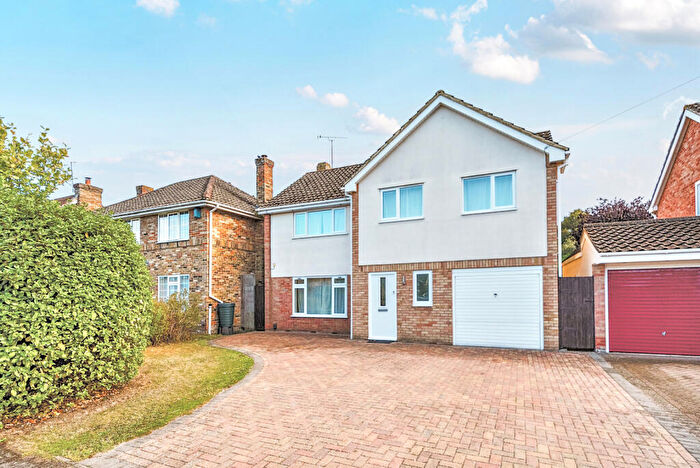
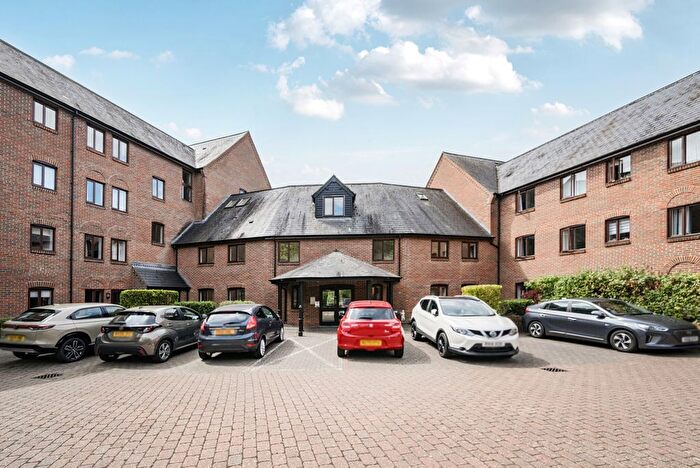
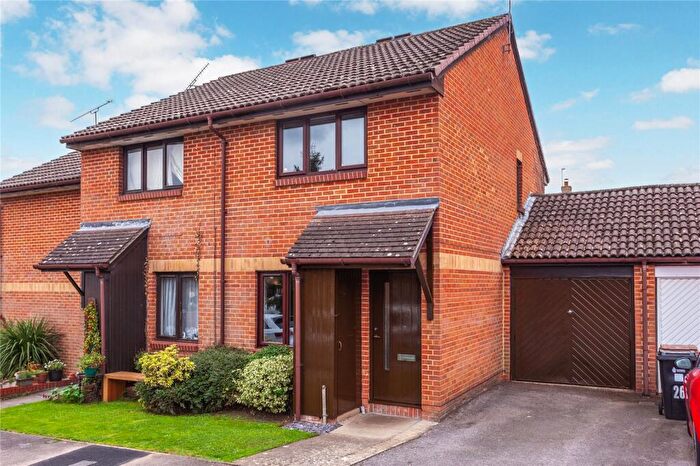
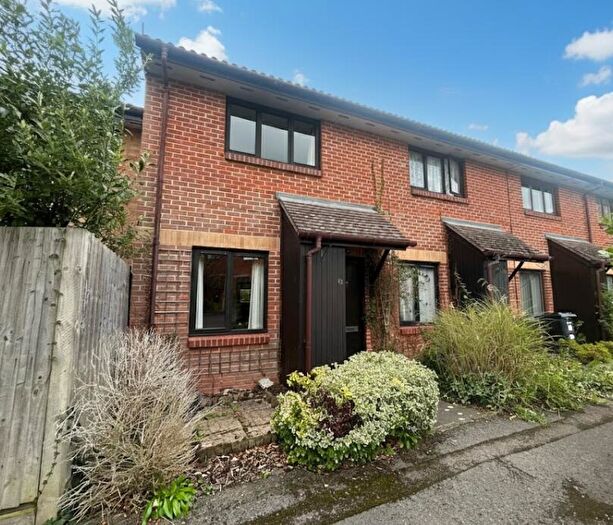
Properties for sale in Twyford
Roads and Postcodes in Twyford
Navigate through our locations to find the location of your next house in Twyford, Reading for sale or to rent.
| Streets | Postcodes |
|---|---|
| Amberley Drive | RG10 9BX RG10 9BY RG10 9BZ |
| Anchorite Close | RG10 9HY |
| Arnside Close | RG10 9BS |
| Badger Drive | RG10 9PZ |
| Bath Road | RG10 9AL |
| Bolwell Close | RG10 0LN |
| Bridge Park | RG10 9BB |
| Broad Hinton | RG10 0LP RG10 0LQ RG10 0XJ |
| Brook Street | RG10 9NX |
| Butchers Row | RG10 9TW |
| Byron Close | RG10 0BG |
| Byron Road | RG10 0AE |
| Carlile Gardens | RG10 9BU |
| Chaseside Avenue | RG10 9BT |
| Cheriton Avenue | RG10 9DB |
| Church Street | RG10 9DN RG10 9DR RG10 9ET |
| Colleton Drive | RG10 0AU RG10 0AX |
| Cotterell Gardens | RG10 0XP |
| Danesfield Gardens | RG10 9DF |
| Gas Lane | RG10 9LX |
| Gooch Close | RG10 0XS |
| Greenfinch Drive | RG10 9JE |
| Harrison Close | RG10 0LL |
| Hermitage Drive | RG10 9HS RG10 9HT |
| Heron Drive | RG10 9DE |
| High Street | RG10 9AB RG10 9AE RG10 9AG RG10 9AJ RG10 9AQ RG10 9AD |
| Hilltop Road | RG10 9BH RG10 9BJ RG10 9BL RG10 9BN |
| Hurst Road | RG10 0AG RG10 0AH RG10 0AJ RG10 0AL RG10 0AN RG10 0AQ |
| Jarvis Drive | RG10 9EW |
| Kibblewhite Crescent | RG10 9AX |
| Kingfisher Court | RG10 0BD |
| Kings Gardens | RG10 9PU |
| Lansdowne Terrace | RG10 9DY |
| Lincoln Gardens | RG10 9HU |
| Llewellyn Park | RG10 9NB |
| Loddon Hall Road | RG10 9JA |
| Loddon View | RG10 0AW |
| London Road | RG10 9EH RG10 9EJ RG10 9EL RG10 9ER RG10 9EU RG10 9EY RG10 9EX |
| Longfield Road | RG10 9AH RG10 9AN RG10 9AP RG10 9AS RG10 9AT RG10 9AW RG10 9AR |
| Mallard Close | RG10 0BE |
| Malvern Way | RG10 9PX RG10 9PY |
| Montreal Terrace | RG10 9ND |
| Muddlers Lane | RG10 9PP RG10 9PR |
| Mulberry Close | RG10 0GJ |
| New Bath Road | RG10 9RU RG10 9RX RG10 9RY RG10 9QA |
| New Road | RG10 9PS RG10 9PT |
| Old Mill Court | RG10 9AF |
| Orchard Estate | RG10 9JY RG10 9LA RG10 9LB |
| Orpington Close | RG10 0AD |
| Packman Drive | RG10 9EN |
| Paddock Heights | RG10 0AP RG10 0AR |
| Pine Grove | RG10 9HX |
| Polehampton Close | RG10 9RP |
| Polehampton Court | RG10 9RR |
| Poundfield Way | RG10 0XR |
| Ruscombe Road | RG10 9JL RG10 9JS |
| Salix Gardens | RG10 9AU |
| Silk Lane | RG10 9GA RG10 9GY |
| South View Close | RG10 9AY |
| Springfield Park | RG10 9JG RG10 9JH RG10 9JJ |
| Station Road | RG10 9NF RG10 9NS RG10 9NT RG10 9NA RG10 9NG |
| Station Terrace | RG10 9NE |
| Stephen Close | RG10 0XN |
| Stephenson Close | RG10 9FG |
| Swanscourt | RG10 0AZ |
| Sycamore Drive | RG10 9HP |
| The Grove | RG10 9DT RG10 9DU RG10 9JQ |
| The Pines | RG10 9PA |
| Thornbury Green | RG10 9RH |
| Treacher Court | RG10 9LD |
| Troutbeck Close | RG10 9DA |
| Twyford Business Park | RG10 9TU |
| Verey Close | RG10 0LW |
| Wagtail Close | RG10 9ED |
| Waltham Road | RG10 0AA RG10 0AB RG10 0AF RG10 9EA RG10 9EB RG10 9EE RG10 9EF RG10 9EP RG10 9NH RG10 0BH RG10 9EG |
| Wargrave Road | RG10 9NY RG10 9PB RG10 9PD RG10 9PE RG10 9PH RG10 9PJ RG10 9PL RG10 9PN RG10 9PQ RG10 9WD RG10 9YA RG10 9NZ RG10 9PG |
| Waterside Court | RG10 9JB |
| Weavers Way | RG10 9GX |
| Wellington Close | RG10 0GL |
| Wensley Close | RG10 9HR |
| Wessex Gardens | RG10 0AY RG10 0BA |
| Westview Drive | RG10 9BP |
| Willow Drive | RG10 9BA RG10 9DD |
| Winchcombe Road | RG10 0AS RG10 0AT |
| Woodpecker Close | RG10 0BB |
| Yewhurst Close | RG10 9PW |
Transport near Twyford
- FAQ
- Price Paid By Year
- Property Type Price
Frequently asked questions about Twyford
What is the average price for a property for sale in Twyford?
The average price for a property for sale in Twyford is £527,707. This amount is 5% higher than the average price in Reading. There are 461 property listings for sale in Twyford.
What streets have the most expensive properties for sale in Twyford?
The streets with the most expensive properties for sale in Twyford are Yewhurst Close at an average of £1,100,000, New Road at an average of £950,000 and Lincoln Gardens at an average of £941,250.
What streets have the most affordable properties for sale in Twyford?
The streets with the most affordable properties for sale in Twyford are Harrison Close at an average of £235,000, Silk Lane at an average of £247,625 and Polehampton Close at an average of £261,666.
Which train stations are available in or near Twyford?
Some of the train stations available in or near Twyford are Twyford, Wargrave and Shiplake.
Property Price Paid in Twyford by Year
The average sold property price by year was:
| Year | Average Sold Price | Price Change |
Sold Properties
|
|---|---|---|---|
| 2025 | £533,281 | 3% |
89 Properties |
| 2024 | £515,766 | -4% |
111 Properties |
| 2023 | £538,205 | 1% |
79 Properties |
| 2022 | £530,486 | 7% |
98 Properties |
| 2021 | £490,848 | -1% |
135 Properties |
| 2020 | £496,261 | 3% |
77 Properties |
| 2019 | £481,172 | -2% |
105 Properties |
| 2018 | £491,664 | 4% |
96 Properties |
| 2017 | £472,977 | 8% |
101 Properties |
| 2016 | £434,512 | 14% |
105 Properties |
| 2015 | £373,269 | 2% |
145 Properties |
| 2014 | £366,795 | 9% |
122 Properties |
| 2013 | £333,543 | 5% |
114 Properties |
| 2012 | £318,340 | -4% |
111 Properties |
| 2011 | £332,189 | 5% |
105 Properties |
| 2010 | £314,255 | 8% |
103 Properties |
| 2009 | £290,533 | -3% |
104 Properties |
| 2008 | £300,611 | 2% |
97 Properties |
| 2007 | £294,420 | 2% |
157 Properties |
| 2006 | £287,793 | 10% |
167 Properties |
| 2005 | £259,477 | -2% |
165 Properties |
| 2004 | £264,578 | 14% |
175 Properties |
| 2003 | £227,461 | 5% |
163 Properties |
| 2002 | £216,406 | 12% |
201 Properties |
| 2001 | £190,238 | 16% |
195 Properties |
| 2000 | £160,234 | 5% |
218 Properties |
| 1999 | £152,788 | 22% |
205 Properties |
| 1998 | £118,681 | 11% |
149 Properties |
| 1997 | £106,193 | 3% |
162 Properties |
| 1996 | £102,586 | 9% |
179 Properties |
| 1995 | £93,143 | - |
131 Properties |
Property Price per Property Type in Twyford
Here you can find historic sold price data in order to help with your property search.
The average Property Paid Price for specific property types in the last three years are:
| Property Type | Average Sold Price | Sold Properties |
|---|---|---|
| Flat | £265,898.00 | 50 Flats |
| Semi Detached House | £542,461.00 | 88 Semi Detached Houses |
| Detached House | £789,524.00 | 73 Detached Houses |
| Terraced House | £420,051.00 | 68 Terraced Houses |

