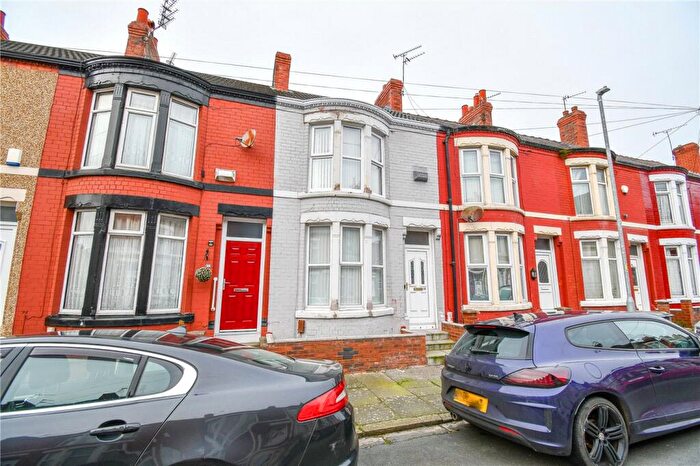
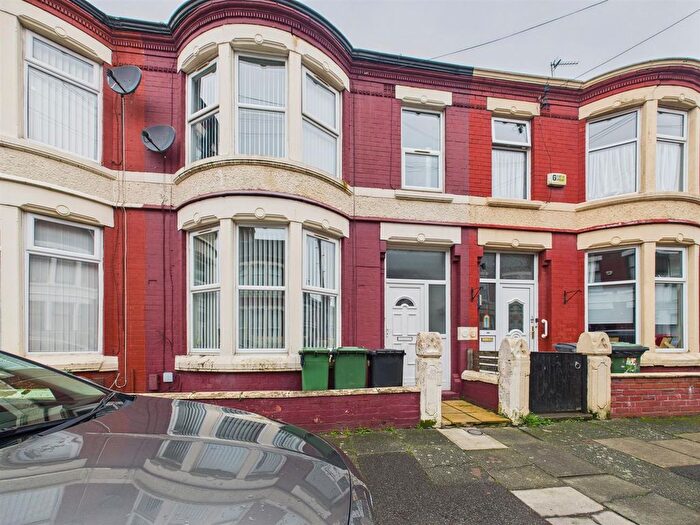
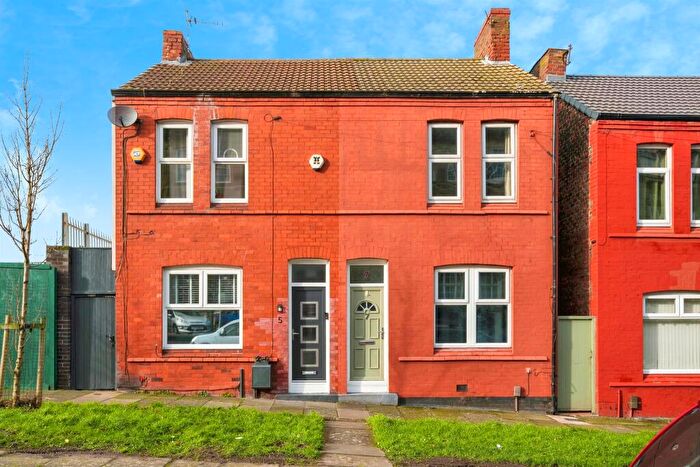
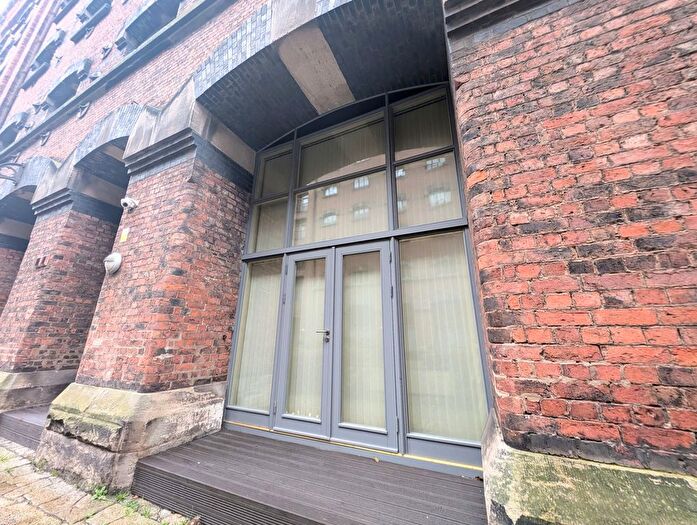
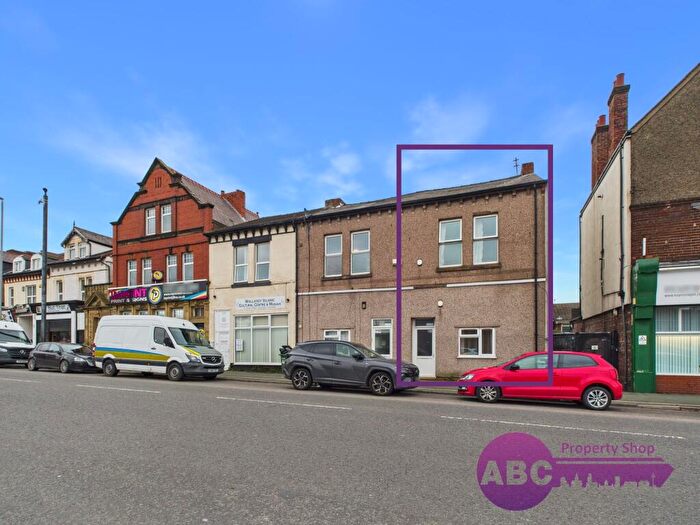
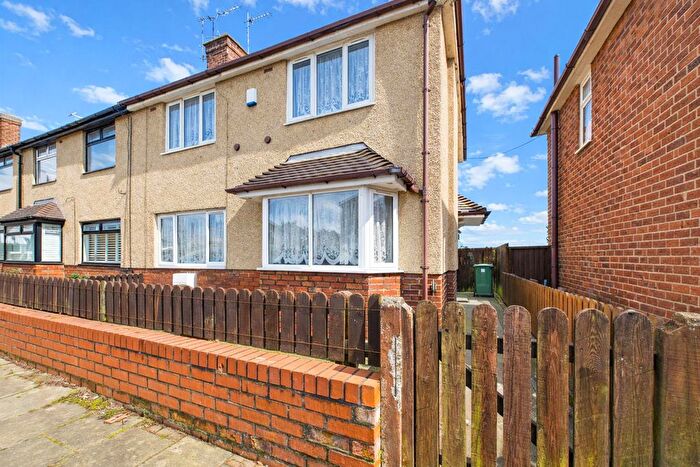
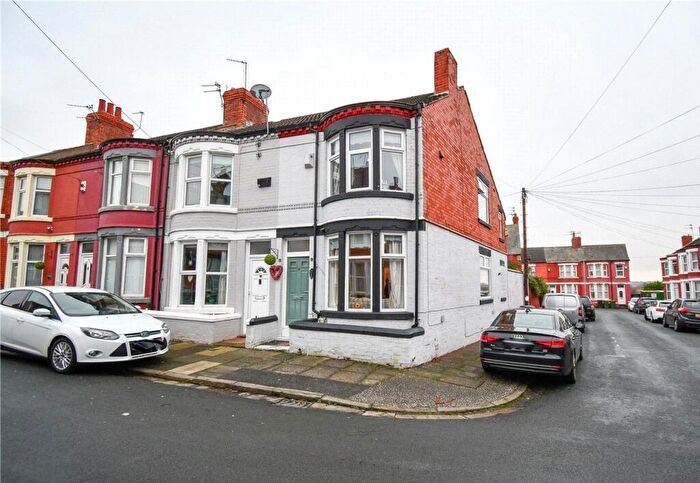
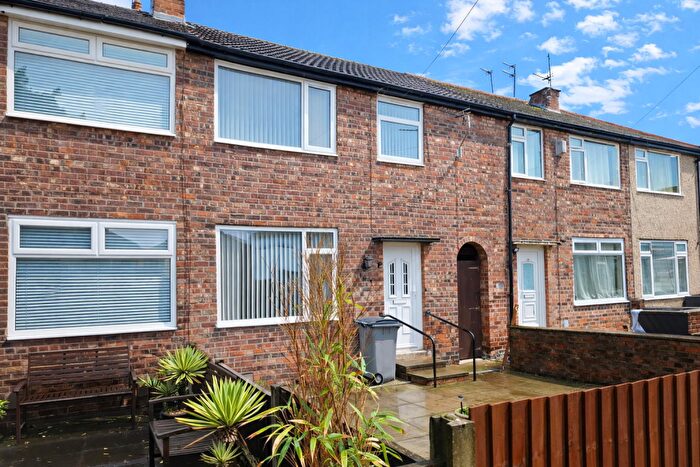
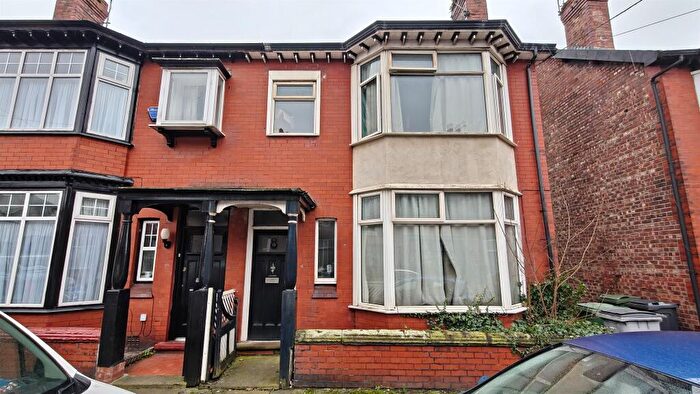
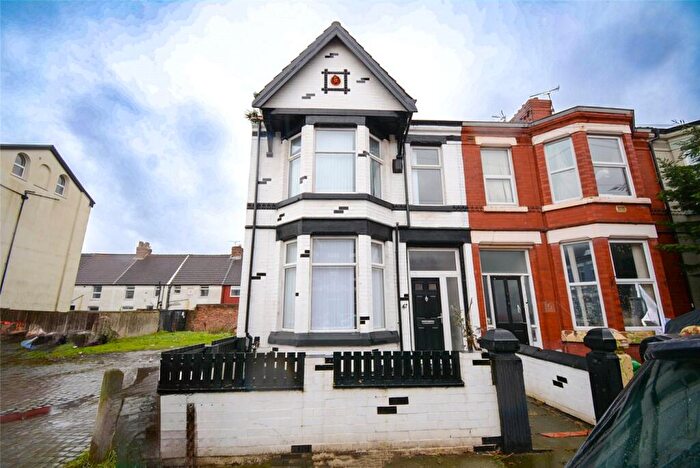
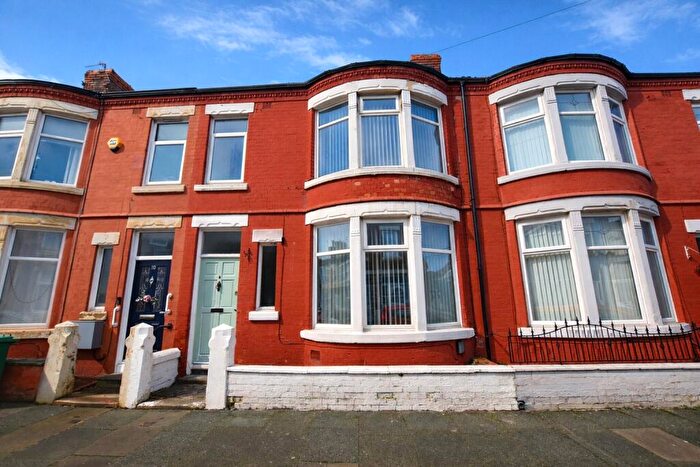
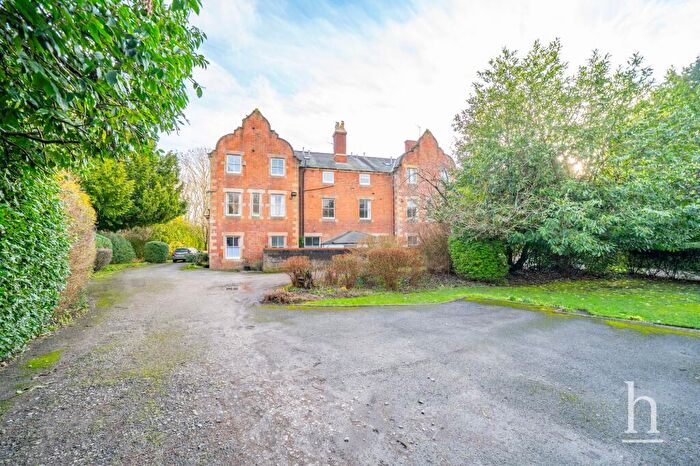
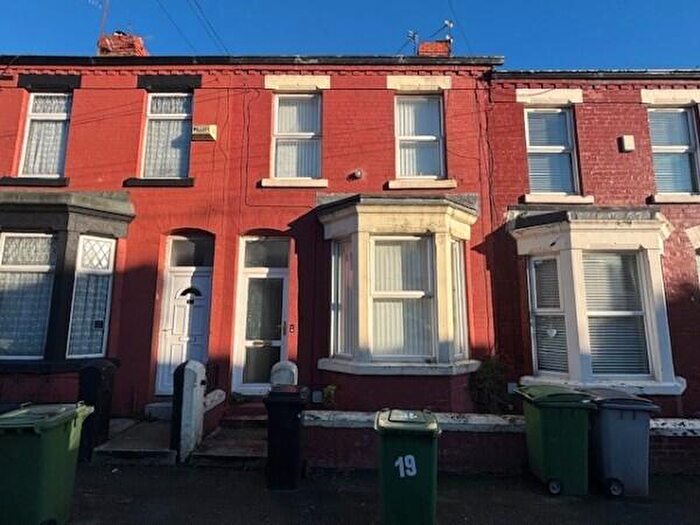
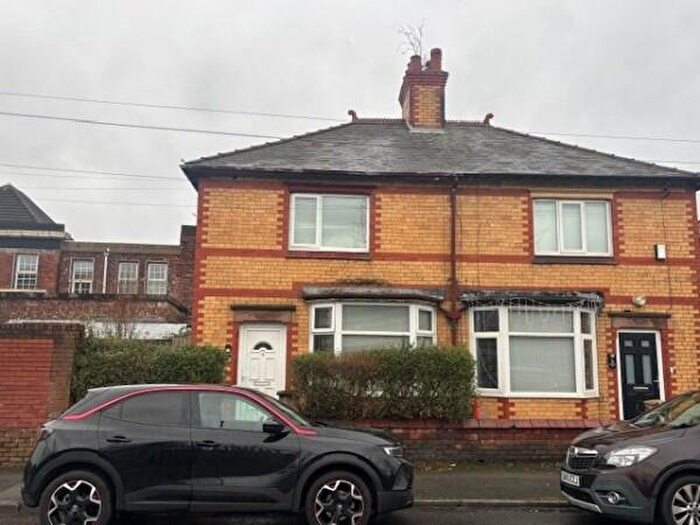
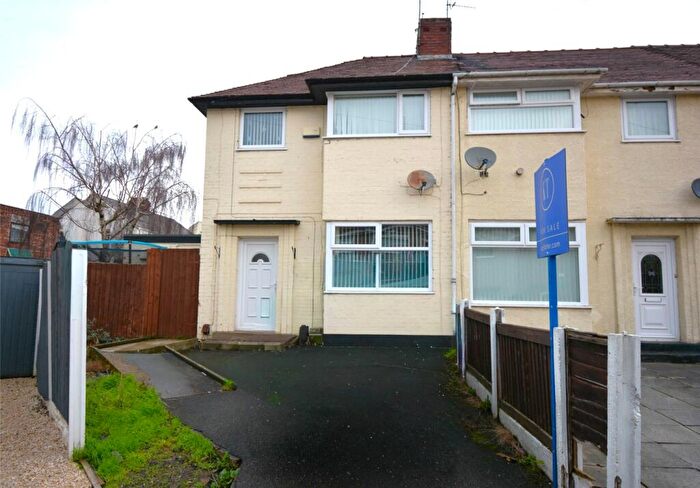
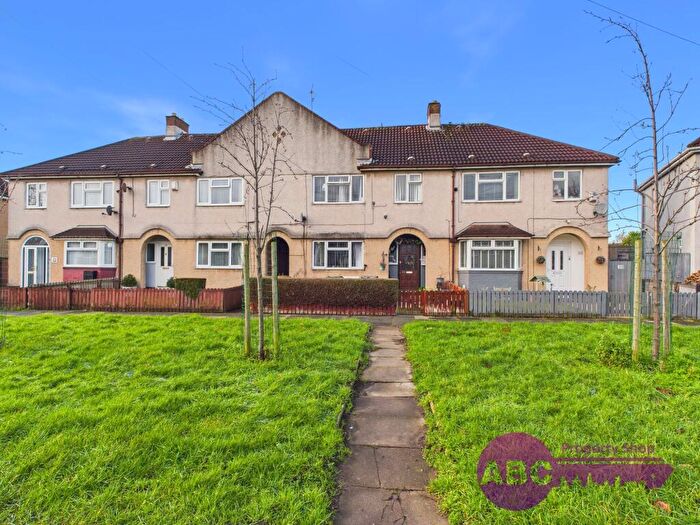
Houses for sale & to rent in Seacombe, Birkenhead
House Prices in Seacombe
Properties in Seacombe have an average house price of £102,525.00 and had 8 Property Transactions within the last 3 years¹.
Seacombe is an area in Birkenhead, Wirral with 79 households², where the most expensive property was sold for £155,000.00.
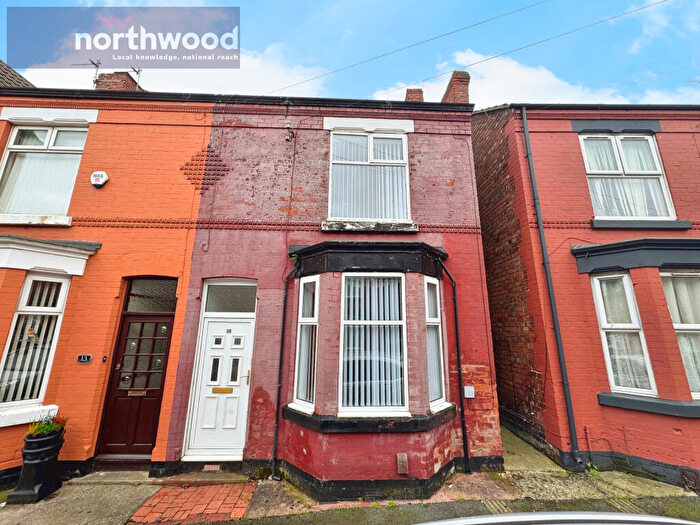
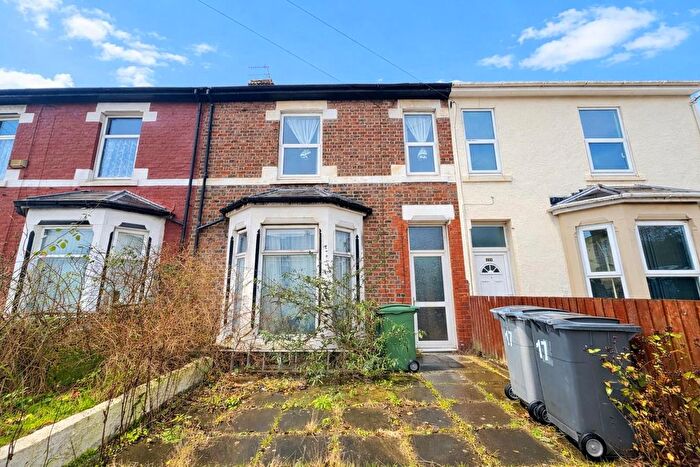
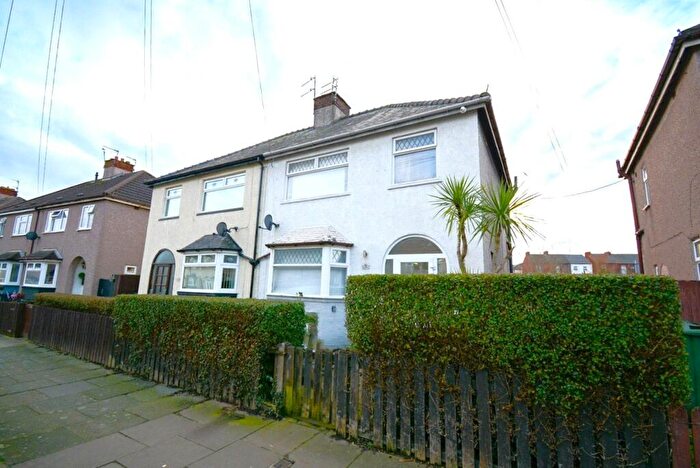
Properties for sale in Seacombe
Roads and Postcodes in Seacombe
Navigate through our locations to find the location of your next house in Seacombe, Birkenhead for sale or to rent.
| Streets | Postcodes |
|---|---|
| Cashel Road | CH41 1DY |
| Dock Road | CH41 1DN CH41 1DF CH41 1DQ CH41 1FD CH41 1AE CH41 1BT CH41 1DR CH41 1DU |
| Duke Street | CH41 1LG |
| East Street | CH41 1BY |
| Hickmans Road | CH41 1JH |
| Kelvin Park | CH41 1LT |
| Kings Wharf | CH41 1FG |
| Logan Road | CH41 1JJ |
| Maritime Business Park | CH41 1AQ |
| Millbrook Road | CH41 1FL |
| North Alfred Dock Docks | CH41 1DB |
| Ocean Park | CH41 1HW |
| Scotts Quays | CH41 1FB |
| Smm Business Park | CH41 1DT |
| Sovereign Way | CH41 1DL |
| Tower Road | CH41 1FE |
| Wirral Business Centre | CH41 1JW |
| CH41 1DS |
Transport near Seacombe
-
Birkenhead Park Station
-
Conway Park Station
-
Birkenhead Hamilton Square Station
-
Birkenhead North Station
-
Birkenhead Central Station
-
Liverpool James Street Station
-
Green Lane Station
-
Moorfields Station
-
Wallasey Village Station
-
Bidston Station
- FAQ
- Price Paid By Year
- Property Type Price
Frequently asked questions about Seacombe
What is the average price for a property for sale in Seacombe?
The average price for a property for sale in Seacombe is £102,525. This amount is 27% lower than the average price in Birkenhead. There are 950 property listings for sale in Seacombe.
Which train stations are available in or near Seacombe?
Some of the train stations available in or near Seacombe are Birkenhead Park, Conway Park and Birkenhead Hamilton Square.
Property Price Paid in Seacombe by Year
The average sold property price by year was:
| Year | Average Sold Price | Price Change |
Sold Properties
|
|---|---|---|---|
| 2025 | £98,166 | 6% |
3 Properties |
| 2024 | £92,676 | -67% |
4 Properties |
| 2023 | £155,000 | 18% |
1 Property |
| 2022 | £126,908 | 43% |
4 Properties |
| 2021 | £72,000 | 8% |
1 Property |
| 2020 | £66,000 | -84% |
1 Property |
| 2019 | £121,375 | 15% |
4 Properties |
| 2018 | £103,000 | -1% |
3 Properties |
| 2017 | £103,800 | -1% |
5 Properties |
| 2016 | £105,100 | -12% |
5 Properties |
| 2015 | £117,875 | 22% |
4 Properties |
| 2014 | £92,194 | 2% |
9 Properties |
| 2012 | £89,950 | 7% |
1 Property |
| 2009 | £83,500 | -62% |
1 Property |
| 2008 | £134,983 | -7% |
3 Properties |
| 2007 | £145,094 | 3% |
56 Properties |
| 2006 | £140,364 | - |
17 Properties |
Property Price per Property Type in Seacombe
Here you can find historic sold price data in order to help with your property search.
The average Property Paid Price for specific property types in the last three years are:
| Property Type | Average Sold Price | Sold Properties |
|---|---|---|
| Flat | £102,525.00 | 8 Flats |

