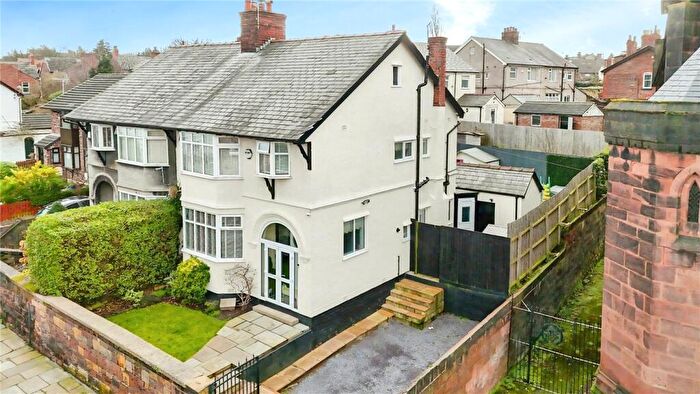
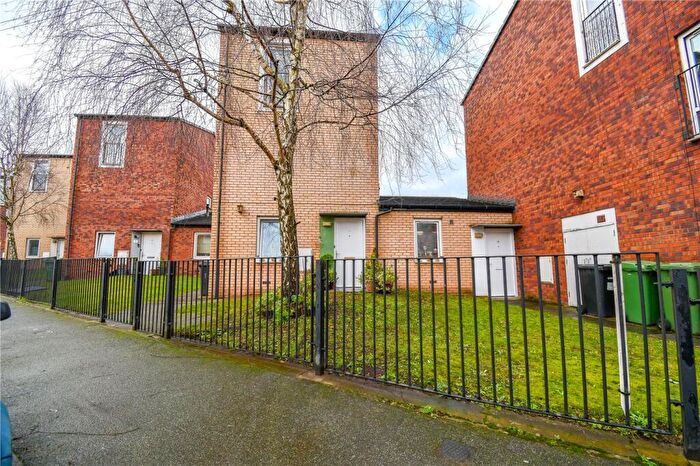
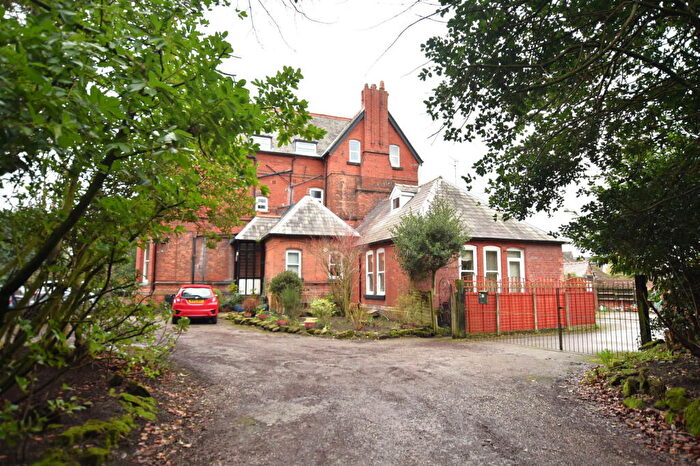
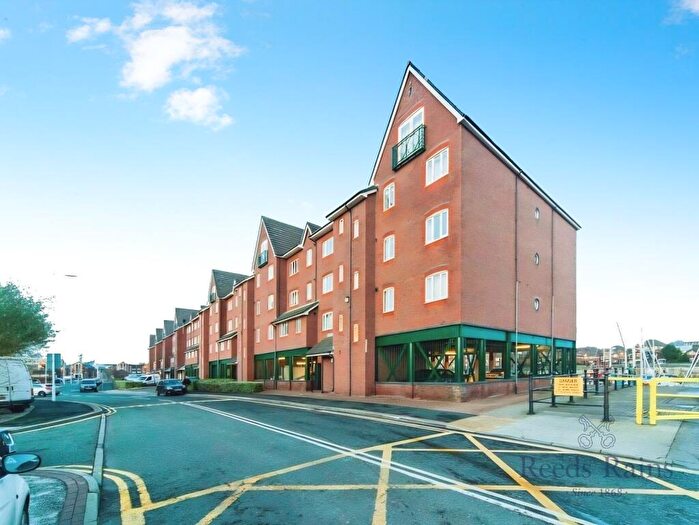
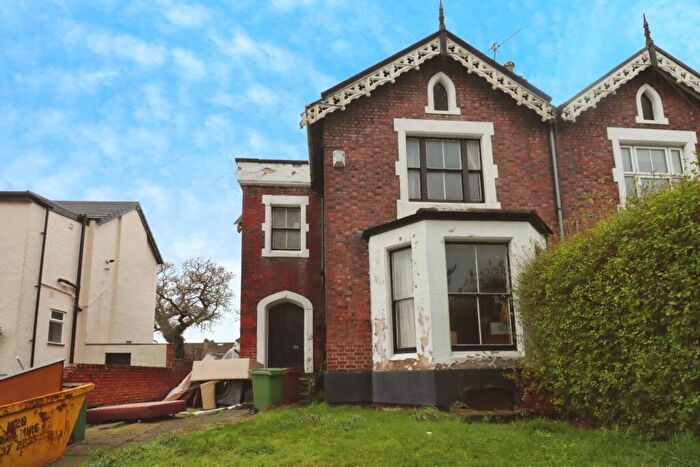
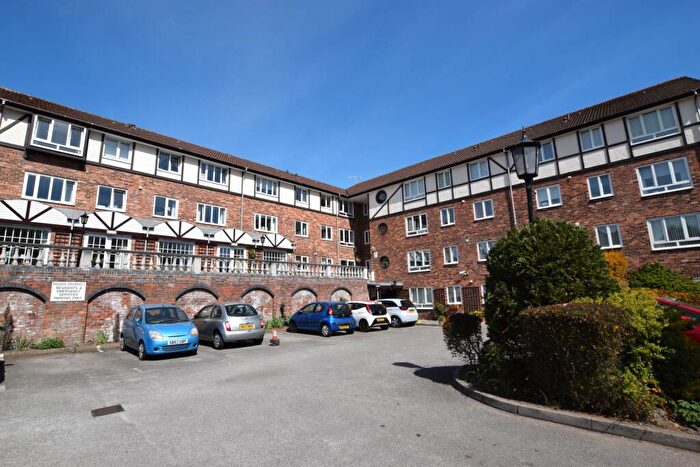
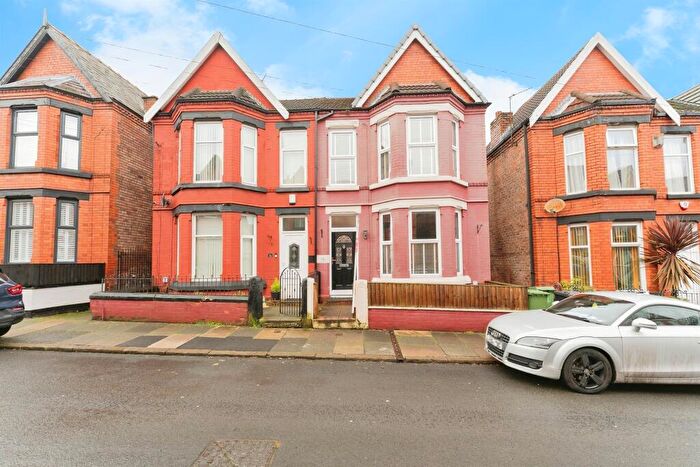
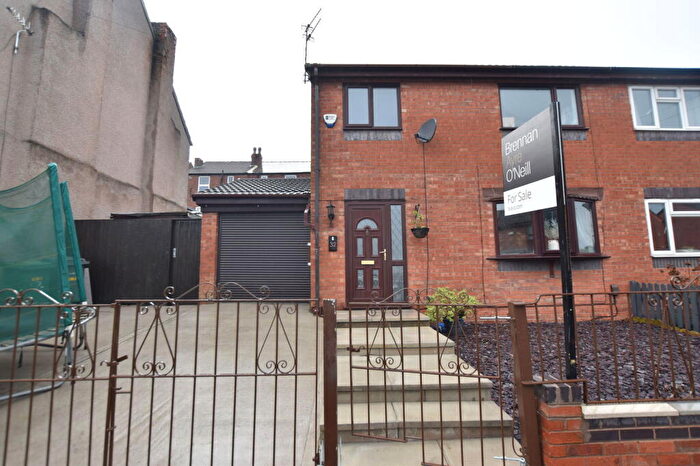
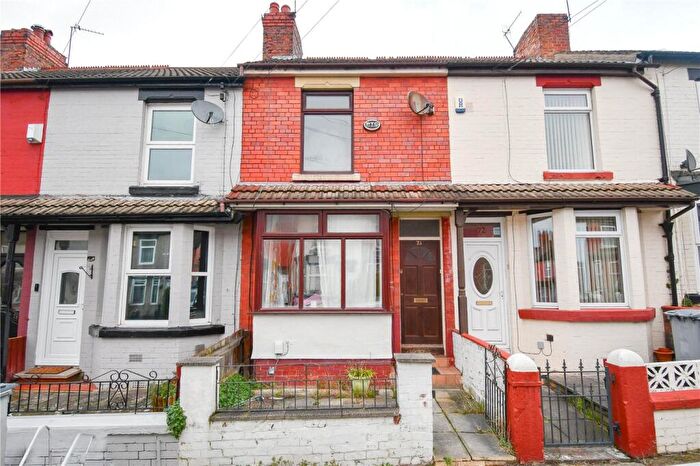
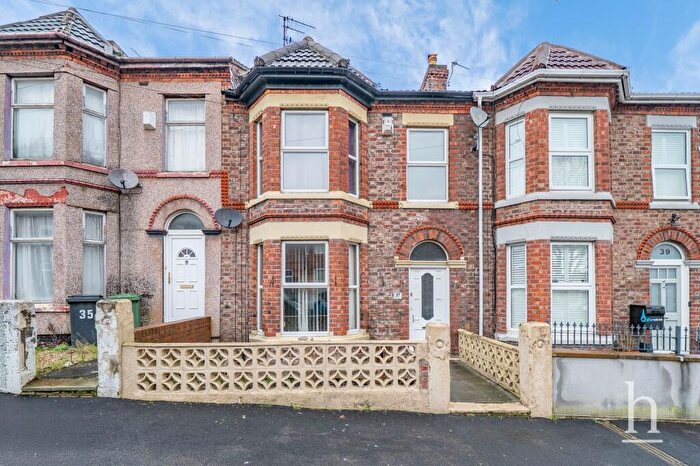
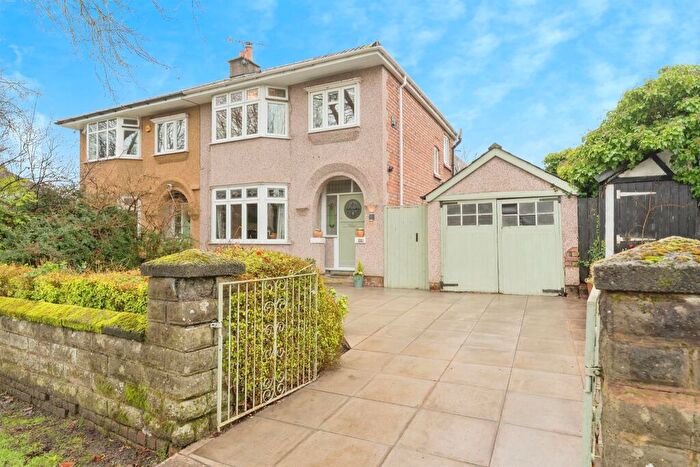
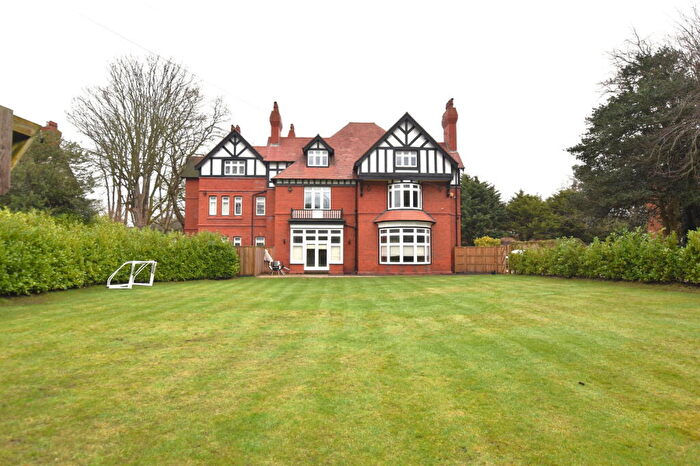
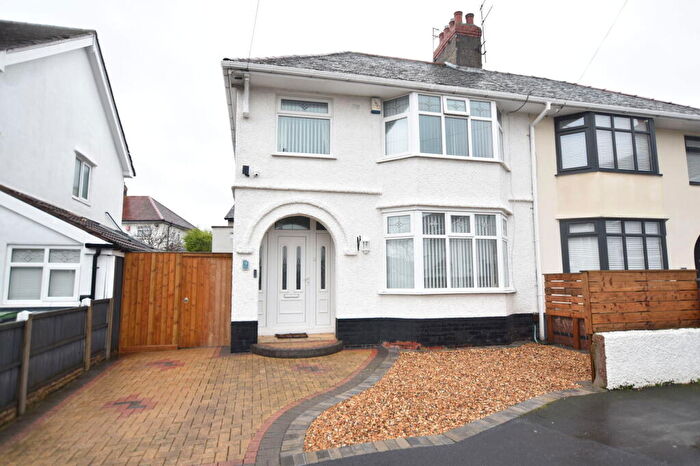
Houses for sale & to rent in Birkenhead, Wirral
House Prices in Birkenhead
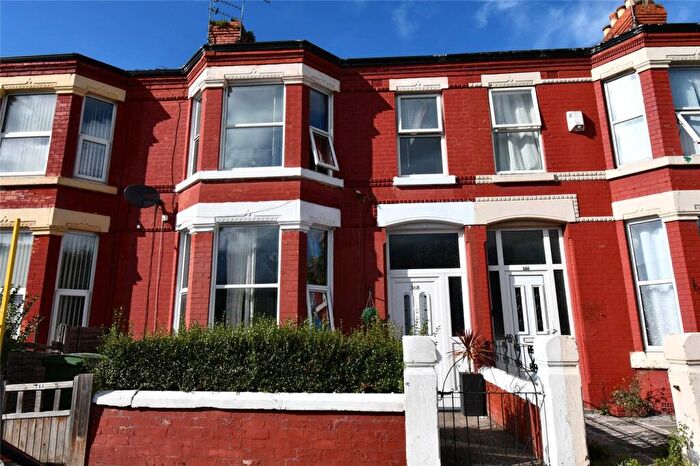
Properties in Birkenhead have an average house price of £140,016.00 and had 2,024 Property Transactions within the last 3 years.¹
Birkenhead is an area in Wirral with 22,913 households², where the most expensive property was sold for £1,012,500.00.
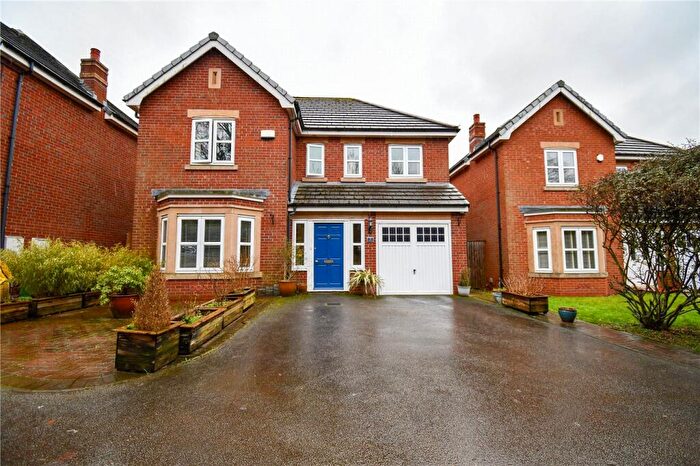
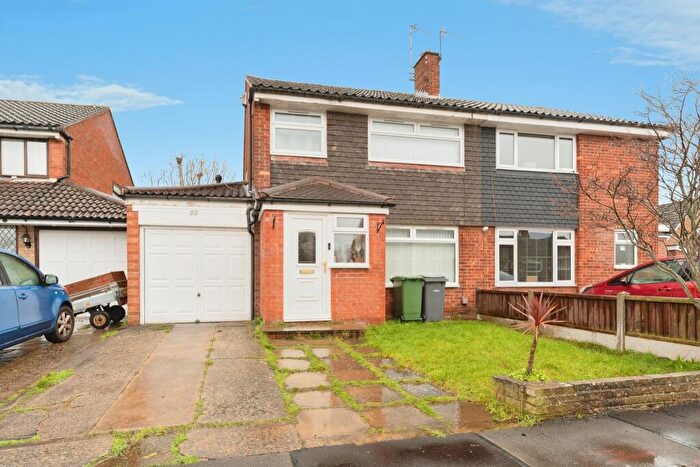
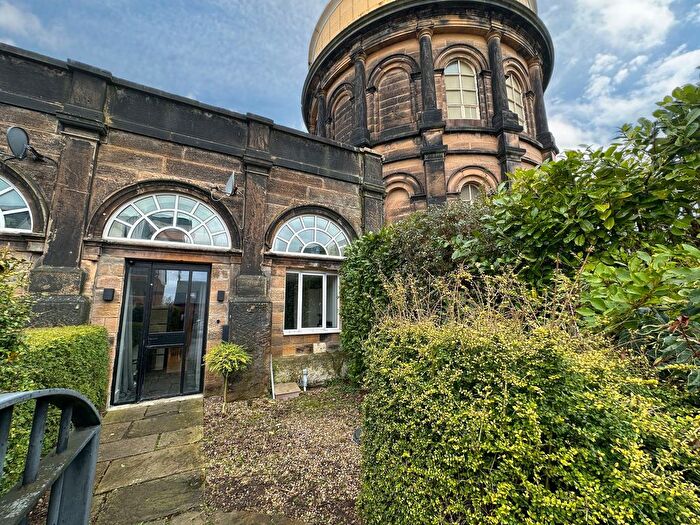
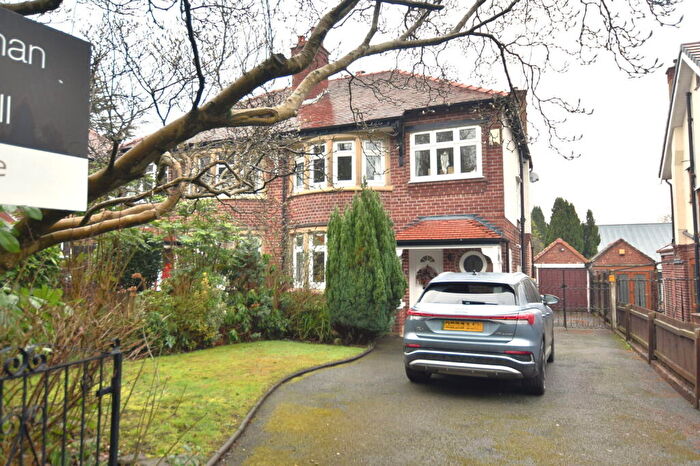
Properties for sale in Birkenhead
Neighbourhoods in Birkenhead
Navigate through our locations to find the location of your next house in Birkenhead, Wirral for sale or to rent.
Transport in Birkenhead
Please see below transportation links in this area:
-
Birkenhead Central Station
-
Green Lane Station
-
Conway Park Station
-
Birkenhead Hamilton Square Station
-
Birkenhead Park Station
-
Rock Ferry Station
-
Birkenhead North Station
-
Liverpool James Street Station
-
Bebington Station
-
Brunswick Station
- FAQ
- Price Paid By Year
- Property Type Price
Frequently asked questions about Birkenhead
What is the average price for a property for sale in Birkenhead?
The average price for a property for sale in Birkenhead is £140,016. This amount is 41% lower than the average price in Wirral. There are 9,744 property listings for sale in Birkenhead.
What locations have the most expensive properties for sale in Birkenhead?
The locations with the most expensive properties for sale in Birkenhead are Prenton at an average of £226,906, Claughton at an average of £156,768 and Oxton at an average of £142,636.
What locations have the most affordable properties for sale in Birkenhead?
The locations with the most affordable properties for sale in Birkenhead are Seacombe at an average of £102,525, Bidston And St James at an average of £106,667 and Birkenhead And Tranmere at an average of £106,761.
Which train stations are available in or near Birkenhead?
Some of the train stations available in or near Birkenhead are Birkenhead Central, Green Lane and Conway Park.
Property Price Paid in Birkenhead by Year
The average sold property price by year was:
| Year | Average Sold Price | Price Change |
Sold Properties
|
|---|---|---|---|
| 2025 | £147,310 | 3% |
617 Properties |
| 2024 | £142,550 | 8% |
724 Properties |
| 2023 | £130,742 | -0,4% |
683 Properties |
| 2022 | £131,210 | 2% |
866 Properties |
| 2021 | £128,840 | 23% |
928 Properties |
| 2020 | £99,118 | -12% |
812 Properties |
| 2019 | £111,385 | 2% |
835 Properties |
| 2018 | £109,133 | 2% |
855 Properties |
| 2017 | £107,080 | 4% |
795 Properties |
| 2016 | £102,661 | 6% |
759 Properties |
| 2015 | £96,496 | -6% |
696 Properties |
| 2014 | £102,720 | 9% |
713 Properties |
| 2013 | £93,098 | -11% |
481 Properties |
| 2012 | £103,206 | 6% |
365 Properties |
| 2011 | £96,836 | -3% |
373 Properties |
| 2010 | £99,404 | -5% |
348 Properties |
| 2009 | £104,795 | -1% |
313 Properties |
| 2008 | £106,194 | -7% |
559 Properties |
| 2007 | £113,483 | 11% |
1,311 Properties |
| 2006 | £100,903 | 10% |
1,231 Properties |
| 2005 | £90,958 | 14% |
994 Properties |
| 2004 | £78,387 | 26% |
1,302 Properties |
| 2003 | £58,283 | 16% |
1,304 Properties |
| 2002 | £49,190 | 13% |
1,187 Properties |
| 2001 | £43,022 | 12% |
912 Properties |
| 2000 | £37,793 | 4% |
909 Properties |
| 1999 | £36,373 | 10% |
934 Properties |
| 1998 | £32,725 | -4% |
947 Properties |
| 1997 | £34,053 | 9% |
767 Properties |
| 1996 | £30,973 | -0,2% |
628 Properties |
| 1995 | £31,040 | - |
665 Properties |
Property Price per Property Type in Birkenhead
Here you can find historic sold price data in order to help with your property search.
The average Property Paid Price for specific property types in the last three years are:
| Property Type | Average Sold Price | Sold Properties |
|---|---|---|
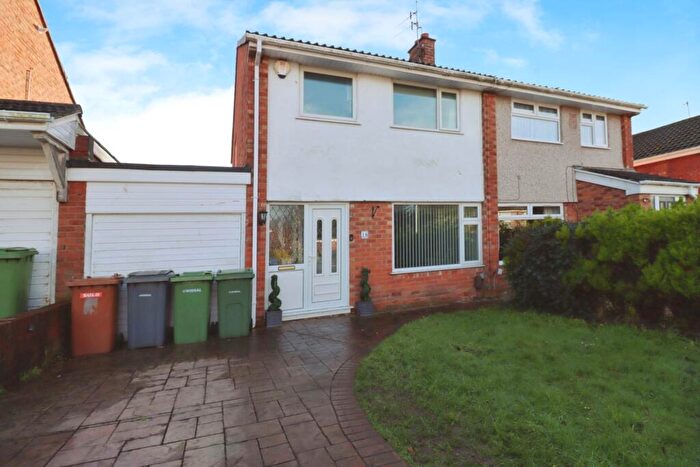
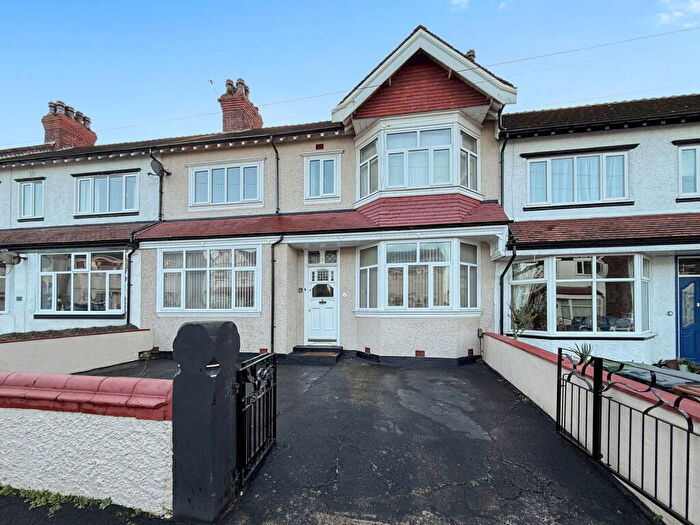
| Semi Detached House | £184,835.00 | 511 Semi Detached Houses |
| Terraced House | £112,615.00 | 1,213 Terraced Houses |
| Detached House | £374,723.00 | 85 Detached Houses |
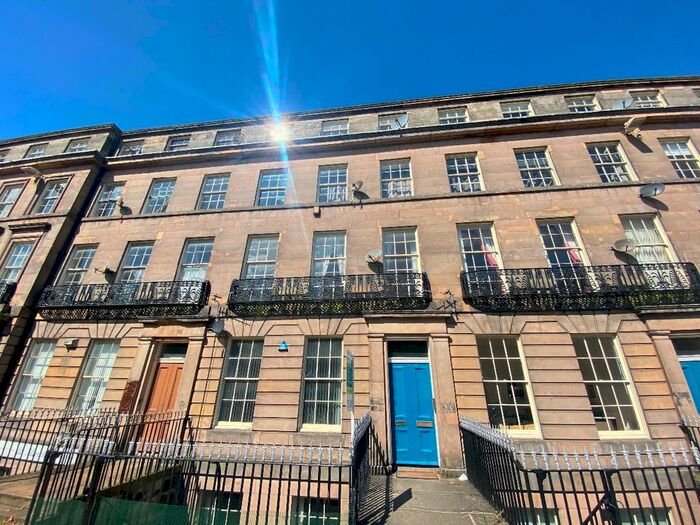
| Flat | £95,295.00 | 215 Flats |

