
Houses for sale & to rent in Leasowe And Moreton East, Wallasey
House Prices in Leasowe And Moreton East
Properties in Leasowe And Moreton East have an average house price of £190,843.00 and had 16 Property Transactions within the last 3 years¹.
Leasowe And Moreton East is an area in Wallasey, Wirral with 101 households², where the most expensive property was sold for £275,000.00.
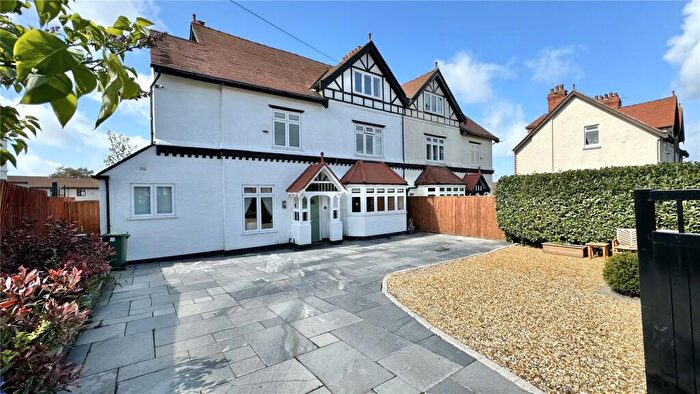
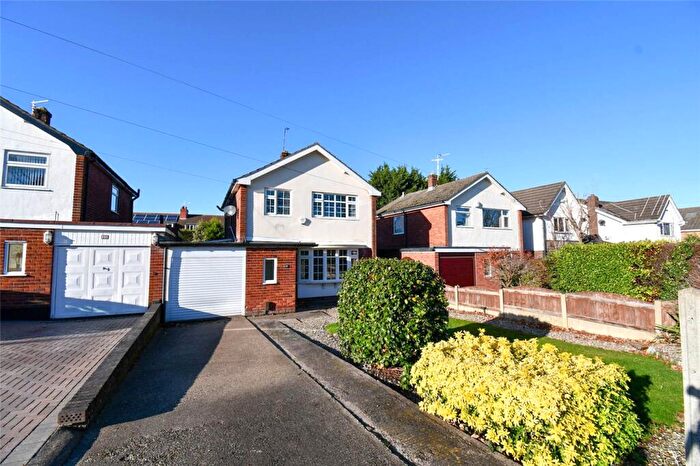
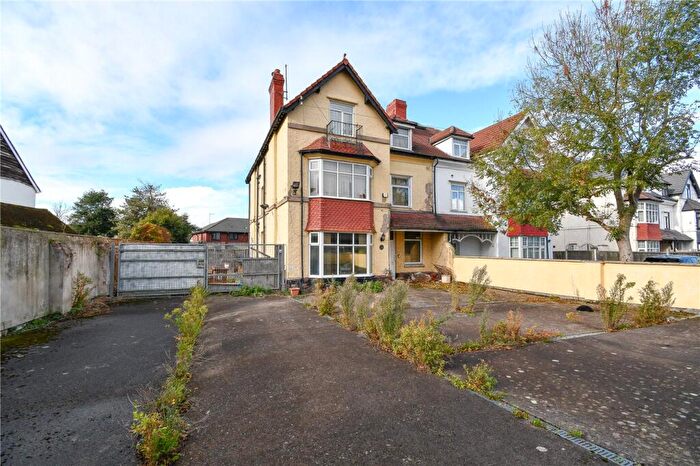
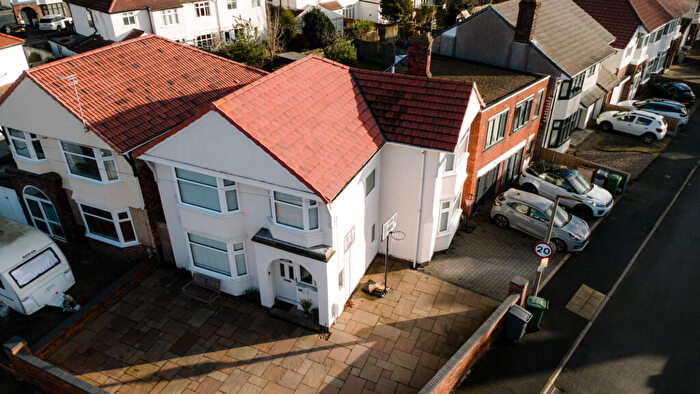
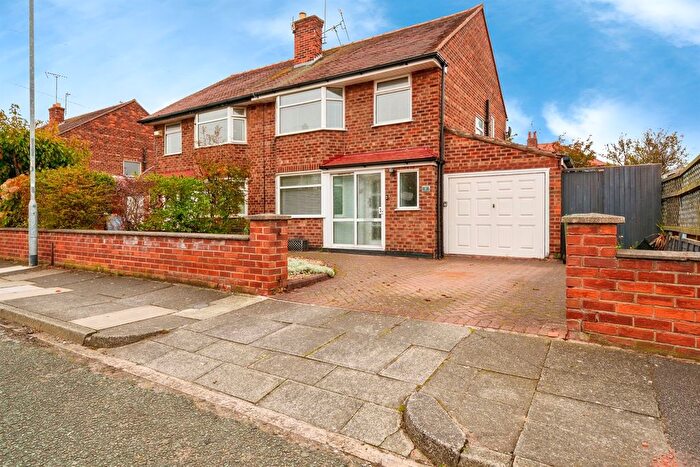
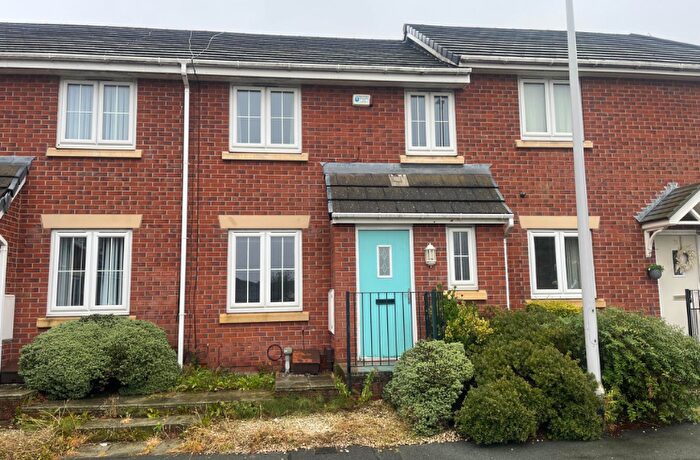
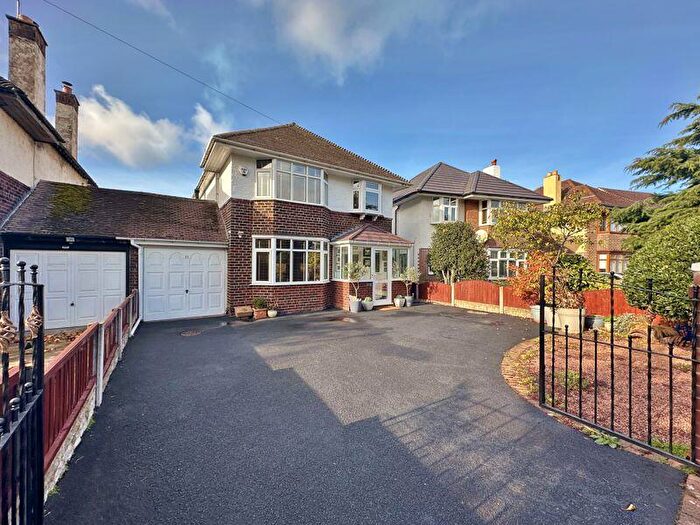
Properties for sale in Leasowe And Moreton East
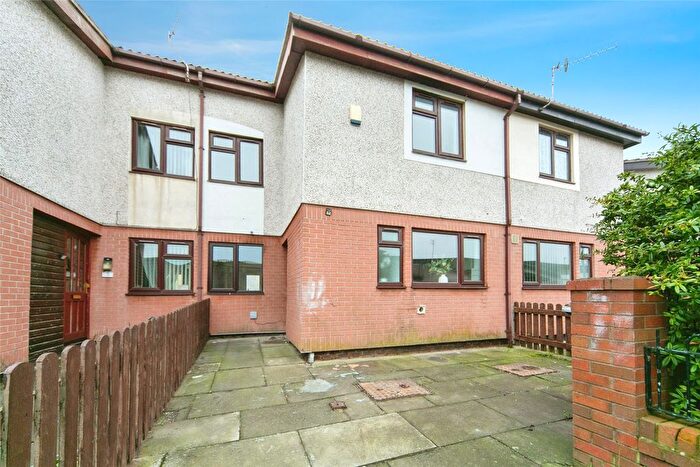
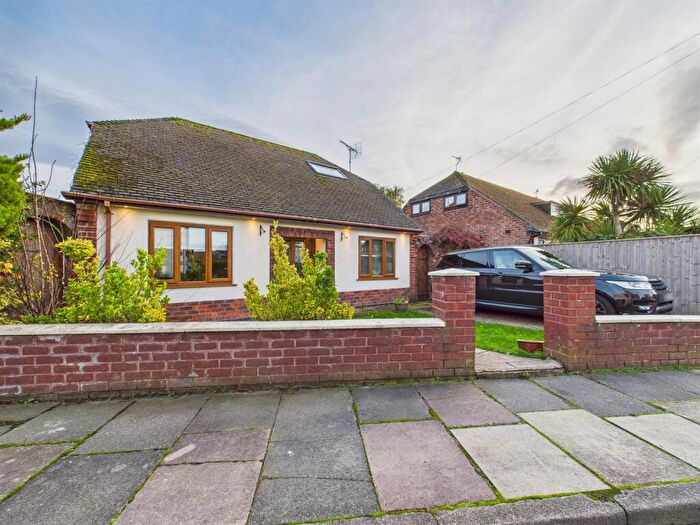
![]()
If you are looking to sell your house, let it out, or receive a property valuation, an expert can help you.
Click the button below to get started.
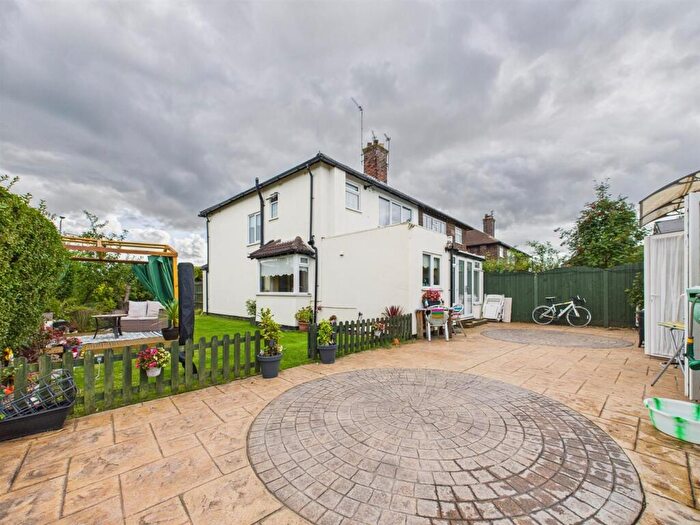
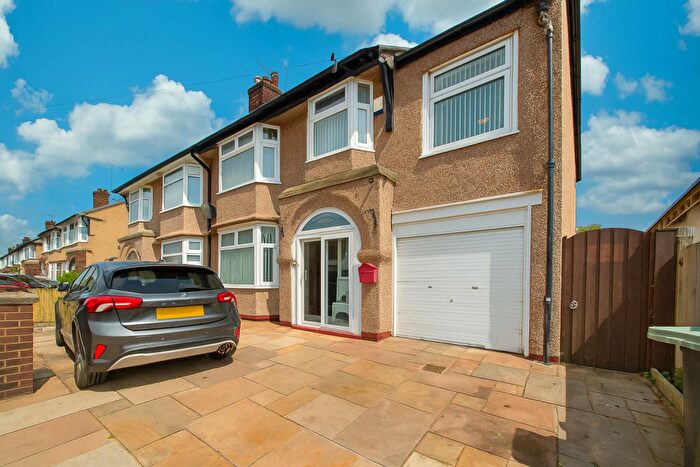
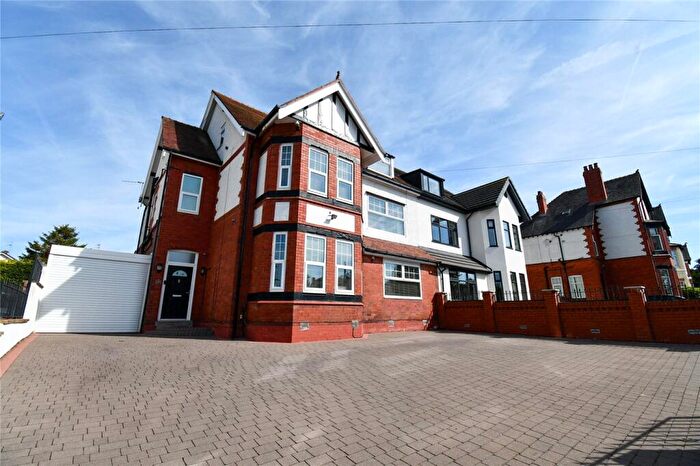
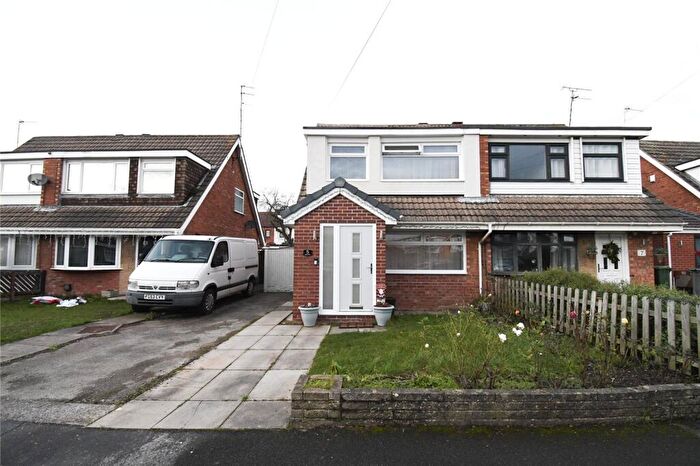
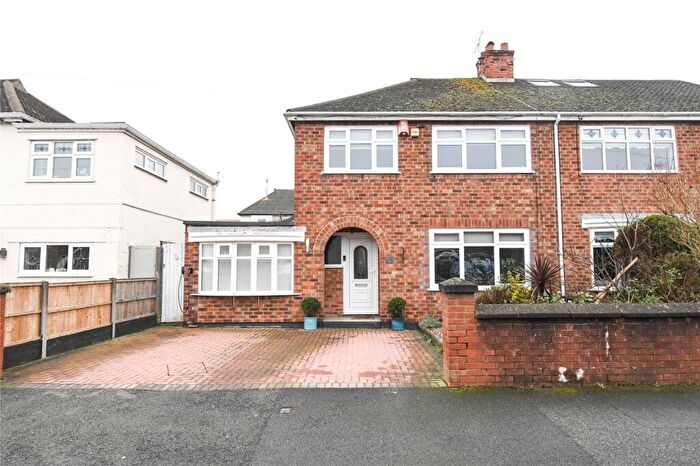
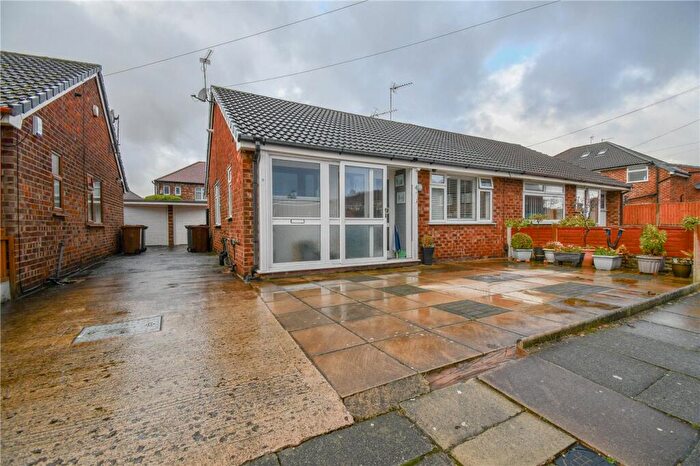
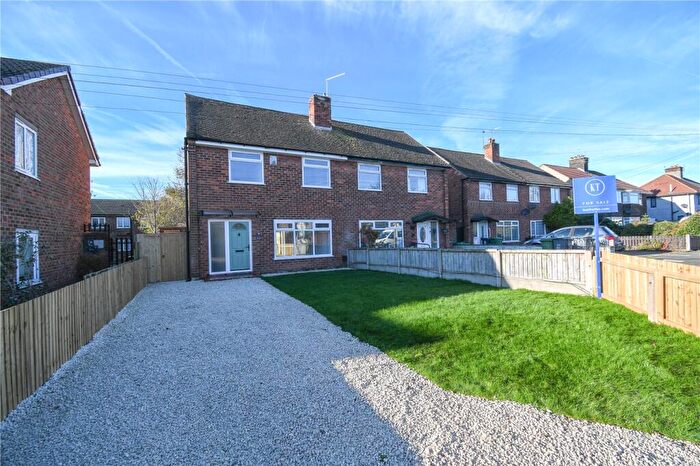
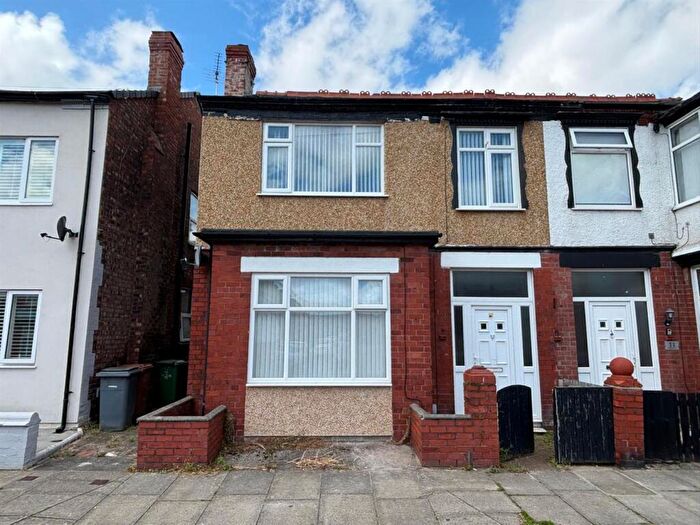
Previously listed properties in Leasowe And Moreton East
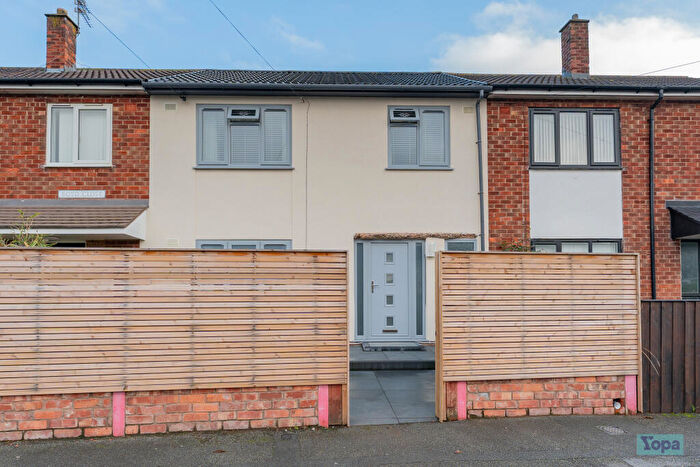
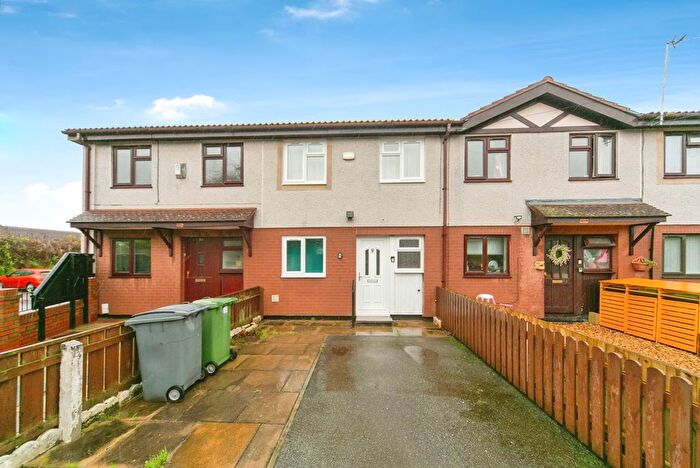
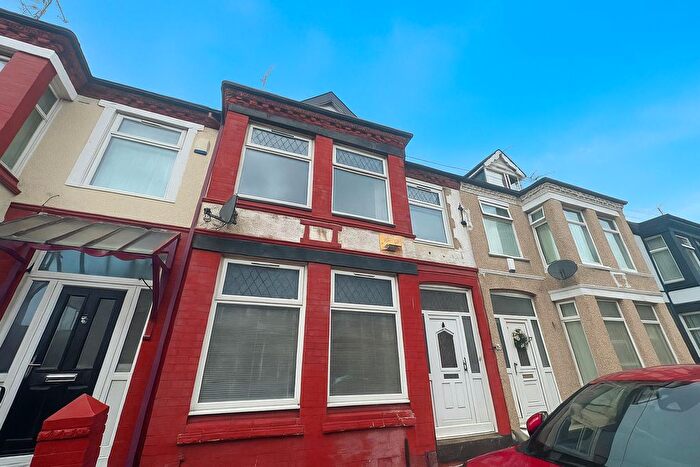
![]()
If you are looking to sell your house, let it out, or receive a property valuation, an expert can help you.
Click the button below to get started.
Roads and Postcodes in Leasowe And Moreton East
Navigate through our locations to find the location of your next house in Leasowe And Moreton East, Wallasey for sale or to rent.
| Streets | Postcodes |
|---|---|
| Bidston Link Road | CH44 2HR |
| Green Lane | CH45 8NA |
| Heyes Drive | CH45 8QL CH45 8QN CH45 8QW |
| Leasowe Road | CH45 8LW CH45 8RE |
Transport near Leasowe And Moreton East
-
 Wallasey Village Station
 -
Bidston Station
-
Wallasey Grove Road Station
-
Leasowe Station
-
Birkenhead North Station
-
Moreton (Merseyside) Station
-
New Brighton Station
-
Upton Station
-
Birkenhead Park Station
- FAQ
- Price Paid By Year
- Property Type Price
Frequently asked questions about Leasowe And Moreton East
What is the average price for a property for sale in Leasowe And Moreton East?
The average price for a property for sale in Leasowe And Moreton East is £190,843. This amount is 8% higher than the average price in Wallasey. There are 164 property listings for sale in Leasowe And Moreton East.
What streets have the most expensive properties for sale in Leasowe And Moreton East?
The street with the most expensive properties for sale in Leasowe And Moreton East is Leasowe Road at an average of £224,375.
What streets have the most affordable properties for sale in Leasowe And Moreton East?
The street with the most affordable properties for sale in Leasowe And Moreton East is Heyes Drive at an average of £179,666.
Which train stations are available in or near Leasowe And Moreton East?
Some of the train stations available in or near Leasowe And Moreton East are Wallasey Village, Bidston and Wallasey Grove Road.
Property Price Paid in Leasowe And Moreton East by Year
The average sold property price by year was:
| Year | Average Sold Price | Price Change |
Sold Properties
|
|---|---|---|---|
| 2025 | £212,333 | 25% |
3 Properties |
| 2024 | £158,750 | -17% |
2 Properties |
| 2023 | £185,500 | -6% |
6 Properties |
| 2022 | £197,200 | 16% |
5 Properties |
| 2021 | £165,500 | -4% |
4 Properties |
| 2020 | £172,500 | 22% |
2 Properties |
| 2019 | £134,556 | -7% |
8 Properties |
| 2018 | £144,625 | -5% |
4 Properties |
| 2017 | £151,833 | 15% |
6 Properties |
| 2016 | £129,083 | 8% |
6 Properties |
| 2015 | £118,700 | 1% |
5 Properties |
| 2014 | £117,658 | 10% |
6 Properties |
| 2013 | £106,250 | -5% |
4 Properties |
| 2012 | £112,000 | -8% |
6 Properties |
| 2011 | £121,316 | 13% |
3 Properties |
| 2010 | £105,940 | -2% |
5 Properties |
| 2009 | £108,125 | -16% |
4 Properties |
| 2007 | £125,150 | 1% |
6 Properties |
| 2006 | £124,000 | -10% |
4 Properties |
| 2005 | £136,666 | 20% |
3 Properties |
| 2004 | £109,333 | 24% |
3 Properties |
| 2003 | £82,725 | 33% |
4 Properties |
| 2002 | £55,360 | 5% |
5 Properties |
| 2001 | £52,741 | 13% |
6 Properties |
| 2000 | £45,914 | 6% |
7 Properties |
| 1999 | £43,190 | -1% |
5 Properties |
| 1998 | £43,628 | -3% |
7 Properties |
| 1997 | £44,833 | 15% |
3 Properties |
| 1996 | £38,125 | 8% |
4 Properties |
| 1995 | £35,115 | - |
7 Properties |
Property Price per Property Type in Leasowe And Moreton East
Here you can find historic sold price data in order to help with your property search.
The average Property Paid Price for specific property types in the last three years are:
| Property Type | Average Sold Price | Sold Properties |
|---|---|---|
| Semi Detached House | £190,035.00 | 14 Semi Detached Houses |
| Terraced House | £196,500.00 | 2 Terraced Houses |