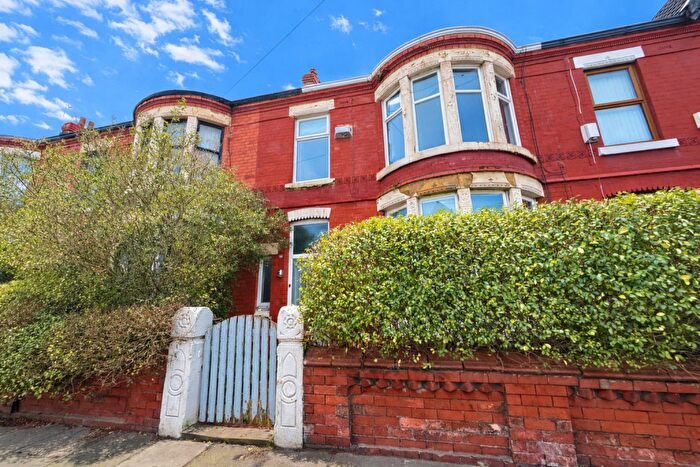
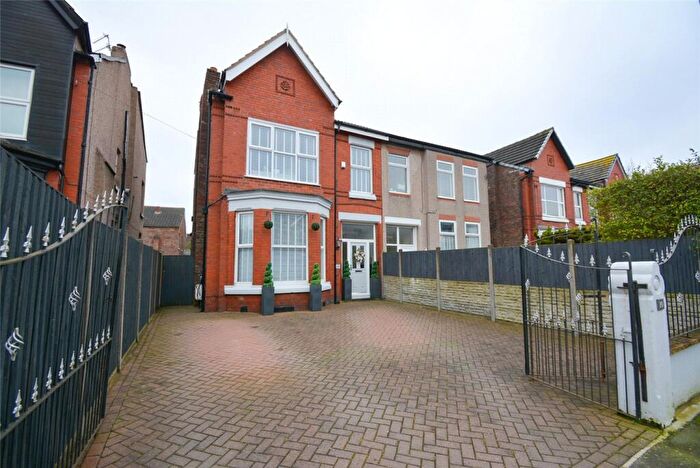
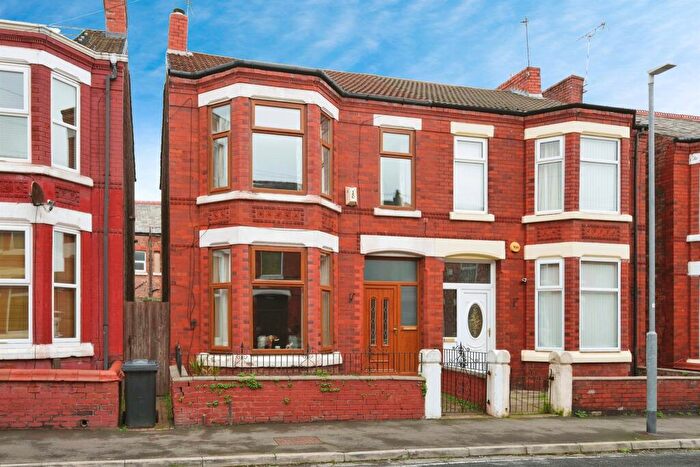
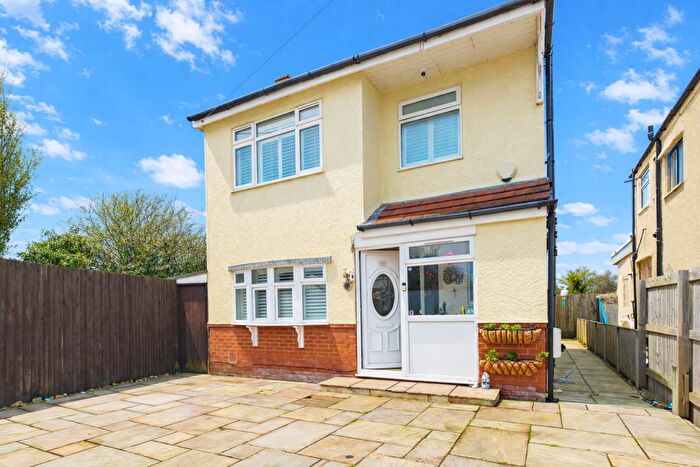
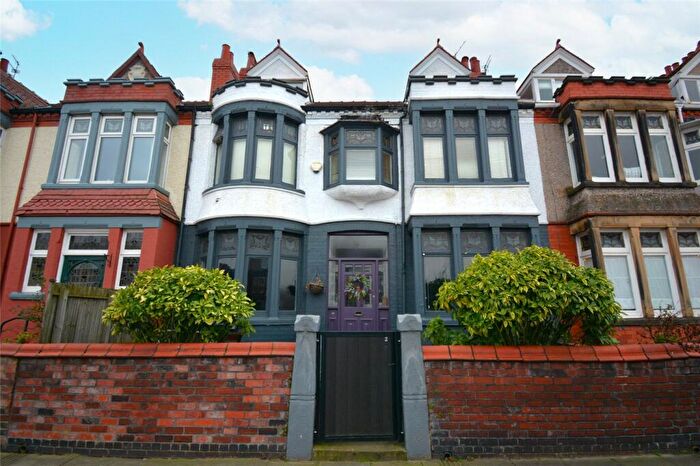
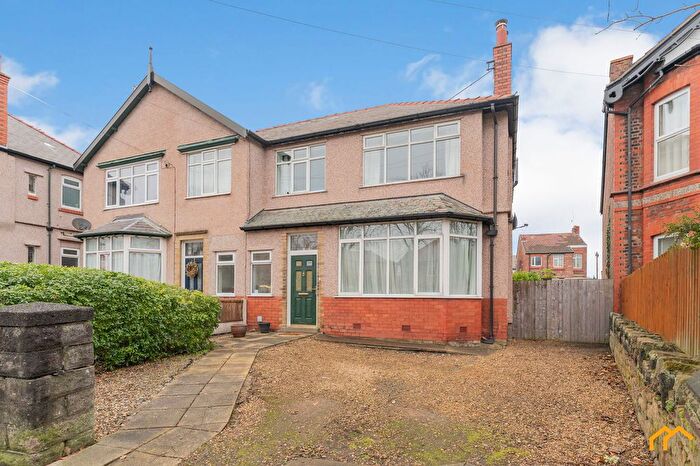
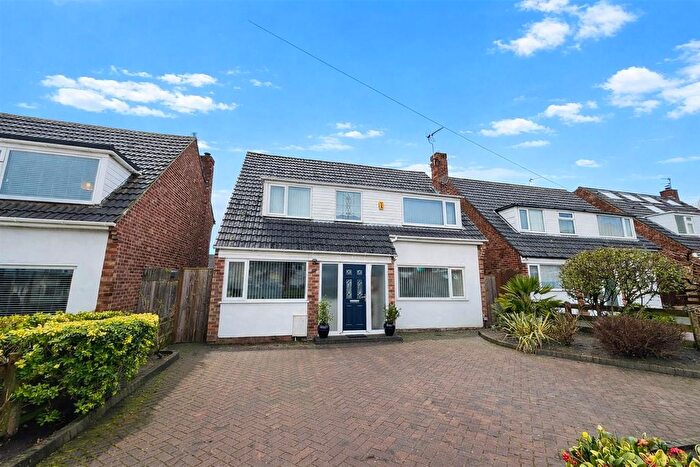
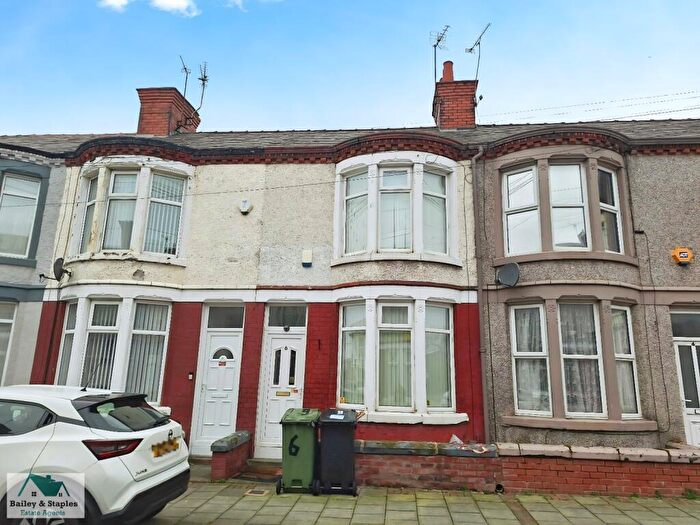
Houses for sale & to rent in Wallasey, Wirral
House Prices in Wallasey
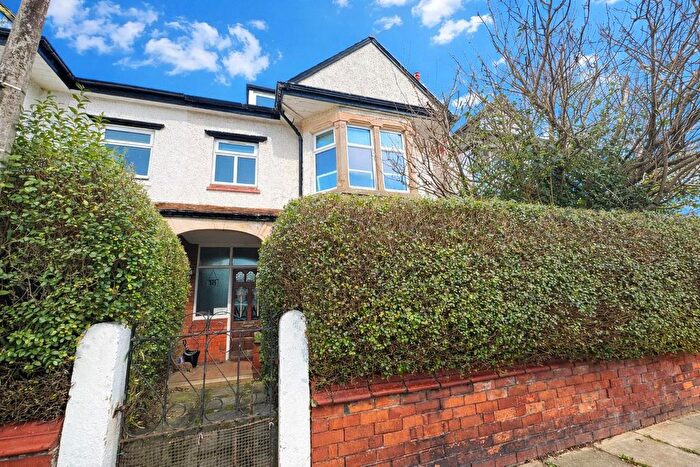
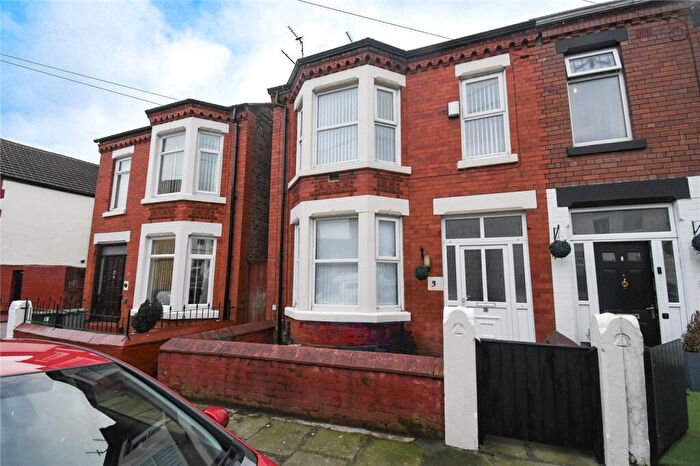
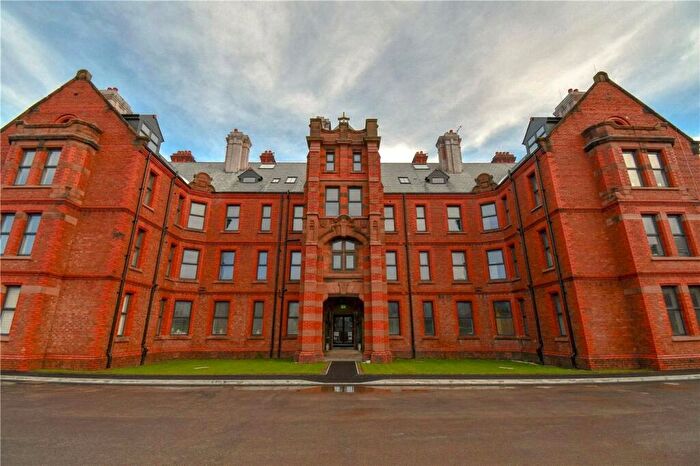
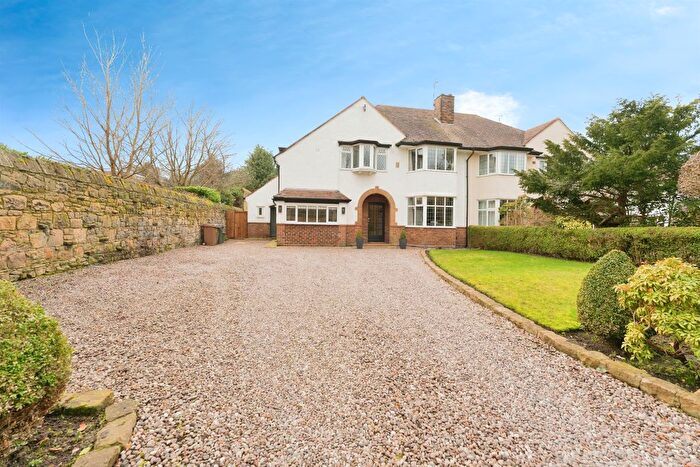
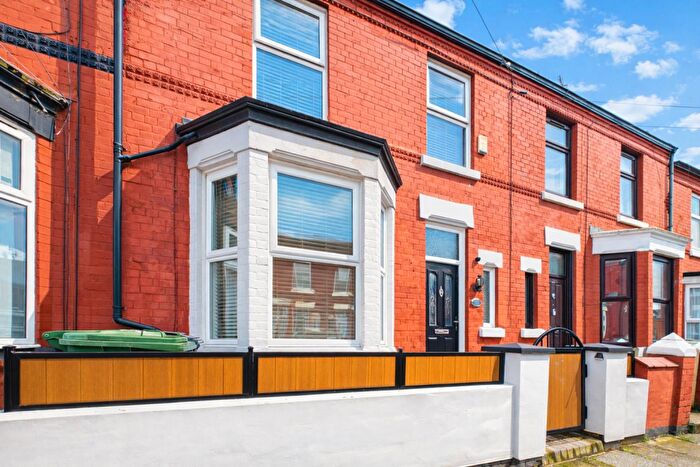
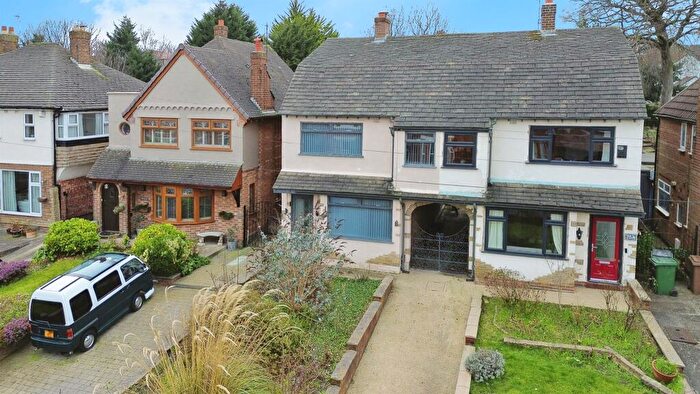
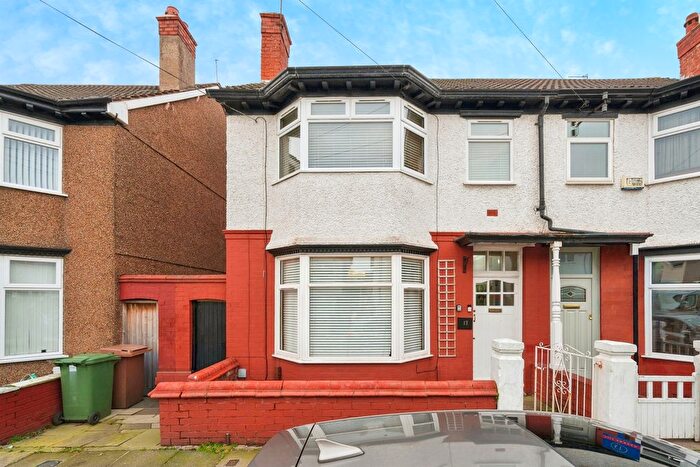
Properties in Wallasey have an average house price of £179,398.00 and had 2,584 Property Transactions within the last 3 years.¹
Wallasey is an area in Wirral with 26,869 households², where the most expensive property was sold for £1,120,000.00.
Properties for sale in Wallasey
Neighbourhoods in Wallasey
Navigate through our locations to find the location of your next house in Wallasey, Wirral for sale or to rent.
Transport in Wallasey
Please see below transportation links in this area:
-
Wallasey Village Station
-
New Brighton Station
-
Wallasey Grove Road Station
-
Birkenhead North Station
-
Bidston Station
-
Birkenhead Park Station
-
Conway Park Station
-
Sandhills Station
-
Birkenhead Hamilton Square Station
-
Moorfields Station
- FAQ
- Price Paid By Year
- Property Type Price
Frequently asked questions about Wallasey
What is the average price for a property for sale in Wallasey?
The average price for a property for sale in Wallasey is £179,398. This amount is 24% lower than the average price in Wirral. There are 4,610 property listings for sale in Wallasey.
What locations have the most expensive properties for sale in Wallasey?
The locations with the most expensive properties for sale in Wallasey are Wallasey at an average of £245,625, New Brighton at an average of £209,465 and Leasowe And Moreton East at an average of £187,954.
What locations have the most affordable properties for sale in Wallasey?
The locations with the most affordable properties for sale in Wallasey are Seacombe at an average of £112,711 and Liscard at an average of £162,348.
Which train stations are available in or near Wallasey?
Some of the train stations available in or near Wallasey are Wallasey Village, New Brighton and Wallasey Grove Road.
Property Price Paid in Wallasey by Year
The average sold property price by year was:
| Year | Average Sold Price | Price Change |
Sold Properties
|
|---|---|---|---|
| 2025 | £191,977 | 8% |
845 Properties |
| 2024 | £177,563 | 6% |
991 Properties |
| 2023 | £167,619 | -4% |
748 Properties |
| 2022 | £173,958 | 5% |
1,127 Properties |
| 2021 | £165,963 | 14% |
1,263 Properties |
| 2020 | £143,149 | 2% |
856 Properties |
| 2019 | £140,927 | 2% |
1,082 Properties |
| 2018 | £138,301 | 6% |
981 Properties |
| 2017 | £130,408 | 1% |
1,065 Properties |
| 2016 | £129,645 | 2% |
1,001 Properties |
| 2015 | £126,593 | 7% |
1,013 Properties |
| 2014 | £118,269 | 1% |
897 Properties |
| 2013 | £116,612 | 1% |
635 Properties |
| 2012 | £115,798 | -6% |
495 Properties |
| 2011 | £123,162 | -0,1% |
546 Properties |
| 2010 | £123,296 | 8% |
510 Properties |
| 2009 | £113,249 | -6% |
485 Properties |
| 2008 | £119,838 | -9% |
670 Properties |
| 2007 | £130,472 | 6% |
1,390 Properties |
| 2006 | £123,214 | 11% |
1,347 Properties |
| 2005 | £109,703 | 8% |
1,117 Properties |
| 2004 | £101,127 | 24% |
1,330 Properties |
| 2003 | £76,788 | 19% |
1,578 Properties |
| 2002 | £62,050 | 12% |
1,568 Properties |
| 2001 | £54,747 | 9% |
1,364 Properties |
| 2000 | £49,600 | 9% |
1,375 Properties |
| 1999 | £44,986 | 3% |
1,273 Properties |
| 1998 | £43,650 | 7% |
1,185 Properties |
| 1997 | £40,675 | 1% |
936 Properties |
| 1996 | £40,210 | 1% |
923 Properties |
| 1995 | £39,634 | - |
901 Properties |
Property Price per Property Type in Wallasey
Here you can find historic sold price data in order to help with your property search.
The average Property Paid Price for specific property types in the last three years are:
| Property Type | Average Sold Price | Sold Properties |
|---|---|---|
| Semi Detached House | £224,907.00 | 957 Semi Detached Houses |
| Terraced House | £139,502.00 | 1,163 Terraced Houses |
| Detached House | £352,094.00 | 119 Detached Houses |
| Flat | £128,083.00 | 345 Flats |

