
Houses for sale & to rent in Hoylake And Meols, Wirral
House Prices in Hoylake And Meols
Properties in Hoylake And Meols have an average house price of £349,590.00 and had 778 Property Transactions within the last 3 years¹.
Hoylake And Meols is an area in Wirral, Wirral with 5,671 households², where the most expensive property was sold for £1,440,000.00.
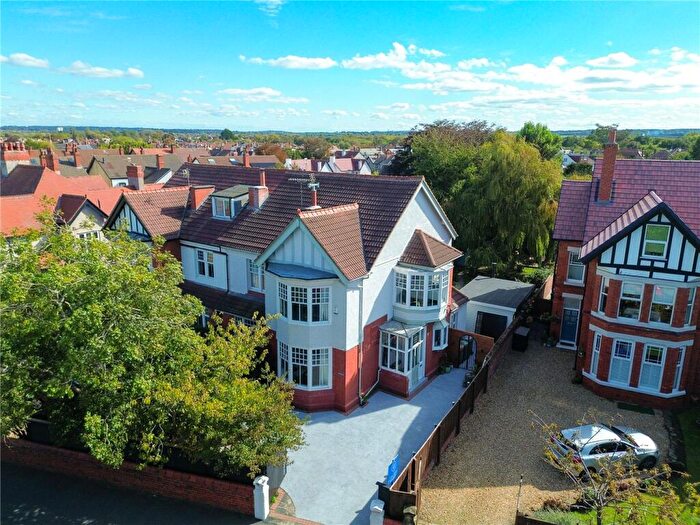
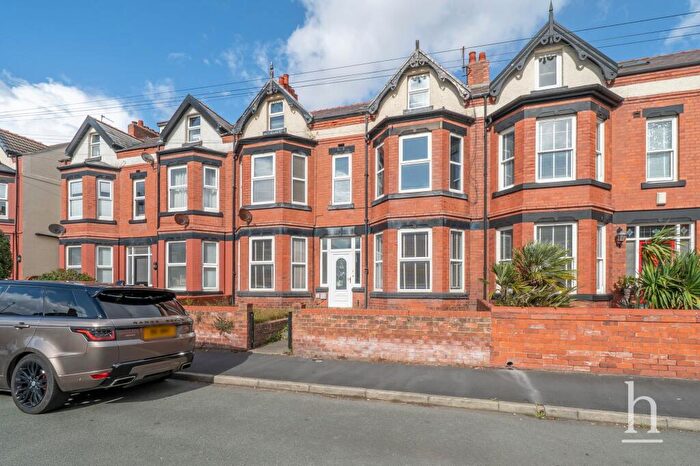
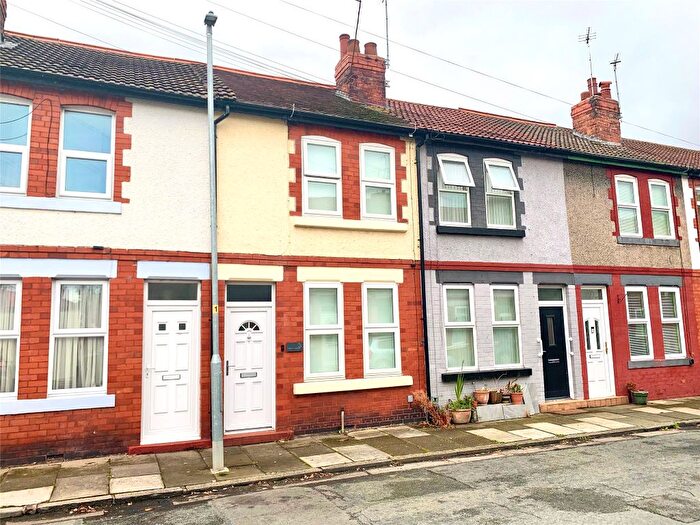
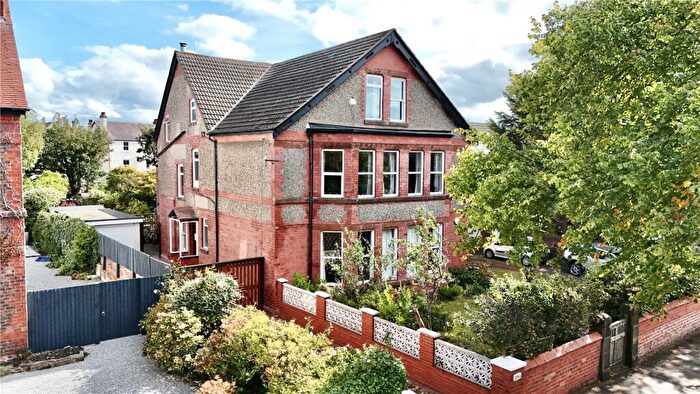
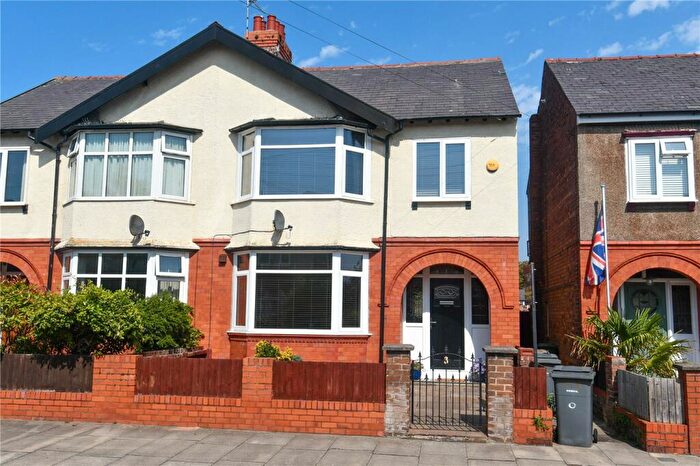
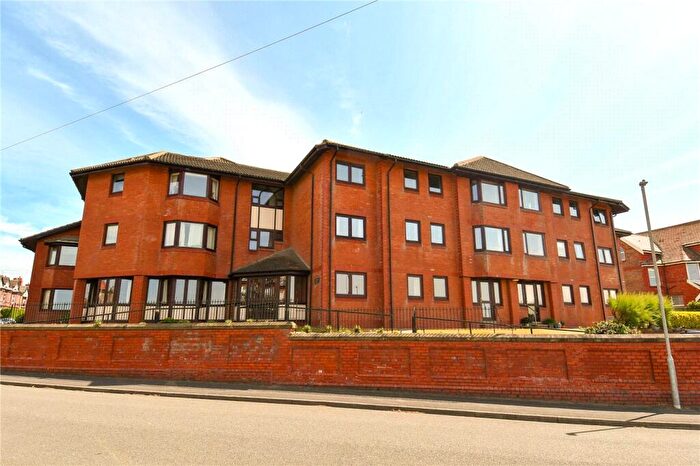
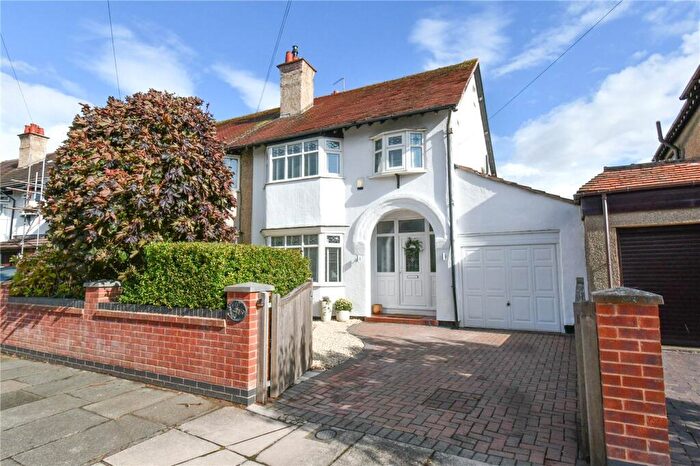
Properties for sale in Hoylake And Meols
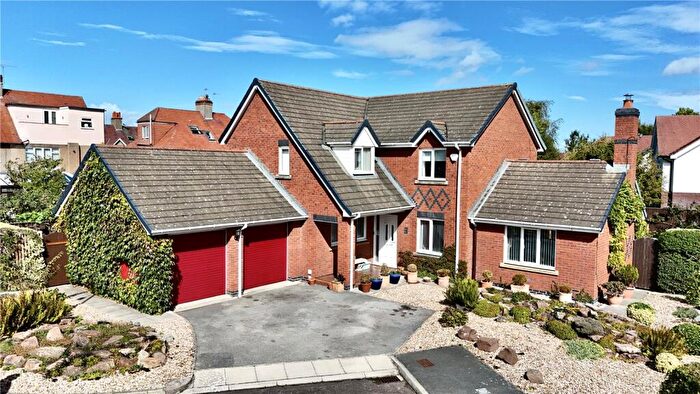
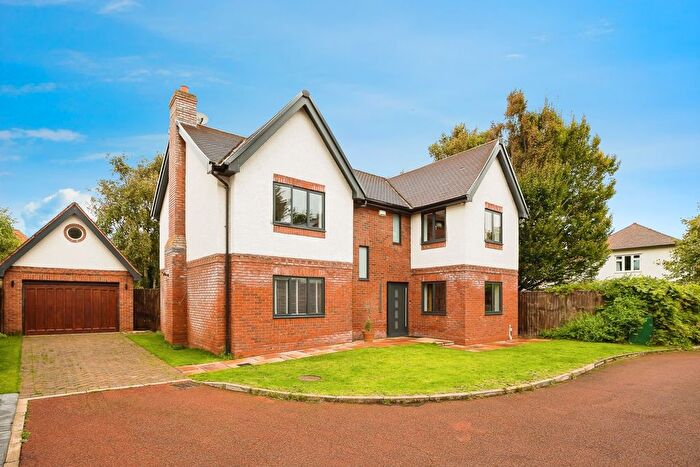
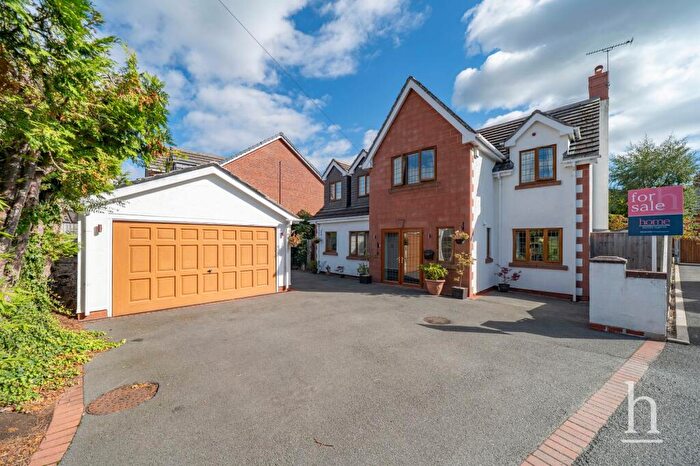
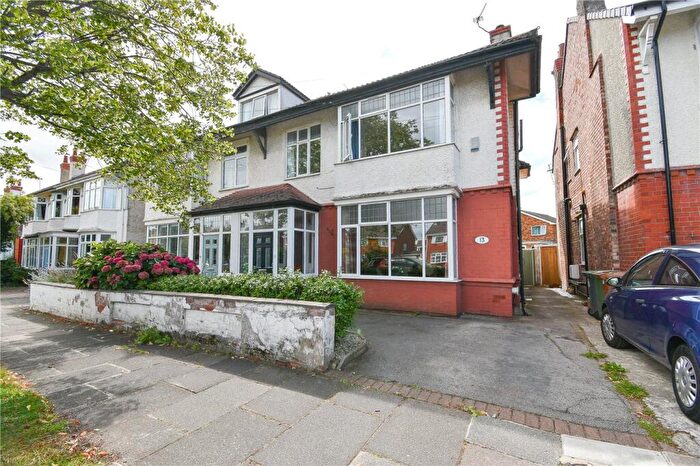
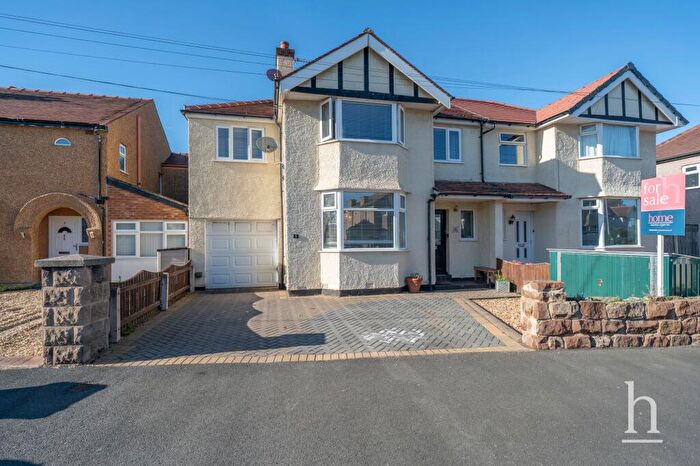
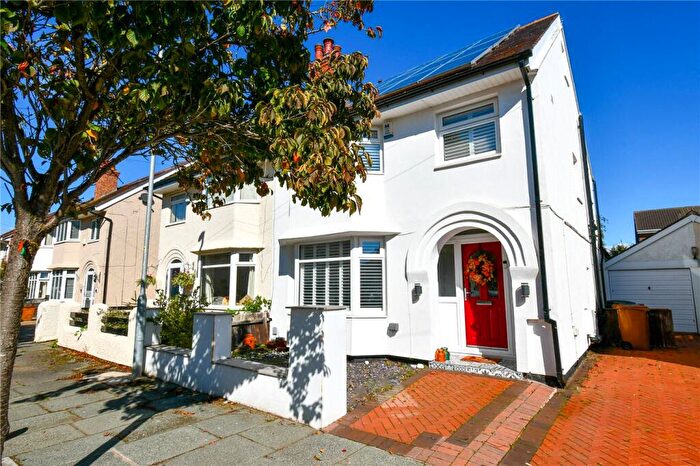
![]()
If you are looking to sell your house, let it out, or receive a property valuation, an expert can help you.
Click the button below to get started.


Roads and Postcodes in Hoylake And Meols
Navigate through our locations to find the location of your next house in Hoylake And Meols, Wirral for sale or to rent.
Transport near Hoylake And Meols

- FAQ
- Price Paid By Year
- Property Type Price
Frequently asked questions about Hoylake And Meols
What is the average price for a property for sale in Hoylake And Meols?
The average price for a property for sale in Hoylake And Meols is £349,590. This amount is 24% higher than the average price in Wirral. There are 2,489 property listings for sale in Hoylake And Meols.
What streets have the most expensive properties for sale in Hoylake And Meols?
The streets with the most expensive properties for sale in Hoylake And Meols are Leas Park at an average of £955,000, St Margarets Road at an average of £837,500 and Winnington Road at an average of £820,000.
What streets have the most affordable properties for sale in Hoylake And Meols?
The streets with the most affordable properties for sale in Hoylake And Meols are Albert Road at an average of £75,000, The Row at an average of £114,500 and Evans Road at an average of £161,833.
Which train stations are available in or near Hoylake And Meols?
Some of the train stations available in or near Hoylake And Meols are Manor Road, Hoylake and Meols.
Property Price Paid in Hoylake And Meols by Year
The average sold property price by year was:
| Year | Average Sold Price | Price Change |
Sold Properties
|
|---|---|---|---|
| 2025 | £347,801 | -3% |
92 Properties |
| 2024 | £358,548 | 1% |
214 Properties |
| 2023 | £355,199 | 5% |
203 Properties |
| 2022 | £338,844 | 1% |
269 Properties |
| 2021 | £334,126 | 13% |
348 Properties |
| 2020 | £291,464 | -7% |
226 Properties |
| 2019 | £312,437 | 14% |
233 Properties |
| 2018 | £269,610 | 0,2% |
275 Properties |
| 2017 | £269,050 | -5% |
288 Properties |
| 2016 | £282,515 | 13% |
261 Properties |
| 2015 | £246,605 | 0,1% |
243 Properties |
| 2014 | £246,426 | 11% |
291 Properties |
| 2013 | £219,676 | - |
259 Properties |
| 2012 | £219,624 | -1% |
203 Properties |
| 2011 | £222,103 | -7% |
188 Properties |
| 2010 | £238,190 | 9% |
189 Properties |
| 2009 | £216,009 | 4% |
199 Properties |
| 2008 | £207,803 | -13% |
176 Properties |
| 2007 | £234,279 | 1% |
301 Properties |
| 2006 | £231,643 | 9% |
308 Properties |
| 2005 | £211,193 | 9% |
223 Properties |
| 2004 | £192,985 | 14% |
341 Properties |
| 2003 | £165,362 | 18% |
323 Properties |
| 2002 | £135,306 | 16% |
396 Properties |
| 2001 | £113,061 | 18% |
350 Properties |
| 2000 | £92,918 | 5% |
372 Properties |
| 1999 | £88,681 | -1% |
385 Properties |
| 1998 | £89,398 | 17% |
330 Properties |
| 1997 | £74,367 | 7% |
273 Properties |
| 1996 | £69,347 | 4% |
289 Properties |
| 1995 | £66,403 | - |
211 Properties |
Property Price per Property Type in Hoylake And Meols
Here you can find historic sold price data in order to help with your property search.
The average Property Paid Price for specific property types in the last three years are:
| Property Type | Average Sold Price | Sold Properties |
|---|---|---|
| Semi Detached House | £391,147.00 | 226 Semi Detached Houses |
| Detached House | £623,586.00 | 129 Detached Houses |
| Terraced House | £275,667.00 | 171 Terraced Houses |
| Flat | £222,225.00 | 252 Flats |