
Houses for sale in Wirral, Wirral
House Prices in Wirral
Properties in Wirral have an average house price of £287k and had 7,352 Property Transactions within the last 3 years.¹
Wirral is an area in Wirral with 75,056 households², where the most expensive property was sold for £3.5M.
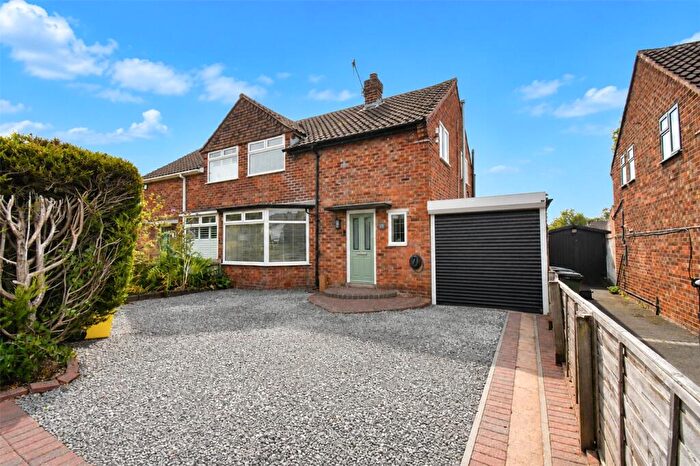
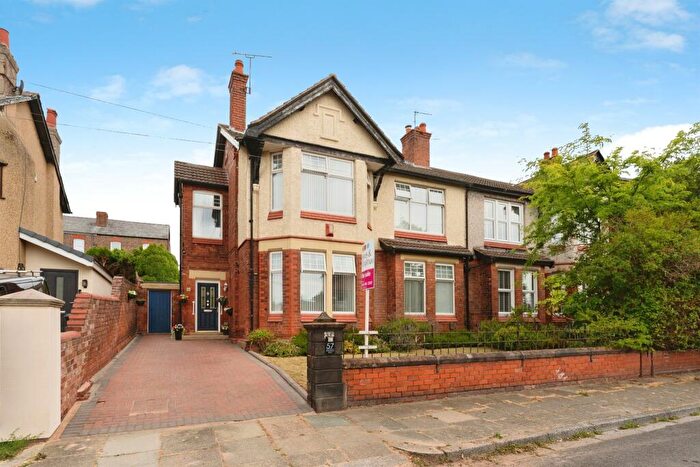
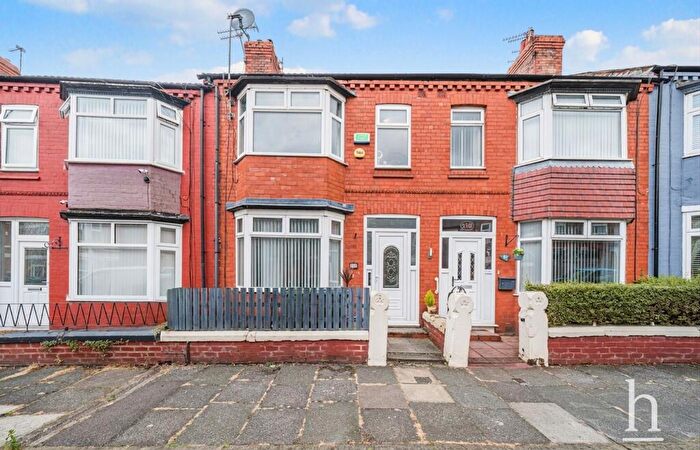
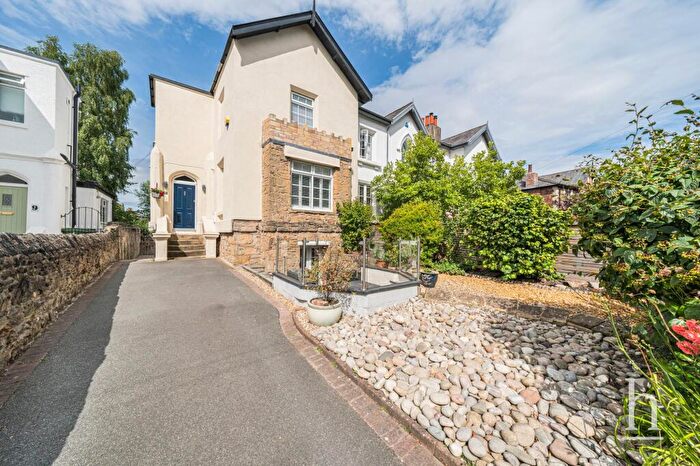
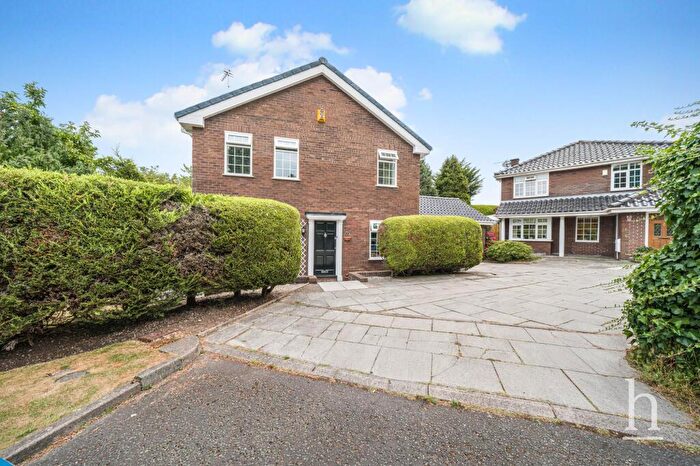
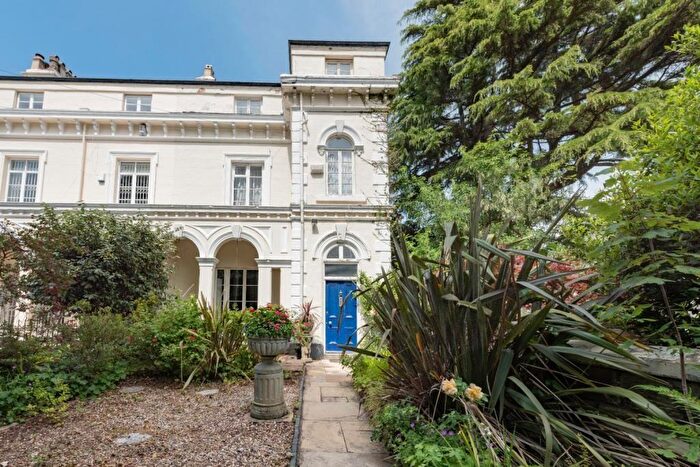
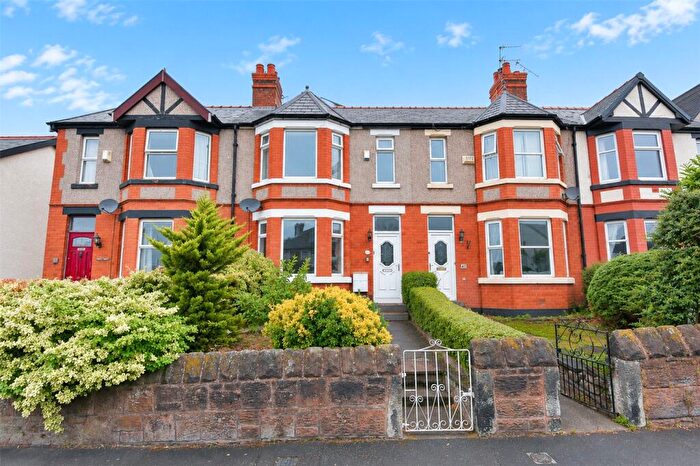
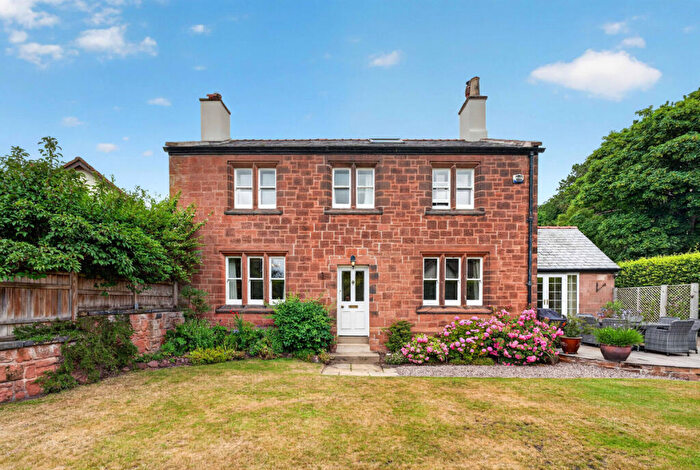
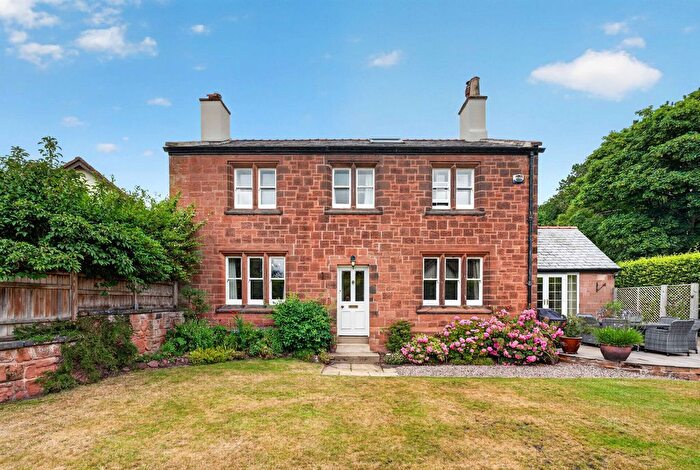
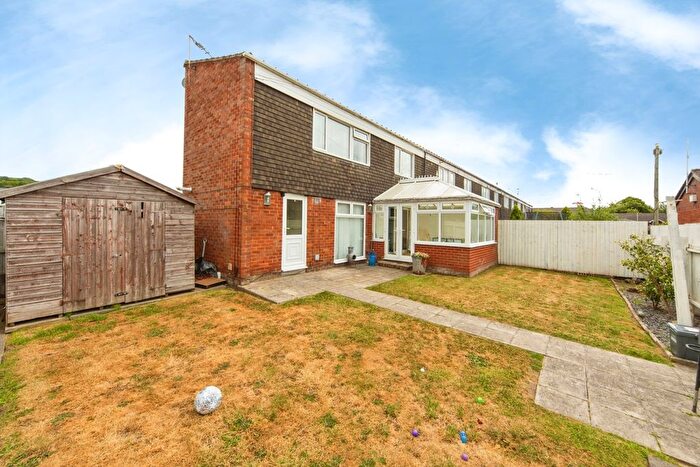
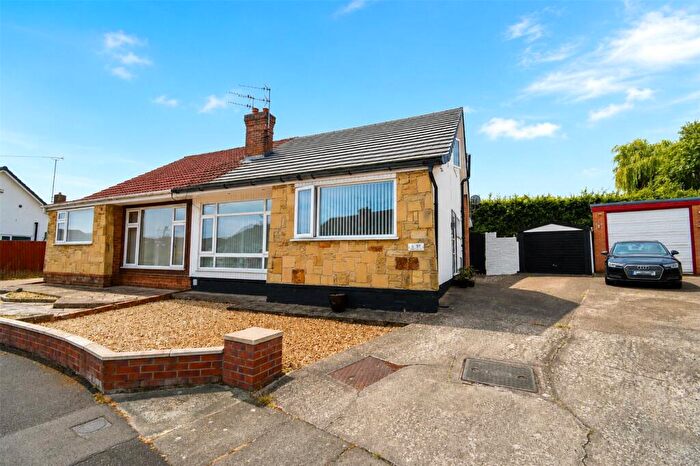
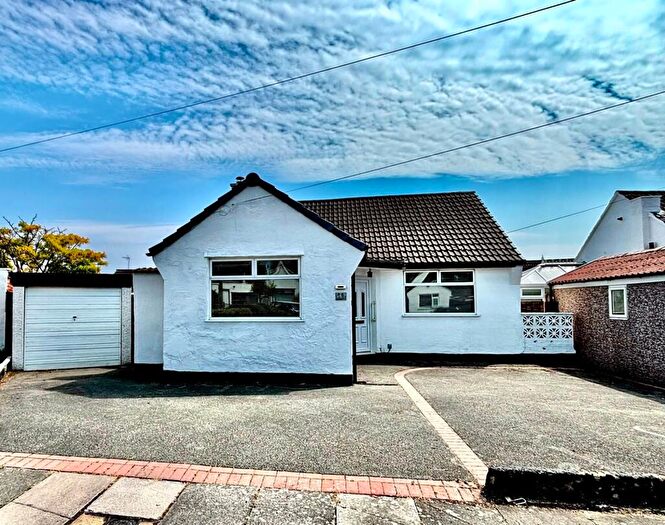
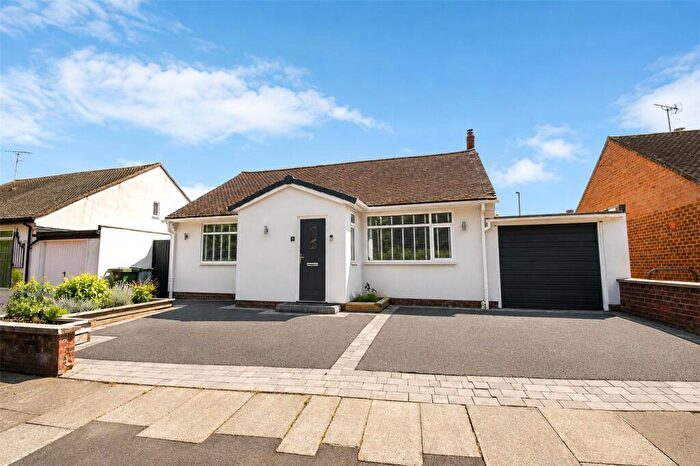
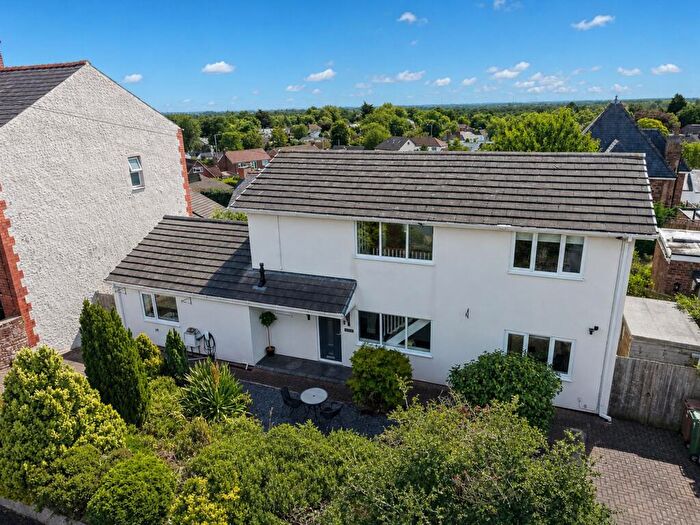
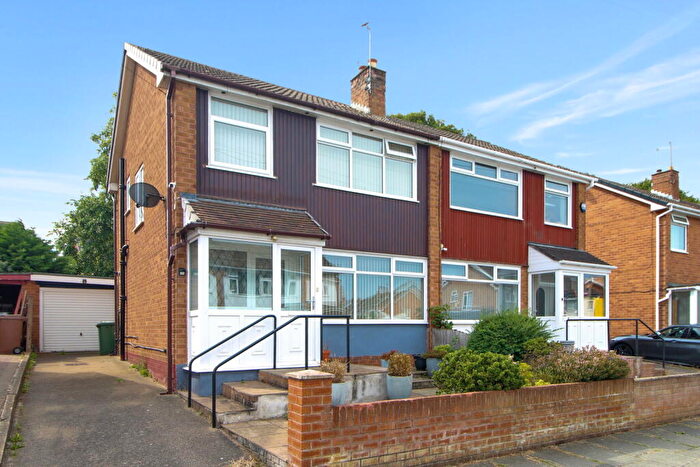
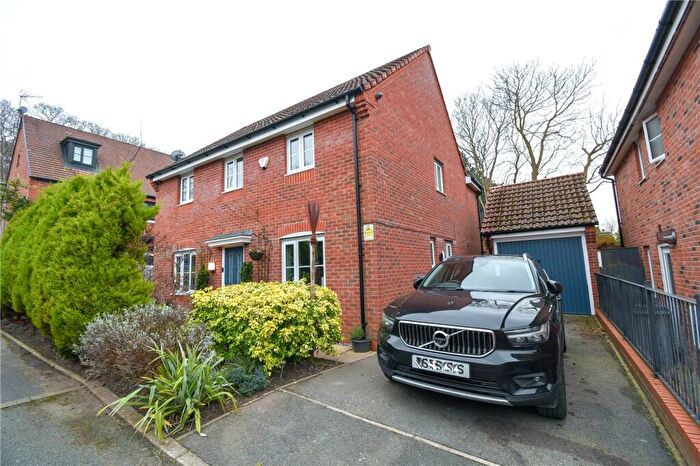
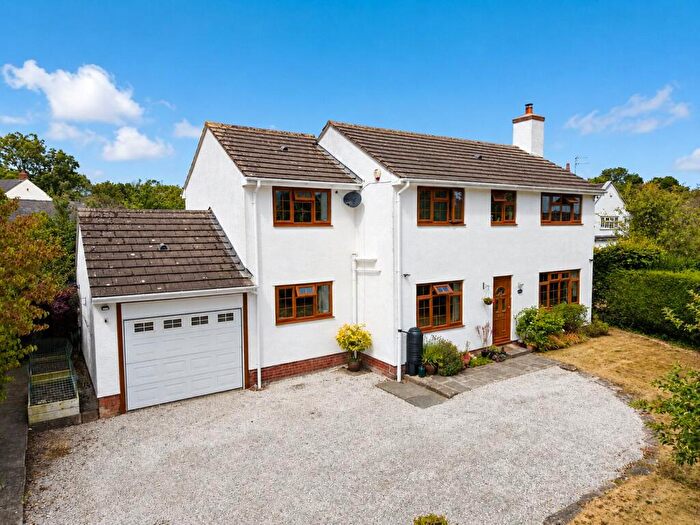
Properties for sale in Wirral
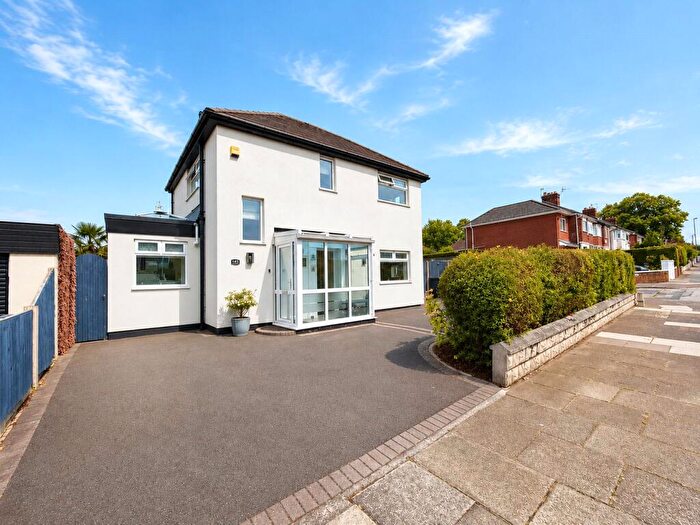
![]()
If you are looking to sell your house, let it out, or receive a property valuation, an expert can help you.
Click the button below to get started.
Neighbourhoods in Wirral
Navigate through our locations to find the location of your next house in Wirral, Wirral for sale or to rent.
Property price trends in Wirral
According to the latest Land Registry data, the average home in Wirral sold for £294,743 in 2026. That figure comes from a substantial record of 86,858 sales logged over the past 31 years.
Prices have moved up over the last three years. Compared with 2023, when the typical sale came in around £279,693, that's a rise of roughly 5.4%.
Looking back five years, average prices are up about 9.3% since 2021, a gain of around £24,968 in cash terms.
Zoom out to the past decade for the fuller picture. Back in 2016, homes here averaged £203,829, so the typical sold price has climbed about 44.6% since then, roughly 3.8% a year. Stretch the view to fifteen years and that annual pace eases back to about 3%.
Frequently asked questions about Wirral
What is the average price for a property for sale in Wirral?
The average price for a property for sale in Wirral is £287,248. This amount is 21% higher than the average price in Wirral. There are more than 10,000 property listings for sale in Wirral.
What locations have the most expensive properties for sale in Wirral?
The locations with the most expensive properties for sale in Wirral are Heswall at an average of £477,517, West Kirby And Thurstaston at an average of £467,379 and Hoylake And Meols at an average of £363,133.
What locations have the most affordable properties for sale in Wirral?
The locations with the most affordable properties for sale in Wirral are Leasowe And Moreton East at an average of £185,482, Bromborough at an average of £192,883 and Upton at an average of £204,851.
Which train stations are available in or near Wirral?
Some of the train stations available in or near Wirral are Upton, Heswall and Rock Ferry.
Property Price Paid in Wirral by Year
The average sold property price by year was:
| Year | Average Sold Price | Price Change |
Sold Properties
|
|---|---|---|---|
| 2026 | £294,743 | 1% |
174 Properties |
| 2025 | £292,683 | 2% |
2,450 Properties |
| 2024 | £288,064 | 3% |
2,521 Properties |
| 2023 | £279,693 | -1% |
2,207 Properties |
| 2022 | £281,986 | 4% |
2,833 Properties |
| 2021 | £269,775 | 8% |
3,490 Properties |
| 2020 | £249,475 | 10% |
2,550 Properties |
| 2019 | £225,600 | 5% |
2,821 Properties |
| 2018 | £213,782 | -4% |
3,015 Properties |
| 2017 | £221,298 | 8% |
3,077 Properties |
Property Price per Property Type in Wirral
Here you can find historic sold price data in order to help with your property search.
The average Property Paid Price for specific property types in the last three years are:
| Property Type | Average Sold Price | Sold Properties |
|---|---|---|
| Semi Detached House | £260,478.00 | 3,385 Semi Detached Houses |
| Terraced House | £191,385.00 | 1,387 Terraced Houses |
| Detached House | £468,649.00 | 1,752 Detached Houses |
| Flat | £173,440.00 | 828 Flats |
Transport in Wirral
Please see below transportation links in this area:
