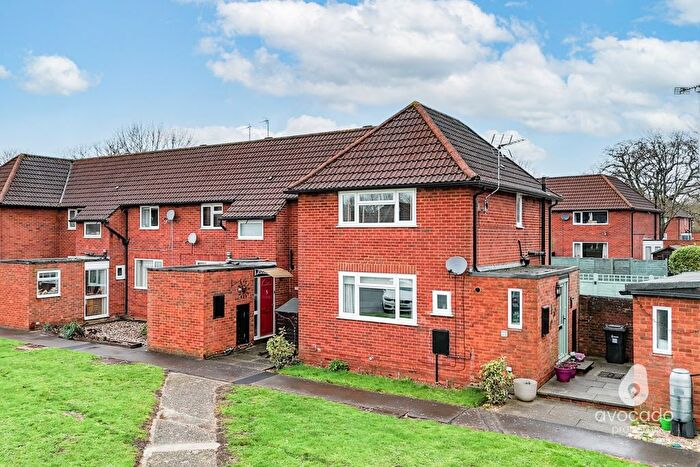
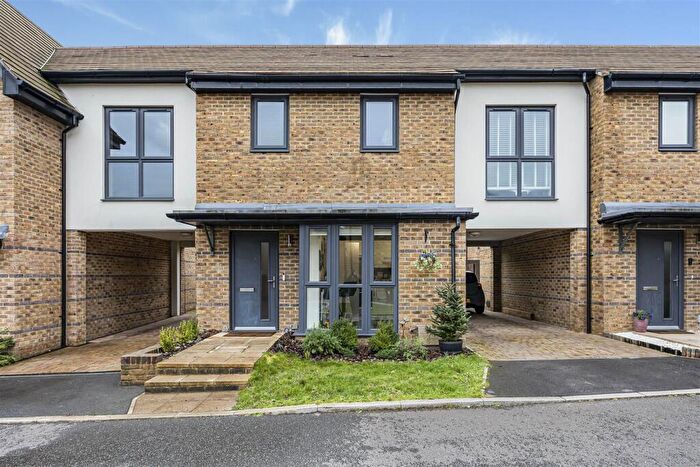
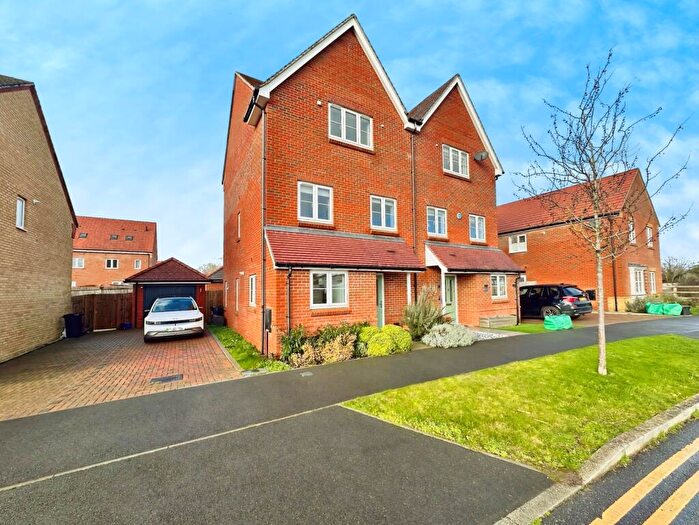
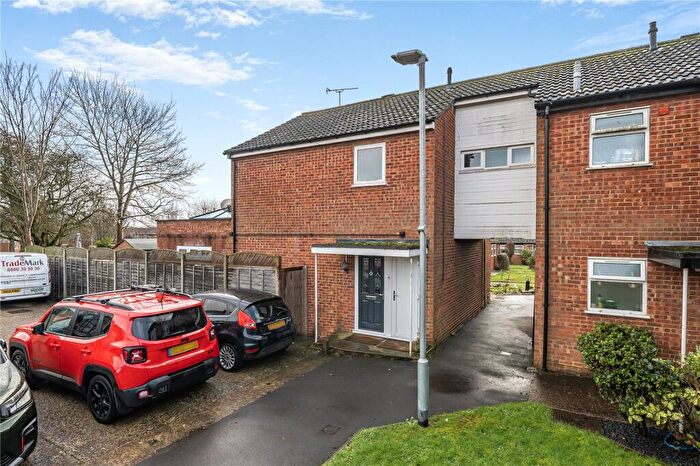
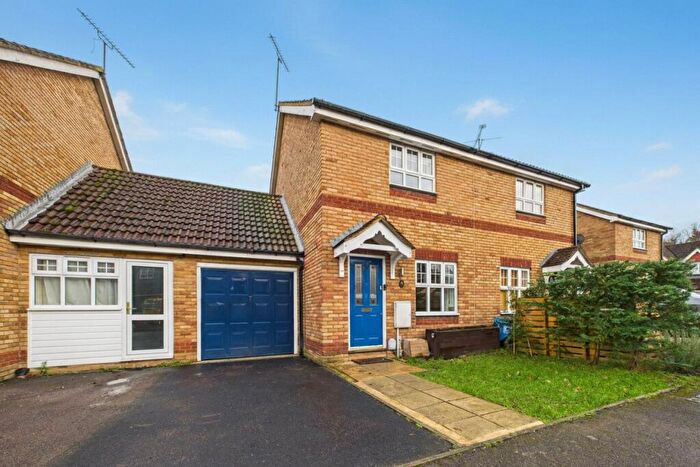
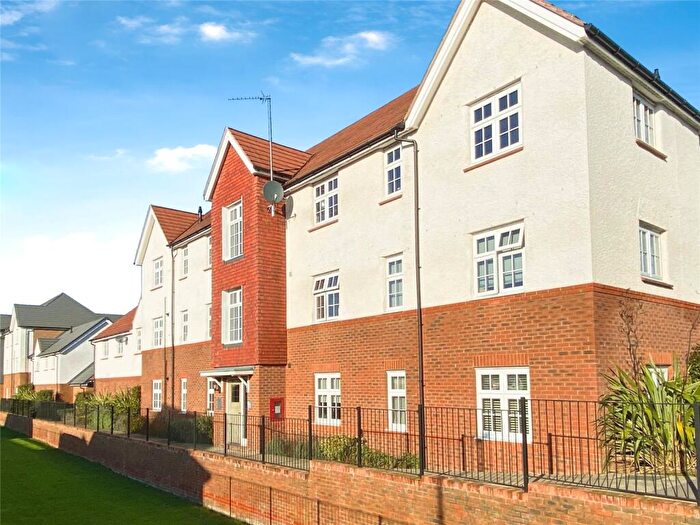
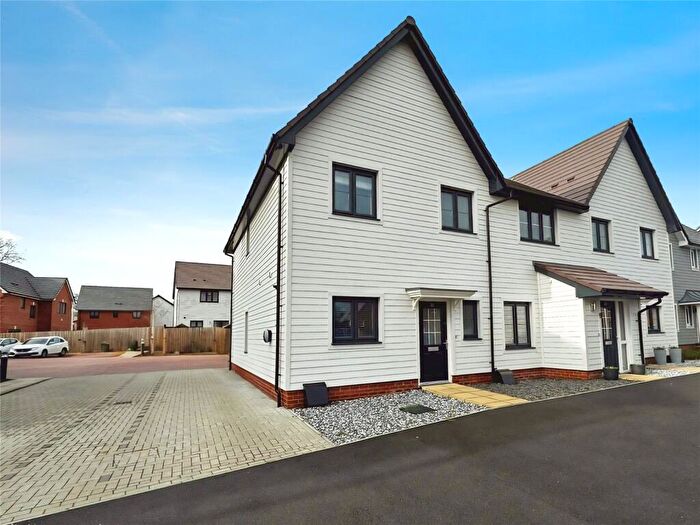
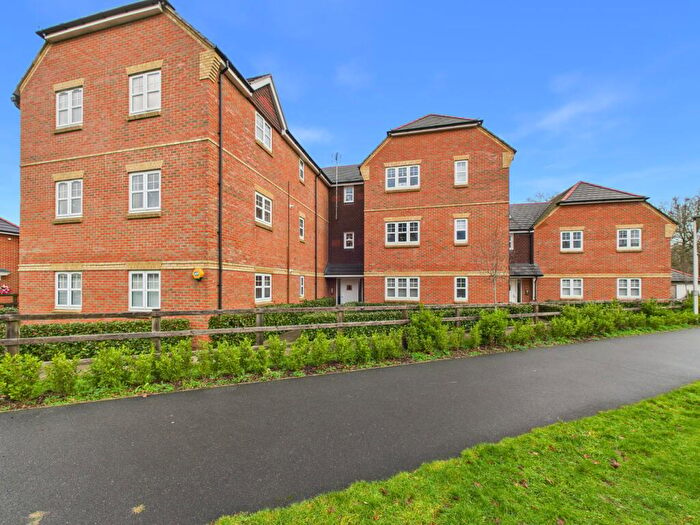
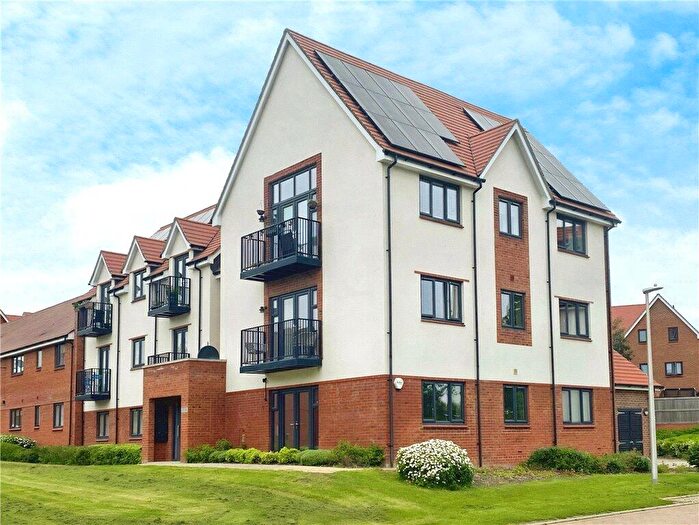
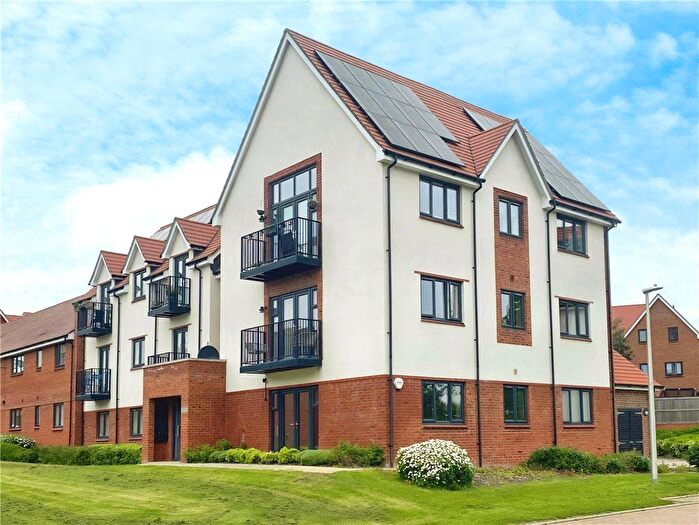
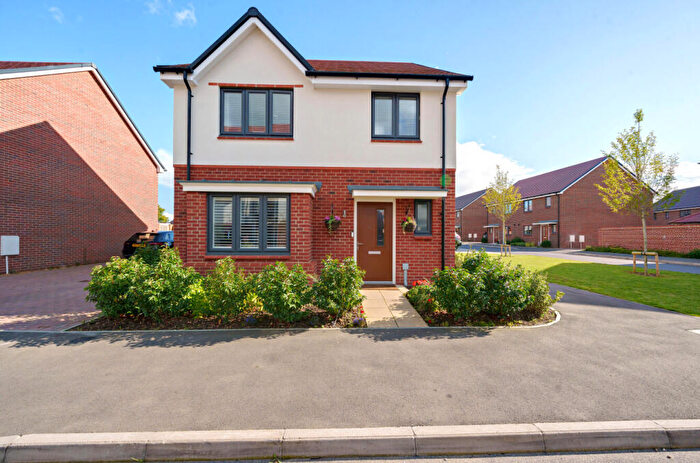
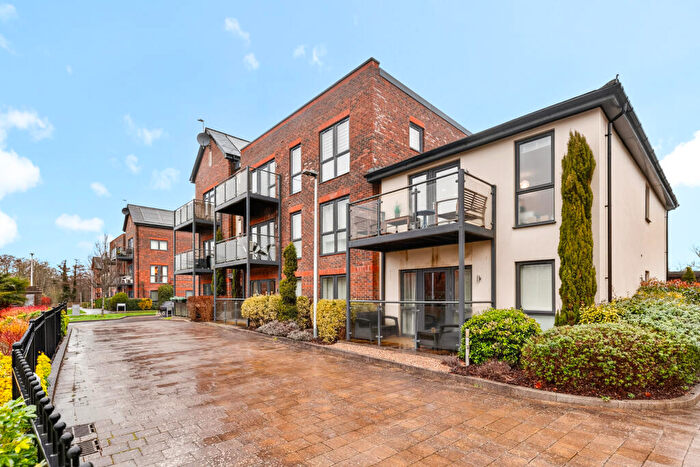
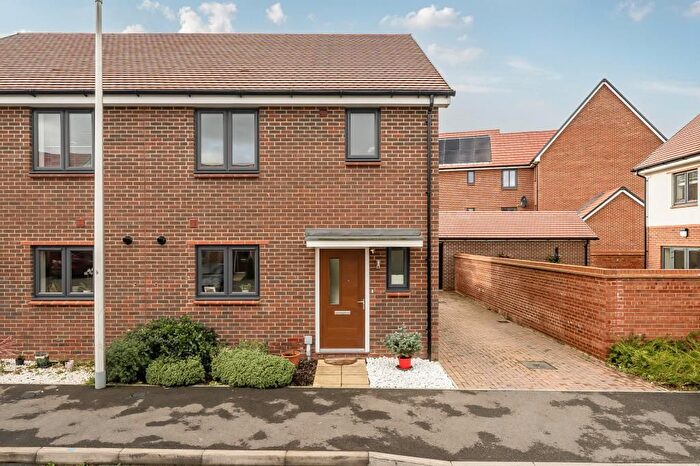
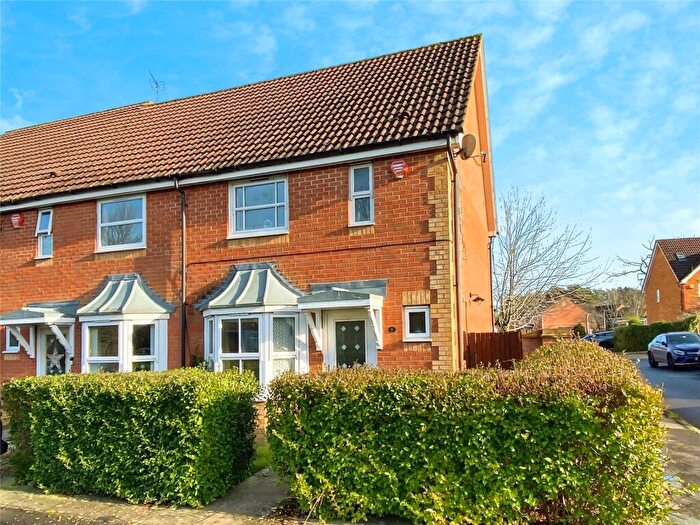
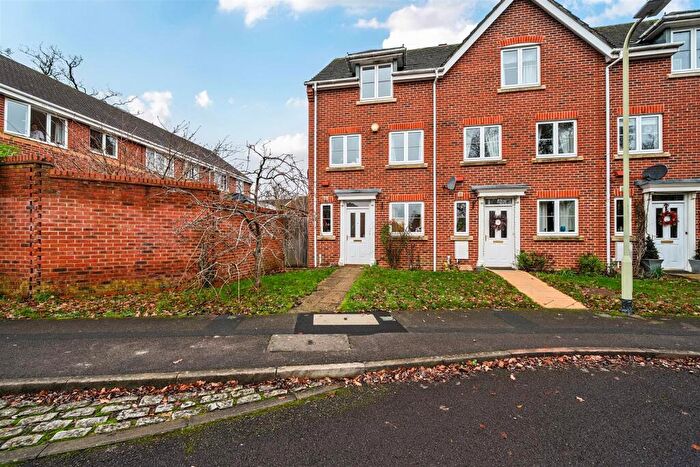
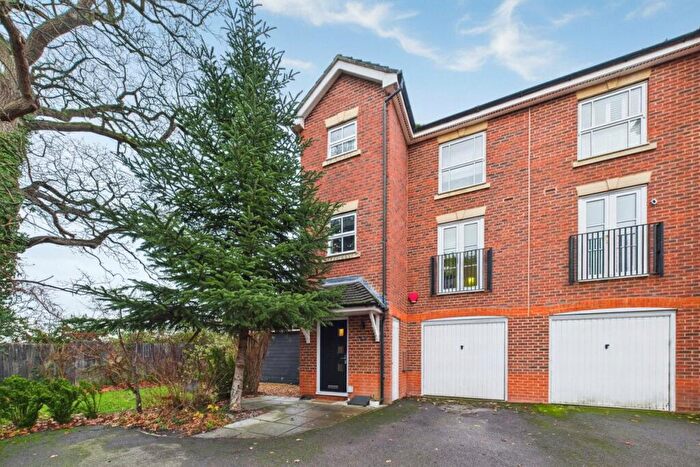
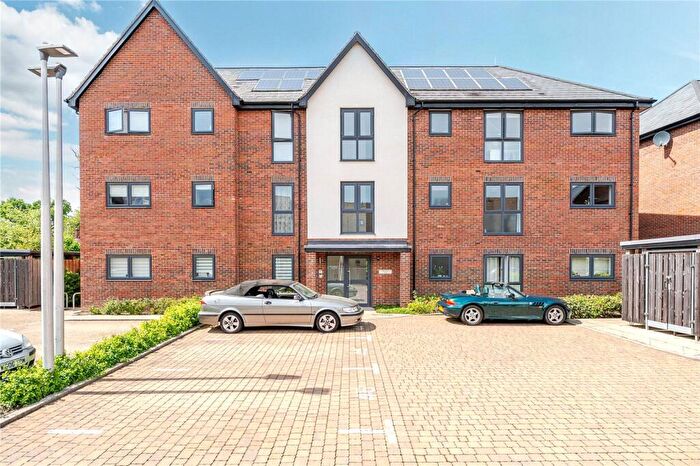
Houses for sale & to rent in Barkham, Reading
House Prices in Barkham
Properties in Barkham have an average house price of £386,182.00 and had 63 Property Transactions within the last 3 years¹.
Barkham is an area in Reading, Wokingham with 327 households², where the most expensive property was sold for £900,000.00.
Properties for sale in Barkham
Roads and Postcodes in Barkham
Navigate through our locations to find the location of your next house in Barkham, Reading for sale or to rent.
| Streets | Postcodes |
|---|---|
| Arborfield Green | RG2 9NH |
| Archer Grove | RG2 9TA RG2 9TB RG2 9TD |
| Baird Road | RG2 9YU |
| Baston Road | RG2 9YW RG2 9ZW |
| Biggs Lane | RG2 9LL RG2 9LN |
| Blacksmiths Way | RG2 9QP |
| Bramshill Close | RG2 9PT |
| Bridle Road | RG2 9QR RG2 9QT |
| Buttenshaw Avenue | RG2 9LY |
| Buttenshaw Close | RG2 9LX |
| Cook Way | RG2 9ZD RG2 9ZE RG2 9ZF RG2 9ZG |
| Crusader Close | RG2 9YX |
| Equestrian Court | RG2 9ZL RG2 9ZN RG2 9ZS |
| Fox Close | RG2 9TE |
| Gilbert Close | RG2 9QS |
| Hill Road | RG2 9LP |
| Hornbeam Place | RG2 9GL RG2 9GW |
| Lime Grove | RG2 9GP |
| Mandarin Grove | RG2 9WP RG2 9WQ RG2 9WR |
| Martingale Grove | RG2 9HD |
| Millard Place | RG2 9YN RG2 9YP RG2 9YQ RG2 9YR RG2 9YS |
| Oak Drive | RG2 9GJ RG2 9GS RG2 9GT RG2 9GU |
| Parsons Close | RG2 9NU |
| Pear Tree Close | RG2 9GQ |
| Pintail Place | RG2 9WN |
| Pinto Close | RG2 9GE |
| Princess Marina Drive | RG2 9QU RG2 9QW RG2 9QZ RG2 9SJ RG2 9GR RG2 9GX RG2 9GZ |
| Remount Drive | RG2 9GB |
| Saddle Place | RG2 9LJ |
| Sheerlands Road | RG2 9YT |
| Shelduck Drive | RG2 9WT RG2 9WS RG2 9WU RG2 9WW RG2 9WX |
| Sherman Avenue | RG2 9TF RG2 9TG RG2 9TJ |
| Stephenson Road | RG2 9NP |
| Stirrup Walk | RG2 9HL |
| Tope Crescent | RG2 9NA |
| Tope Road | RG2 9NB |
| Valon Road | RG2 9LT RG2 9QJ RG2 9QQ |
| Venning Road | RG2 9LU RG2 9QG |
| Victory Gardens | RG2 9BF RG2 9BH |
| RG2 9NN RG2 9TH RG2 9YY RG2 9YZ |
Transport near Barkham
-
Wokingham Station
-
Winnersh Station
-
Crowthorne Station
-
Winnersh Triangle Station
-
Earley Station
-
Sandhurst Station
- FAQ
- Price Paid By Year
- Property Type Price
Frequently asked questions about Barkham
What is the average price for a property for sale in Barkham?
The average price for a property for sale in Barkham is £386,182. This amount is 23% lower than the average price in Reading. There are 1,052 property listings for sale in Barkham.
What streets have the most expensive properties for sale in Barkham?
The streets with the most expensive properties for sale in Barkham are Pear Tree Close at an average of £885,000, Lime Grove at an average of £570,000 and Sherman Avenue at an average of £429,166.
What streets have the most affordable properties for sale in Barkham?
The streets with the most affordable properties for sale in Barkham are Oak Drive at an average of £278,750, Hornbeam Place at an average of £319,166 and Hill Road at an average of £323,750.
Which train stations are available in or near Barkham?
Some of the train stations available in or near Barkham are Wokingham, Winnersh and Crowthorne.
Property Price Paid in Barkham by Year
The average sold property price by year was:
| Year | Average Sold Price | Price Change |
Sold Properties
|
|---|---|---|---|
| 2025 | £420,576 | 21% |
26 Properties |
| 2024 | £330,727 | -23% |
22 Properties |
| 2023 | £407,900 | -12% |
15 Properties |
| 2022 | £457,686 | 18% |
45 Properties |
| 2021 | £376,363 | -3% |
46 Properties |
| 2020 | £386,159 | -40% |
79 Properties |
| 2019 | £541,600 | 5% |
59 Properties |
| 2018 | £514,112 | 13% |
56 Properties |
| 2017 | £445,814 | 31% |
74 Properties |
| 2016 | £306,586 | 17% |
23 Properties |
| 2015 | £253,705 | 7% |
17 Properties |
| 2014 | £236,325 | 18% |
18 Properties |
| 2013 | £194,184 | 9% |
13 Properties |
| 2012 | £177,143 | -7% |
24 Properties |
| 2011 | £188,937 | -2% |
16 Properties |
| 2010 | £191,781 | 6% |
8 Properties |
| 2009 | £180,711 | -11% |
9 Properties |
| 2008 | £199,950 | -6% |
10 Properties |
| 2007 | £212,625 | 17% |
12 Properties |
| 2006 | £177,192 | -1% |
20 Properties |
| 2005 | £178,480 | 5% |
18 Properties |
| 2004 | £169,856 | 7% |
22 Properties |
| 2003 | £157,742 | 9% |
14 Properties |
| 2002 | £143,412 | 8% |
12 Properties |
| 2001 | £132,535 | 16% |
60 Properties |
| 2000 | £111,370 | 15% |
79 Properties |
| 1998 | £94,983 | 1% |
3 Properties |
| 1997 | £93,750 | 29% |
2 Properties |
| 1996 | £66,500 | -6% |
2 Properties |
| 1995 | £70,650 | - |
3 Properties |
Property Price per Property Type in Barkham
Here you can find historic sold price data in order to help with your property search.
The average Property Paid Price for specific property types in the last three years are:
| Property Type | Average Sold Price | Sold Properties |
|---|---|---|
| Semi Detached House | £424,033.00 | 15 Semi Detached Houses |
| Detached House | £566,979.00 | 12 Detached Houses |
| Terraced House | £361,850.00 | 15 Terraced Houses |
| Flat | £273,214.00 | 21 Flats |

