
Houses for sale & to rent in Finchampstead South, Wokingham
House Prices in Finchampstead South
Properties in Finchampstead South have an average house price of £853k and had 165 Property Transactions within the last 3 years¹.
Finchampstead South is an area in Wokingham, Wokingham with 1,996 households², where the most expensive property was sold for £6.1M.
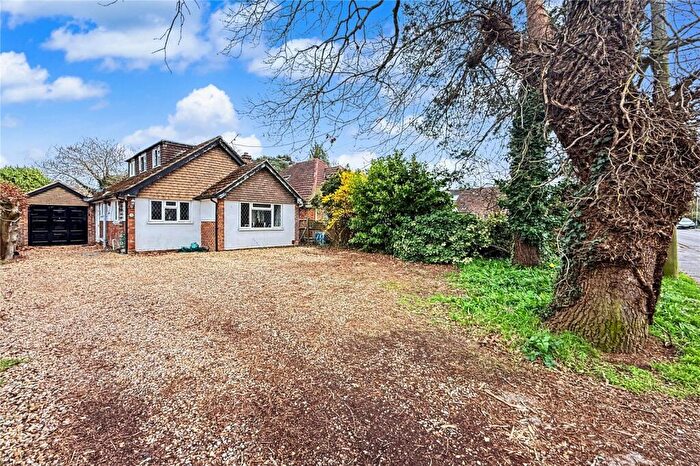
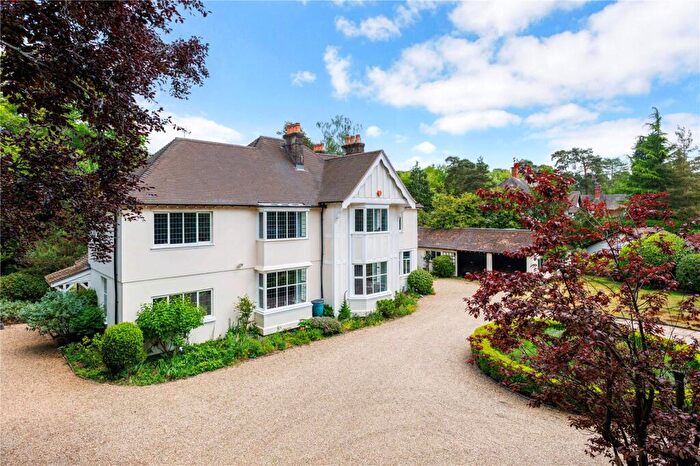
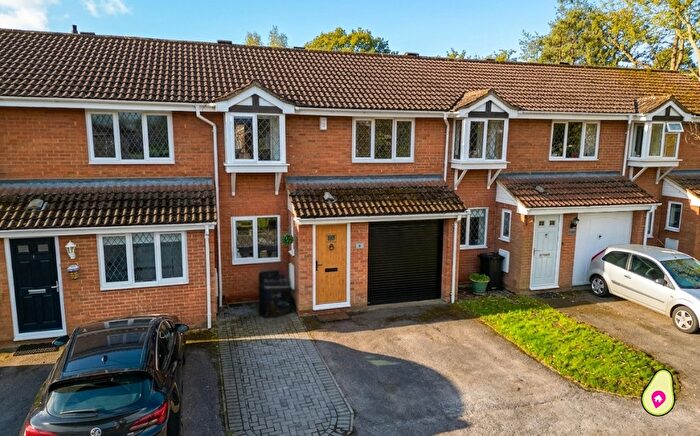
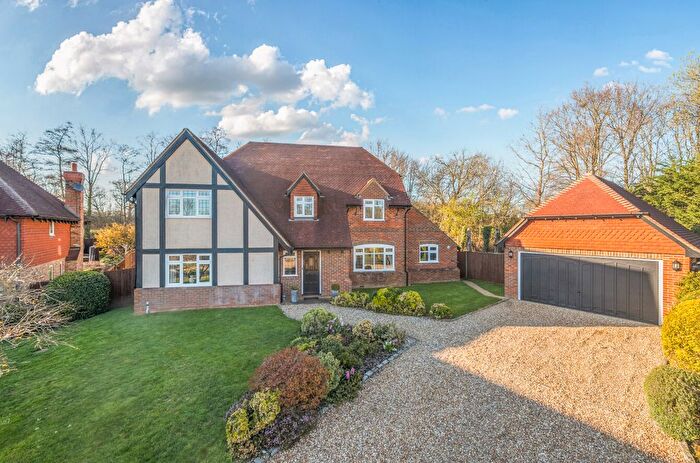
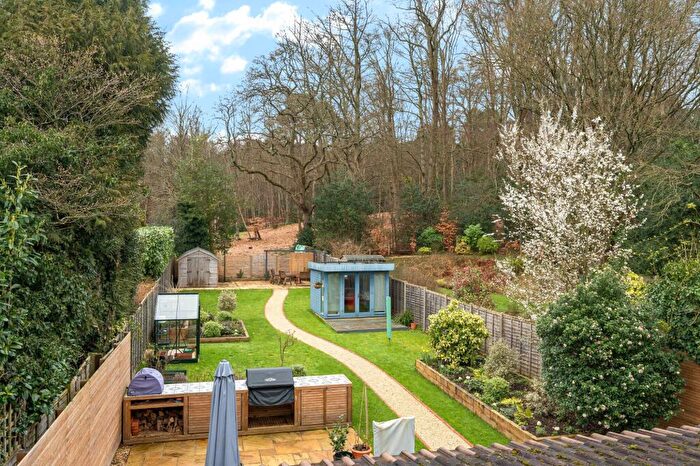
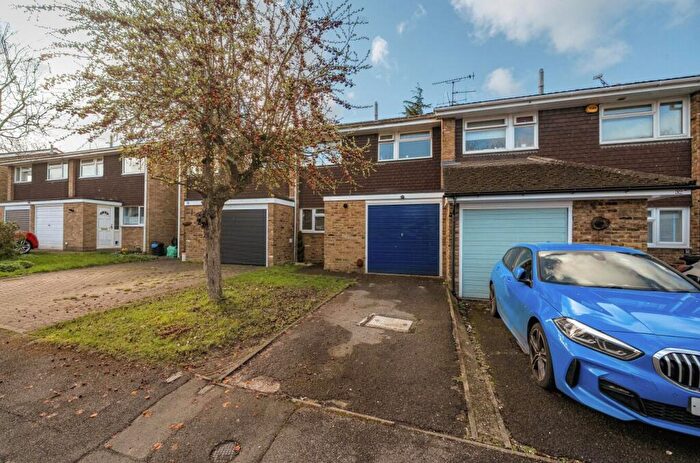
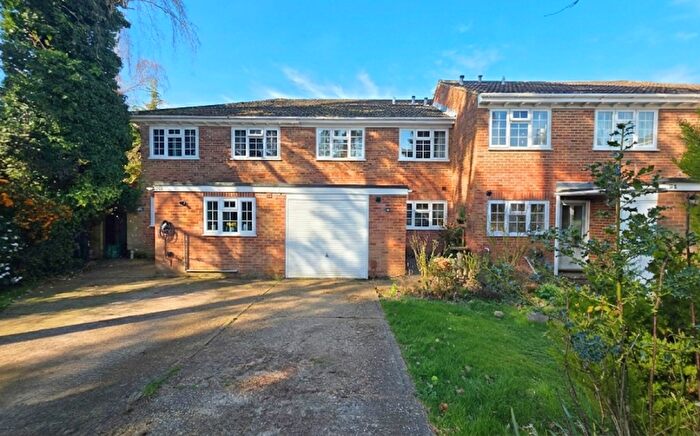
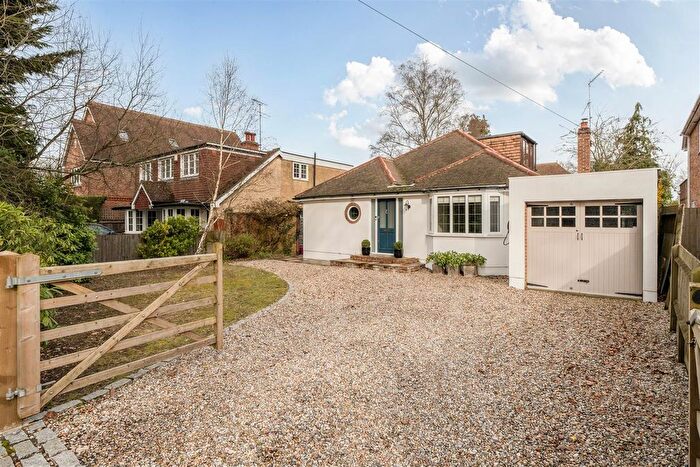
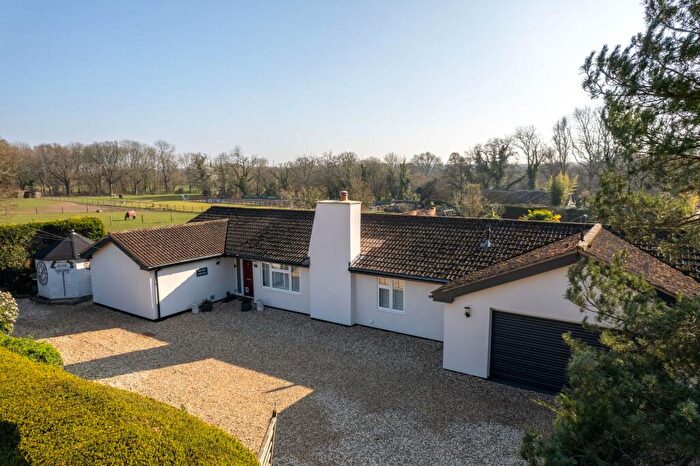
Properties for sale in Finchampstead South
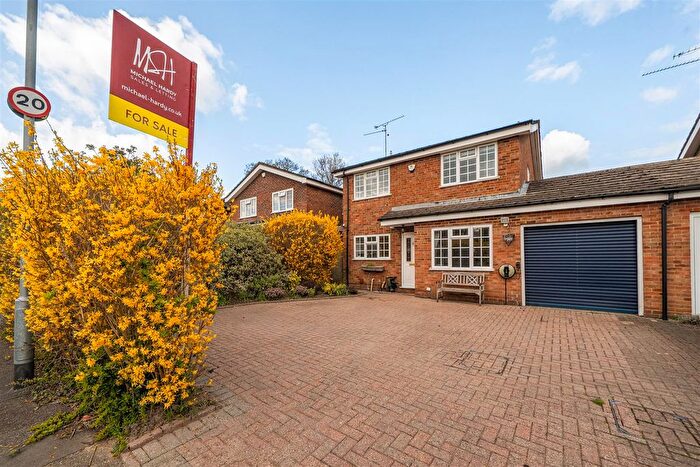
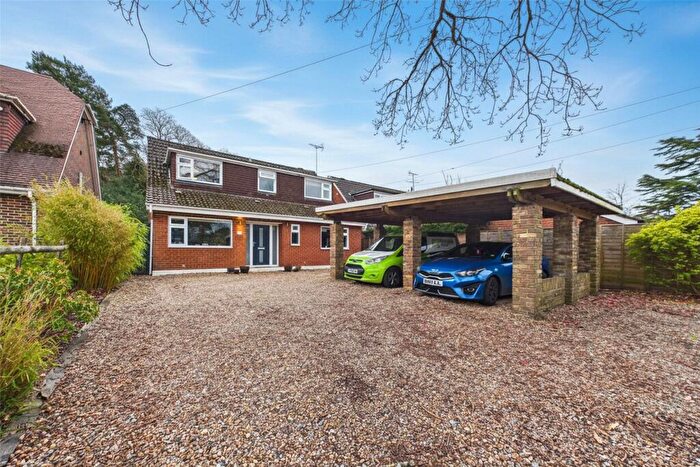
![]()
If you are looking to sell your house, let it out, or receive a property valuation, an expert can help you.
Click the button below to get started.


Roads and Postcodes in Finchampstead South
Navigate through our locations to find the location of your next house in Finchampstead South, Wokingham for sale or to rent.
Transport near Finchampstead South
-
 Crowthorne Station
 -
Wokingham Station
-
Sandhurst Station
-
Winnersh Station
-
Winnersh Triangle Station
-
Blackwater Station
- FAQ
- Price Paid By Year
- Property Type Price
Frequently asked questions about Finchampstead South
What is the average price for a property for sale in Finchampstead South?
The average price for a property for sale in Finchampstead South is £852,638. This amount is 57% higher than the average price in Wokingham. There are 1,558 property listings for sale in Finchampstead South.
What streets have the most expensive properties for sale in Finchampstead South?
The streets with the most expensive properties for sale in Finchampstead South are The Ridges at an average of £2,185,000, White Horse Lane at an average of £1,830,000 and Burnmoor Meadow at an average of £1,700,000.
What streets have the most affordable properties for sale in Finchampstead South?
The streets with the most affordable properties for sale in Finchampstead South are Billing Avenue at an average of £310,000, Orbit Close at an average of £323,750 and Woodmoor at an average of £330,000.
Which train stations are available in or near Finchampstead South?
Some of the train stations available in or near Finchampstead South are Crowthorne, Wokingham and Sandhurst.
Property Price Paid in Finchampstead South by Year
The average sold property price by year was:
| Year | Average Sold Price | Price Change |
Sold Properties
|
|---|---|---|---|
| 2025 | £839,885 | -2% |
53 Properties |
| 2024 | £860,787 | 1% |
61 Properties |
| 2023 | £856,143 | 24% |
51 Properties |
| 2022 | £647,697 | 5% |
71 Properties |
| 2021 | £615,834 | -6% |
96 Properties |
| 2020 | £652,675 | 11% |
80 Properties |
| 2019 | £579,886 | -8% |
75 Properties |
| 2018 | £623,717 | 2% |
52 Properties |
| 2017 | £608,797 | -1% |
67 Properties |
| 2016 | £612,162 | 15% |
74 Properties |
| 2015 | £518,285 | 7% |
55 Properties |
| 2014 | £483,512 | 5% |
78 Properties |
| 2013 | £457,876 | 7% |
71 Properties |
| 2012 | £426,716 | -4% |
53 Properties |
| 2011 | £444,986 | 3% |
63 Properties |
| 2010 | £430,665 | 3% |
66 Properties |
| 2009 | £417,871 | 0,4% |
63 Properties |
| 2008 | £416,382 | -3% |
46 Properties |
| 2007 | £429,840 | - |
95 Properties |
| 2006 | £429,831 | 19% |
100 Properties |
| 2005 | £346,604 | -9% |
106 Properties |
| 2004 | £378,785 | 11% |
104 Properties |
| 2003 | £336,122 | 7% |
95 Properties |
| 2002 | £311,377 | 1% |
109 Properties |
| 2001 | £308,426 | 6% |
105 Properties |
| 2000 | £289,539 | 17% |
104 Properties |
| 1999 | £240,921 | 15% |
120 Properties |
| 1998 | £204,370 | 15% |
98 Properties |
| 1997 | £173,104 | 13% |
121 Properties |
| 1996 | £149,888 | -20% |
97 Properties |
| 1995 | £179,759 | - |
81 Properties |
Property Price per Property Type in Finchampstead South
Here you can find historic sold price data in order to help with your property search.
The average Property Paid Price for specific property types in the last three years are:
| Property Type | Average Sold Price | Sold Properties |
|---|---|---|
| Flat | £503,700.00 | 6 Flats |
| Semi Detached House | £524,093.00 | 16 Semi Detached Houses |
| Detached House | £980,608.00 | 126 Detached Houses |
| Terraced House | £336,529.00 | 17 Terraced Houses |