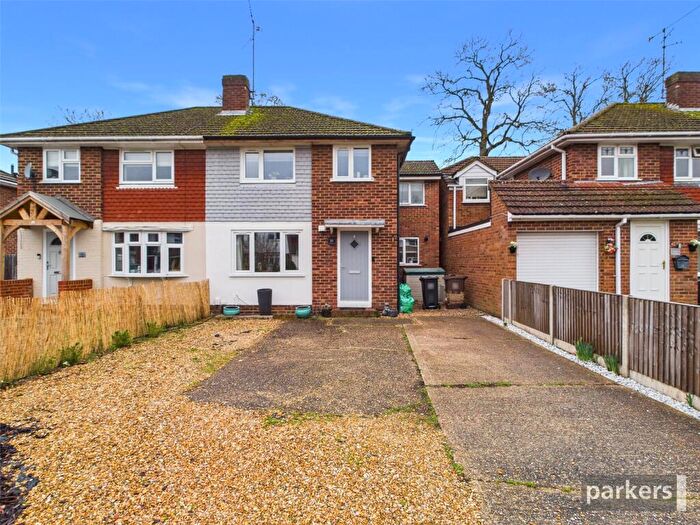
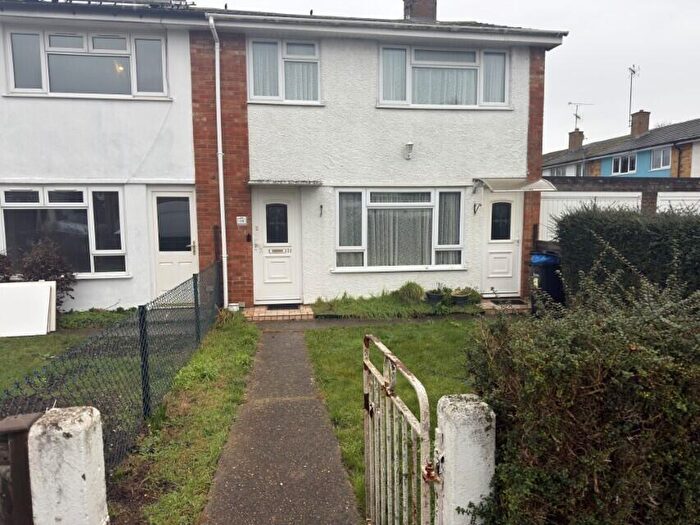
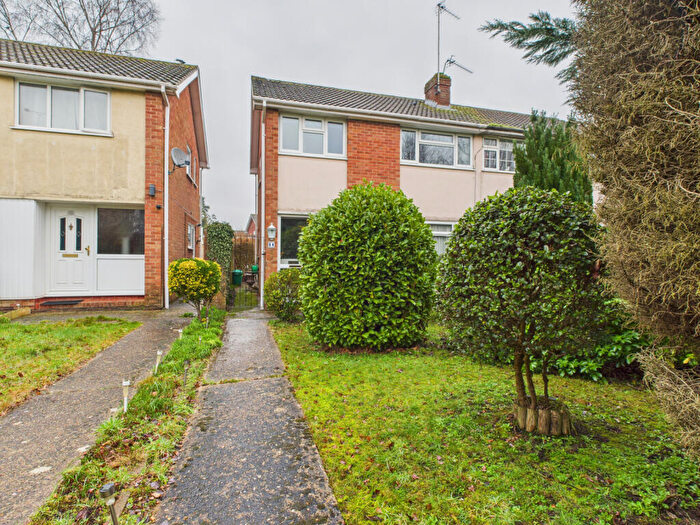
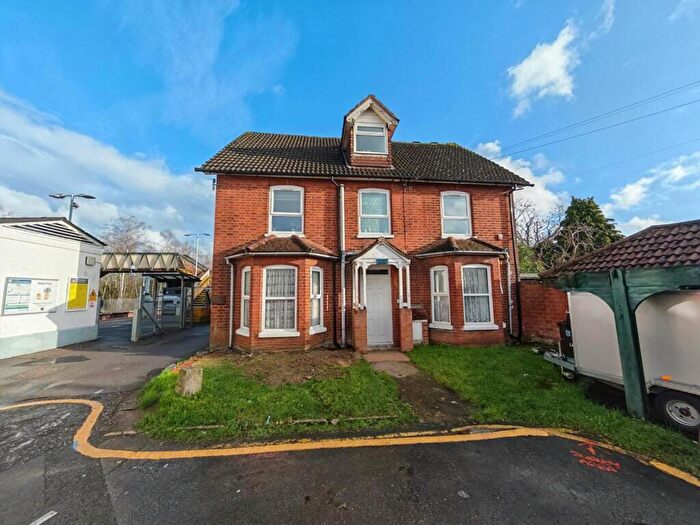
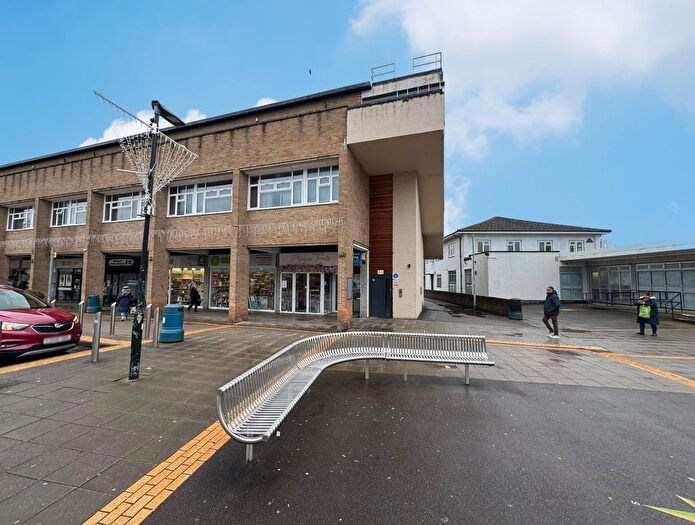
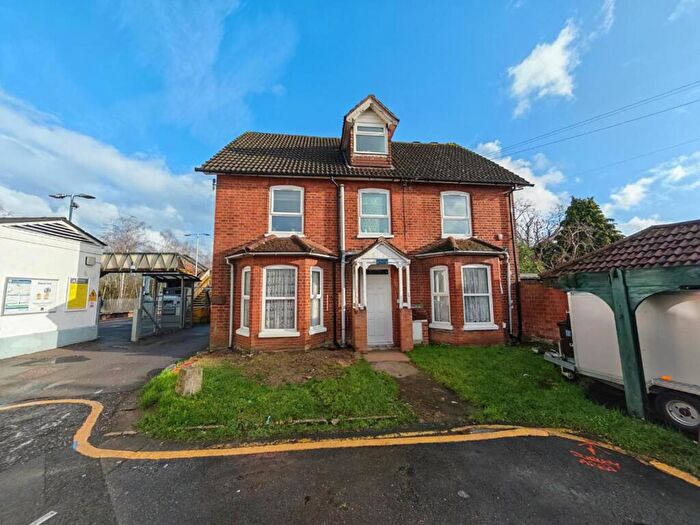
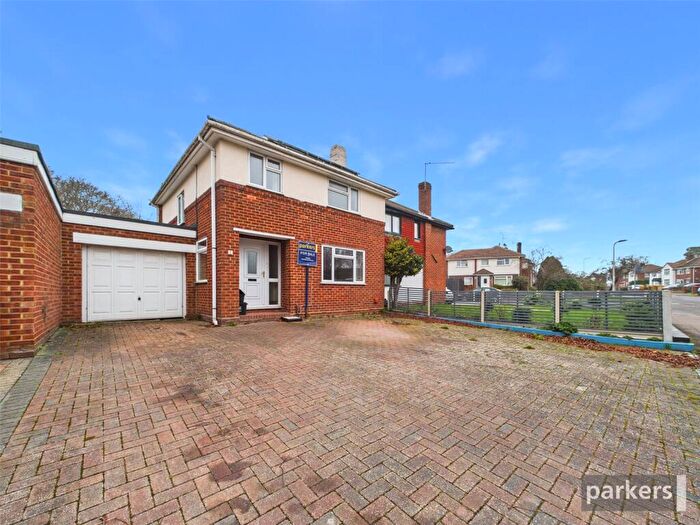
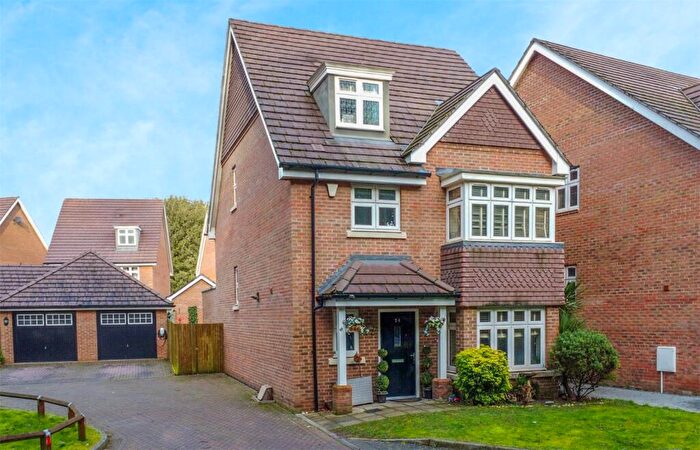
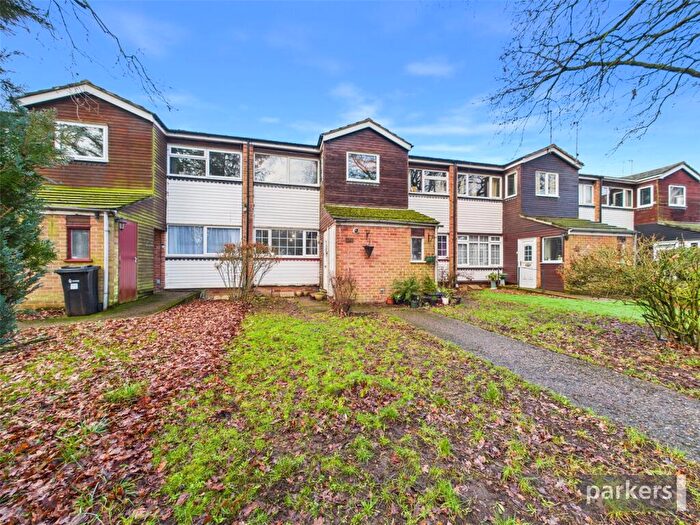
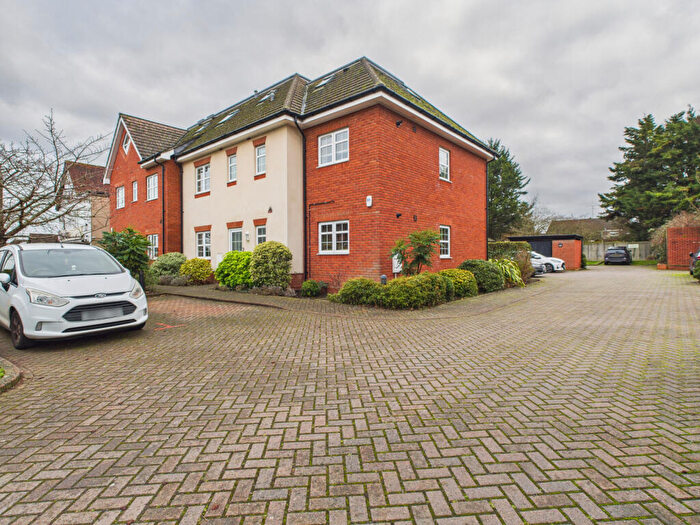
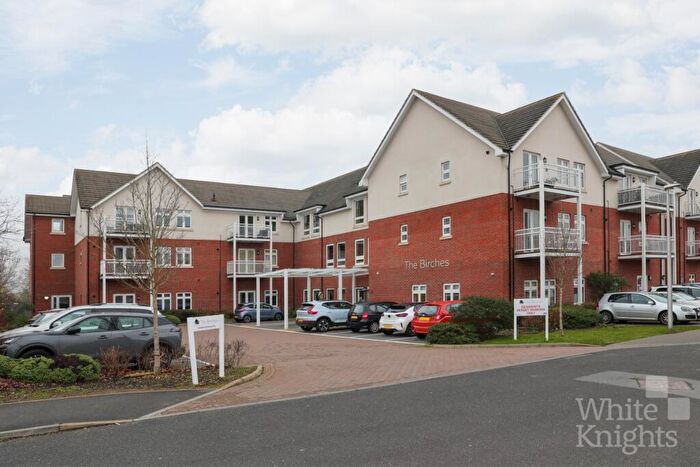
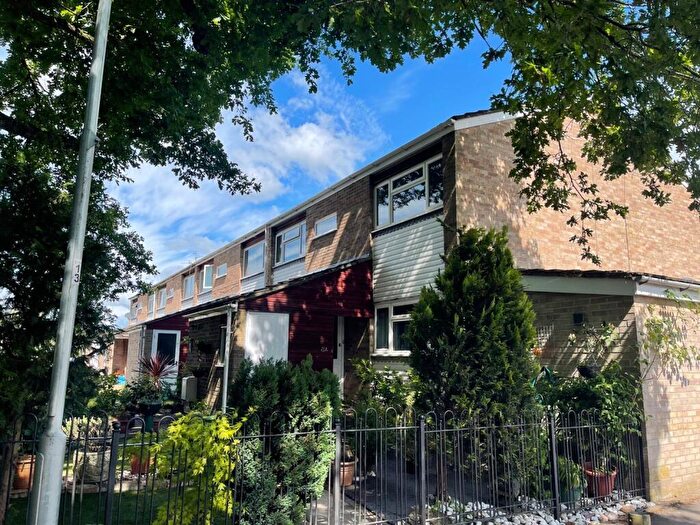
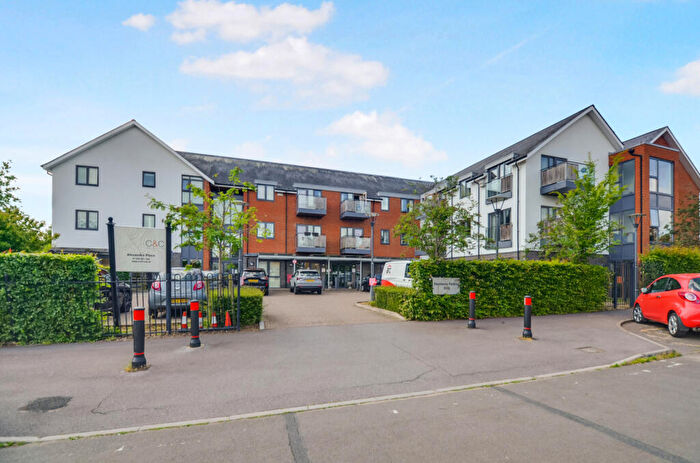
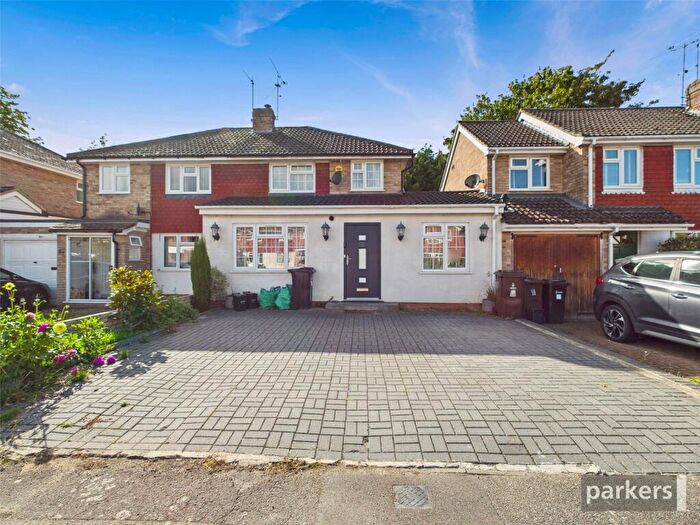
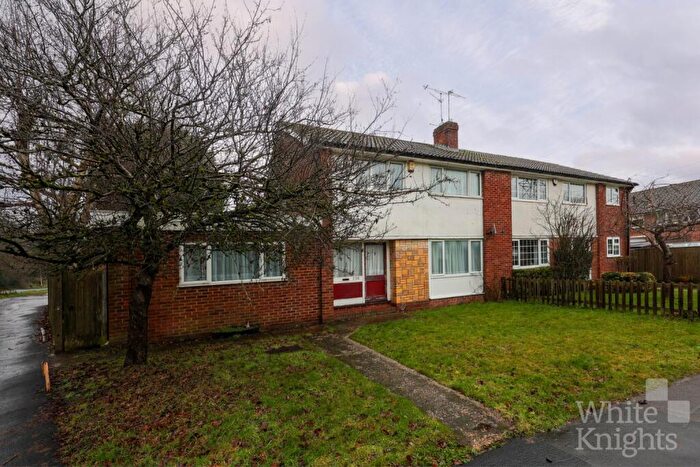
Houses for sale & to rent in South Lake, Reading
House Prices in South Lake
Properties in South Lake have an average house price of £423,027.00 and had 216 Property Transactions within the last 3 years¹.
South Lake is an area in Reading, Wokingham with 2,009 households², where the most expensive property was sold for £828,000.00.
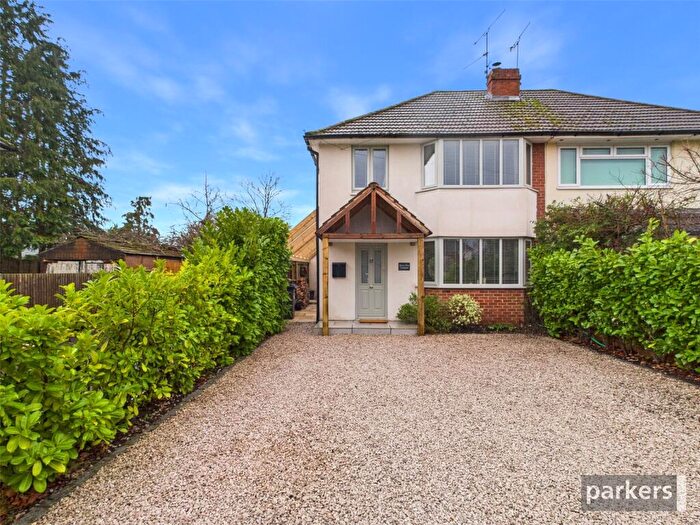
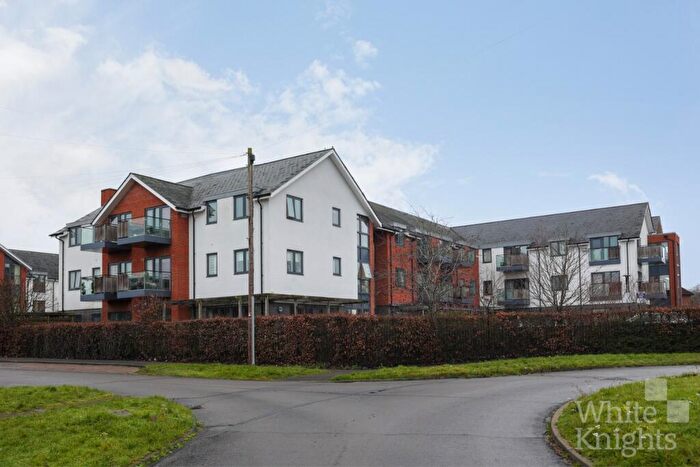
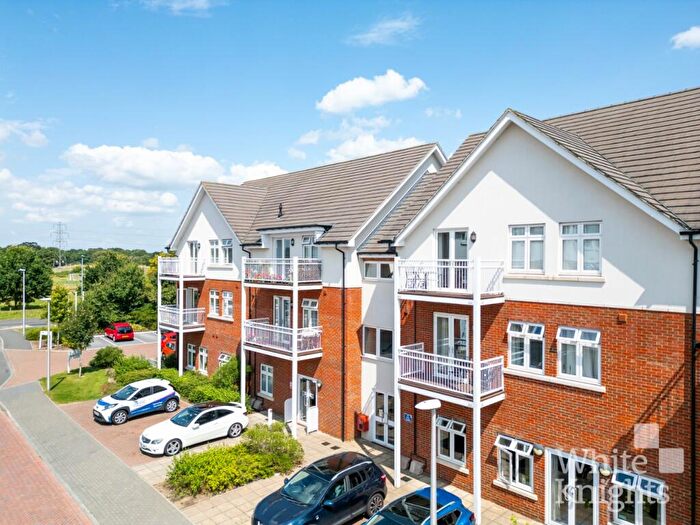
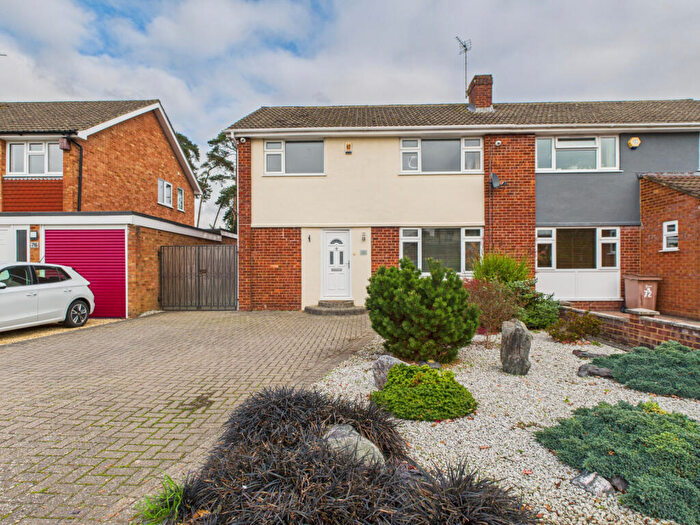
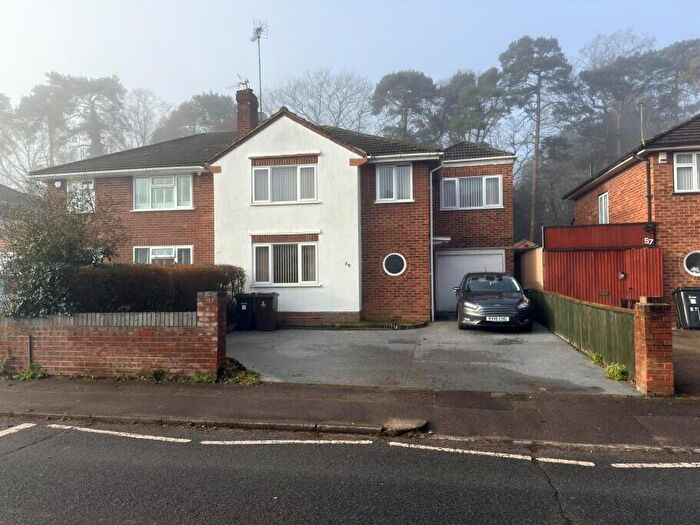
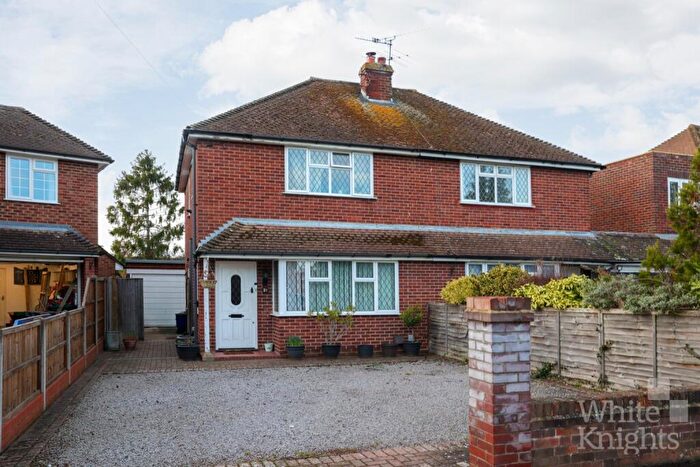
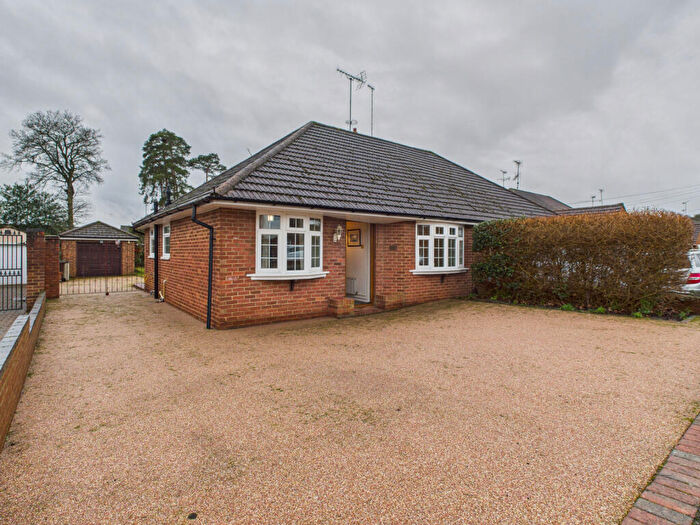
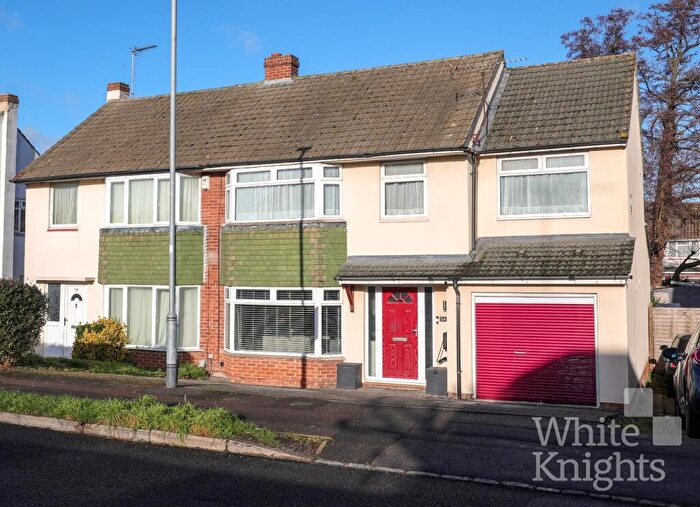
Properties for sale in South Lake
Roads and Postcodes in South Lake
Navigate through our locations to find the location of your next house in South Lake, Reading for sale or to rent.
| Streets | Postcodes |
|---|---|
| Antrim Road | RG5 3NR RG5 3NS RG5 3NT RG5 3NU RG5 3NY RG5 3NZ |
| Ashwood | RG5 3RX |
| Bibury Close | RG5 3PE |
| Bideford Close | RG5 3SE |
| Blackstone Way | RG6 1FF |
| Bodmin Road | RG5 3RZ |
| Burgess Close | RG5 3LJ |
| Campbell Road | RG5 3NA RG5 3NB RG5 3PG |
| Carrick Gardens | RG5 3JD |
| Cartmel Drive | RG5 3NG RG5 3NQ |
| Cottesmore Road | RG5 3NX |
| Crockhamwell Road | RG5 3JY |
| Dartington Avenue | RG5 3PD |
| Drovers Way | RG5 3PW |
| Dundela Close | RG5 3NN |
| Englefield Place | RG6 1FR |
| Fairwater Drive | RG5 3HH RG5 3JB RG5 3JF RG5 3JG RG5 3JQ RG5 3EZ RG5 3JE |
| Faringdon Road | RG6 1FP |
| Fawcett Crescent | RG5 3HU RG5 3HX |
| Hazel Drive | RG5 3SA |
| Highgate Road | RG5 3ND RG5 3QR |
| Jerome Road | RG5 3NH |
| Kingfisher Drive | RG5 3LG RG5 3LH RG5 3LQ |
| Larch Drive | RG5 3LW |
| Linden Road | RG5 3QT |
| Livingstone Gardens | RG5 3LT |
| Louden Square | RG6 1FN |
| Lynton Close | RG5 3SF |
| Malone Road | RG5 3NJ RG5 3NL RG5 3NP |
| Mulberry Close | RG5 3LR |
| Nightingale Road | RG5 3LP RG5 3LS RG5 3LU RG5 3LY RG5 3LZ |
| Oak Way | RG5 3QS |
| Penrose Avenue | RG5 3PA |
| Plymouth Avenue | RG5 3SG |
| Portrush Close | RG5 3PB |
| Quentin Road | RG5 3NE RG5 3NF |
| Repton Crescent | RG6 1FL |
| Rickman Close | RG5 3LL |
| Rosewood | RG5 3QU |
| Roslyn Road | RG5 3HP RG5 3HR RG5 3HS RG5 3HT |
| Seaford Gardens | RG5 3LN |
| Silver Fox Crescent | RG5 3JA |
| South Lake Court | RG5 3SQ |
| South Lake Parade | RG5 3SJ |
| Sycamore Close | RG5 3RY |
| The Orangery | RG6 1FH |
| Tutor Crescent | RG6 1FJ |
| Wallace Close | RG5 3HW |
| Woodlands Avenue | RG5 3HF RG5 3HG RG5 3HN RG5 3HQ |
Transport near South Lake
- FAQ
- Price Paid By Year
- Property Type Price
Frequently asked questions about South Lake
What is the average price for a property for sale in South Lake?
The average price for a property for sale in South Lake is £423,027. This amount is 16% lower than the average price in Reading. There are 792 property listings for sale in South Lake.
What streets have the most expensive properties for sale in South Lake?
The streets with the most expensive properties for sale in South Lake are Blackstone Way at an average of £722,500, Tutor Crescent at an average of £692,500 and Campbell Road at an average of £608,125.
What streets have the most affordable properties for sale in South Lake?
The streets with the most affordable properties for sale in South Lake are South Lake Court at an average of £231,250, Englefield Place at an average of £237,500 and Larch Drive at an average of £254,491.
Which train stations are available in or near South Lake?
Some of the train stations available in or near South Lake are Earley, Winnersh Triangle and Winnersh.
Property Price Paid in South Lake by Year
The average sold property price by year was:
| Year | Average Sold Price | Price Change |
Sold Properties
|
|---|---|---|---|
| 2025 | £442,542 | 4% |
82 Properties |
| 2024 | £425,735 | 8% |
74 Properties |
| 2023 | £393,016 | -5% |
60 Properties |
| 2022 | £414,323 | 12% |
99 Properties |
| 2021 | £363,651 | 1% |
112 Properties |
| 2020 | £361,506 | 1% |
78 Properties |
| 2019 | £356,704 | -1% |
69 Properties |
| 2018 | £360,508 | -26% |
106 Properties |
| 2017 | £454,164 | 9% |
174 Properties |
| 2016 | £411,884 | 16% |
153 Properties |
| 2015 | £345,992 | 22% |
88 Properties |
| 2014 | £271,052 | 7% |
79 Properties |
| 2013 | £251,817 | 6% |
73 Properties |
| 2012 | £236,021 | 1% |
60 Properties |
| 2011 | £232,639 | 4% |
61 Properties |
| 2010 | £224,135 | 3% |
57 Properties |
| 2009 | £216,615 | -7% |
56 Properties |
| 2008 | £231,746 | -4% |
56 Properties |
| 2007 | £240,072 | 11% |
105 Properties |
| 2006 | £214,096 | 5% |
103 Properties |
| 2005 | £202,627 | 3% |
98 Properties |
| 2004 | £195,780 | 7% |
105 Properties |
| 2003 | £182,429 | 9% |
97 Properties |
| 2002 | £166,137 | 11% |
98 Properties |
| 2001 | £148,454 | 2% |
132 Properties |
| 2000 | £145,878 | 23% |
96 Properties |
| 1999 | £111,944 | 15% |
104 Properties |
| 1998 | £95,068 | 10% |
105 Properties |
| 1997 | £85,876 | 12% |
114 Properties |
| 1996 | £75,236 | 5% |
90 Properties |
| 1995 | £71,567 | - |
99 Properties |
Property Price per Property Type in South Lake
Here you can find historic sold price data in order to help with your property search.
The average Property Paid Price for specific property types in the last three years are:
| Property Type | Average Sold Price | Sold Properties |
|---|---|---|
| Semi Detached House | £445,521.00 | 106 Semi Detached Houses |
| Detached House | £559,903.00 | 26 Detached Houses |
| Terraced House | £404,175.00 | 55 Terraced Houses |
| Flat | £253,843.00 | 29 Flats |

