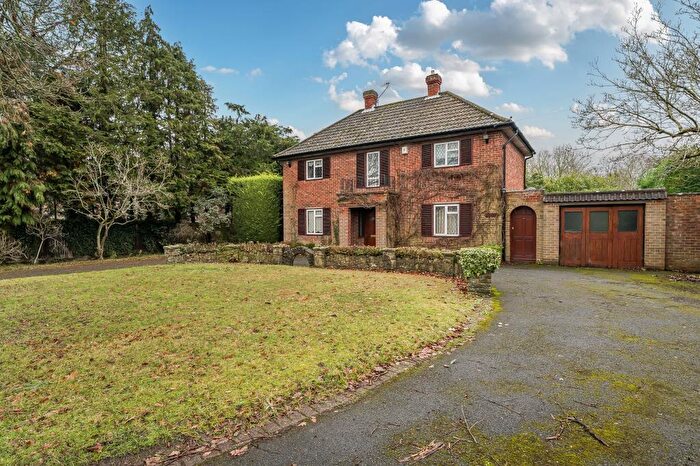
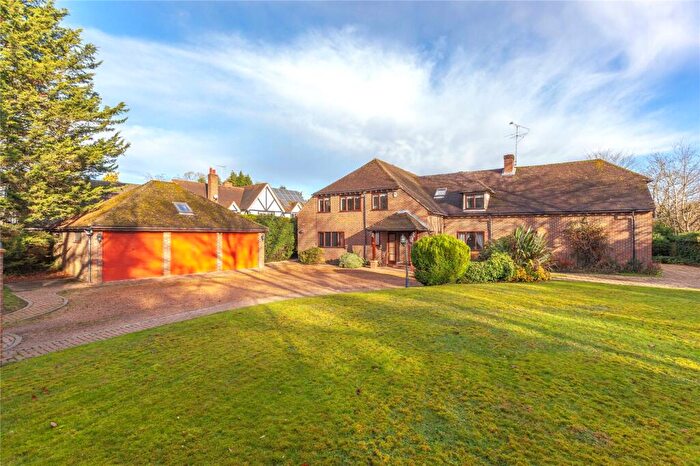
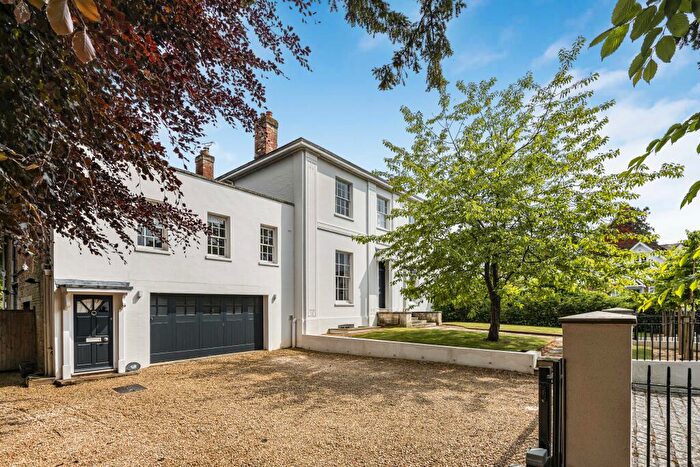
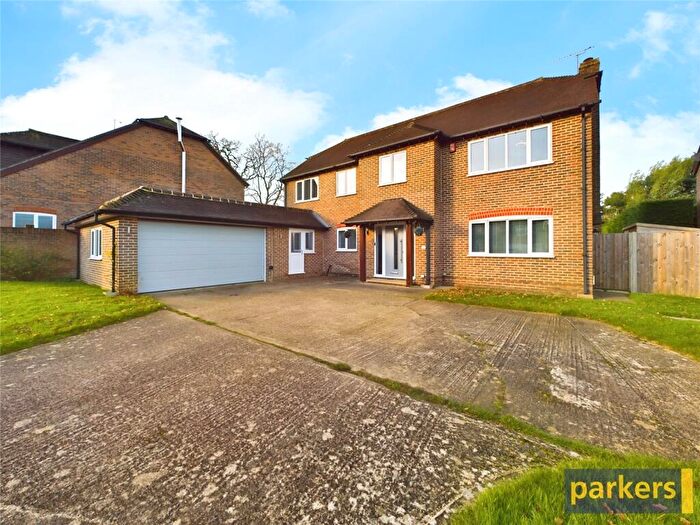
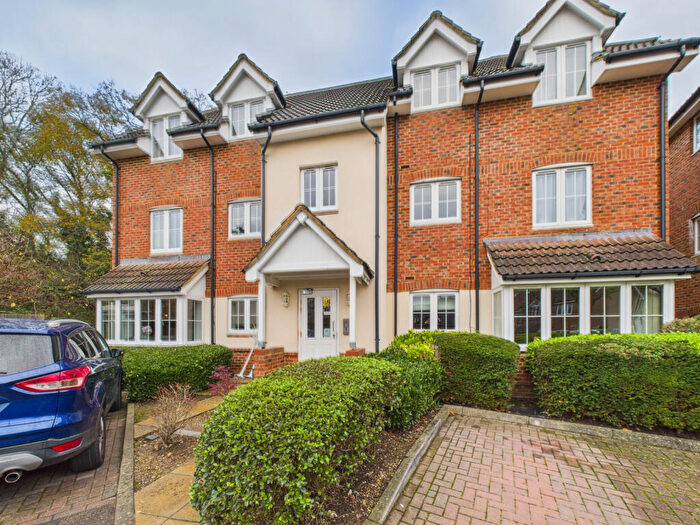
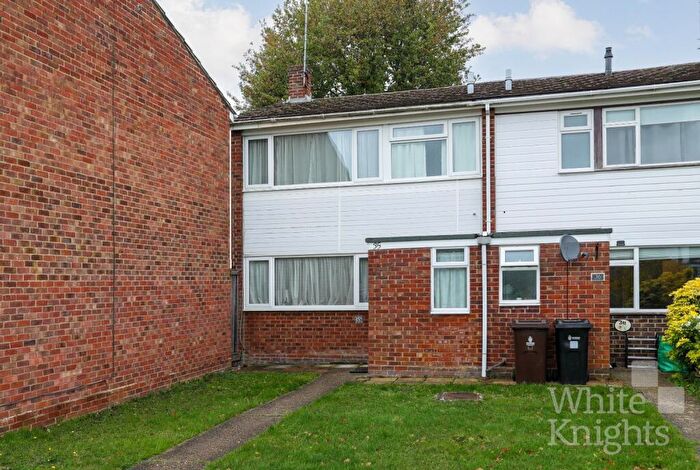
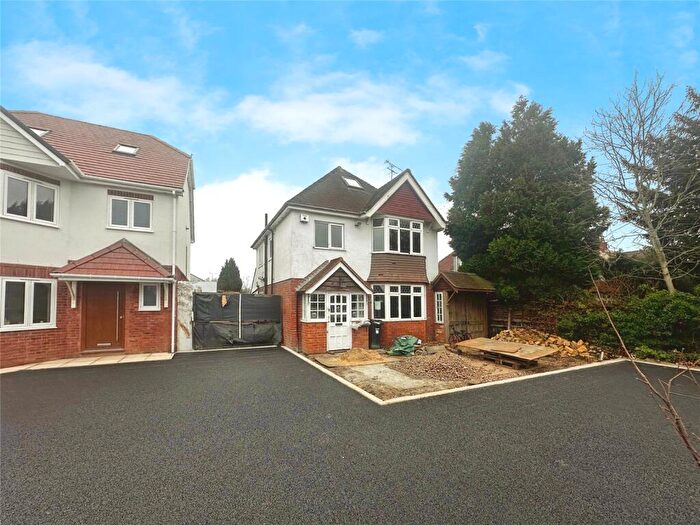
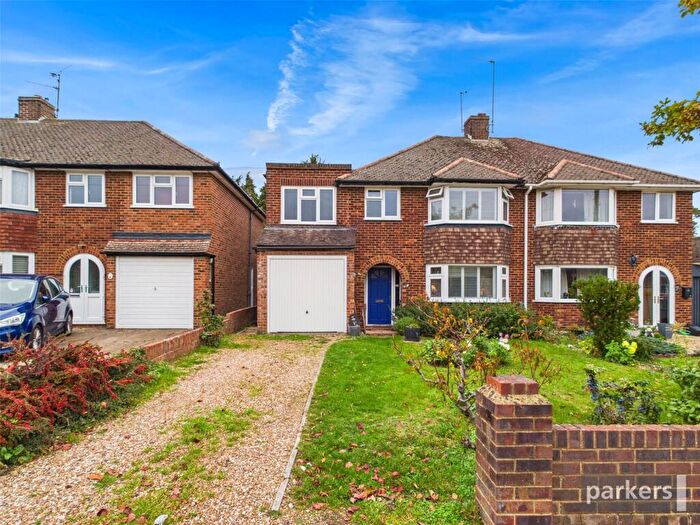
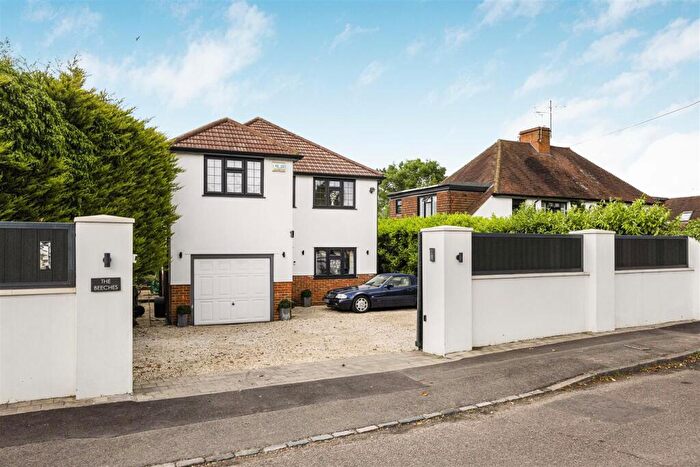
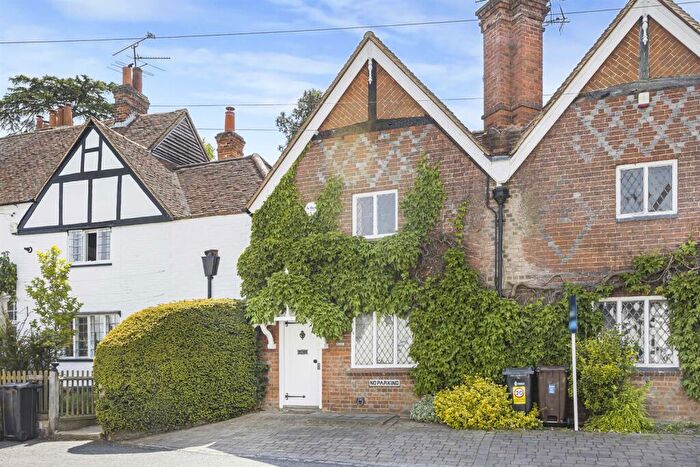
Houses for sale & to rent in Sonning, Reading
House Prices in Sonning
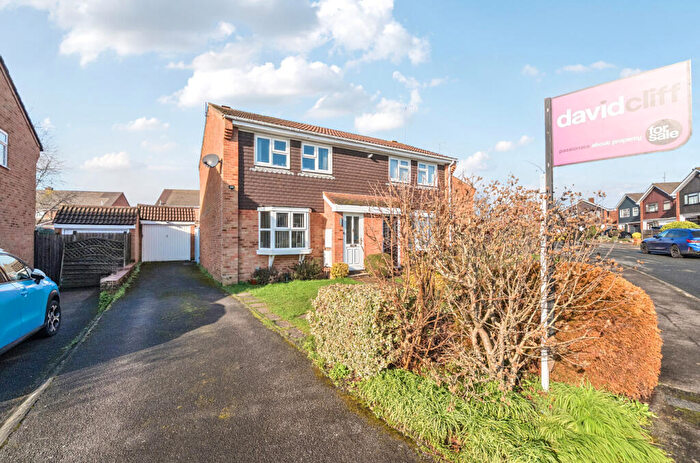
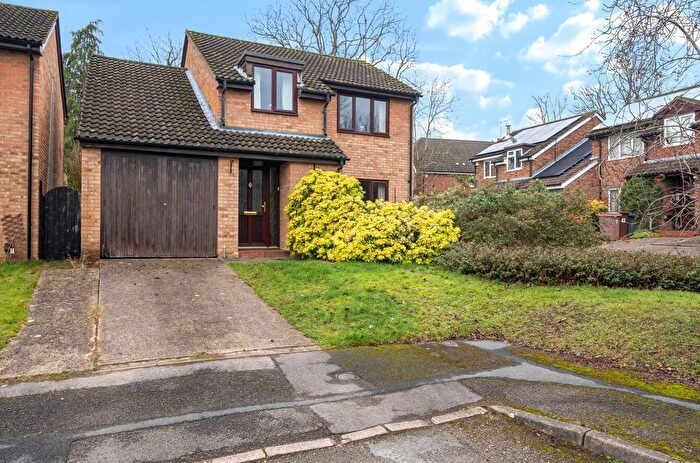
Properties in Sonning have an average house price of £706,518.00 and had 100 Property Transactions within the last 3 years¹.
Sonning is an area in Reading, Wokingham with 1,258 households², where the most expensive property was sold for £2,314,000.00.
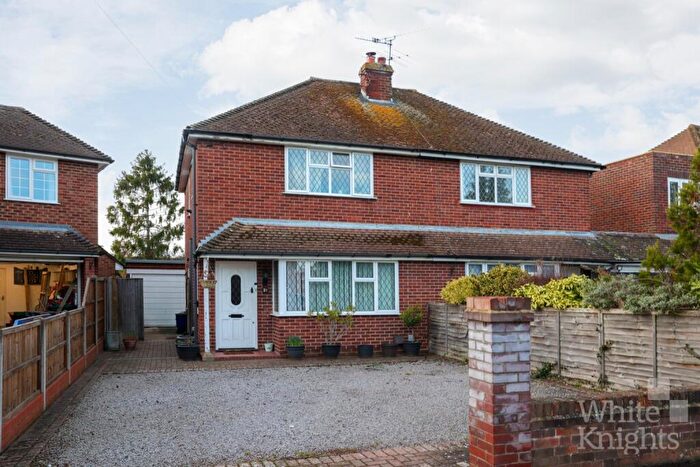
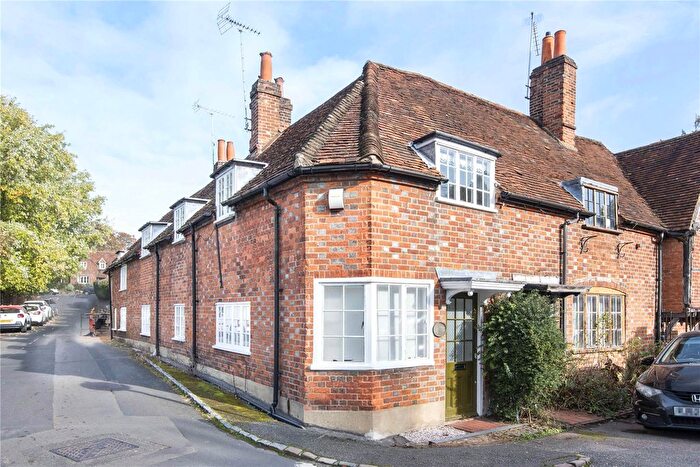
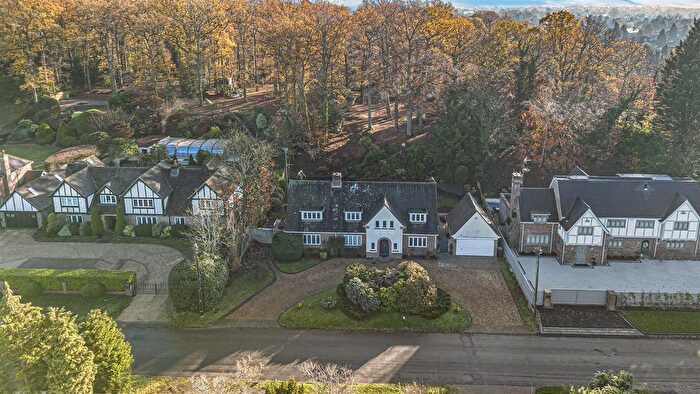
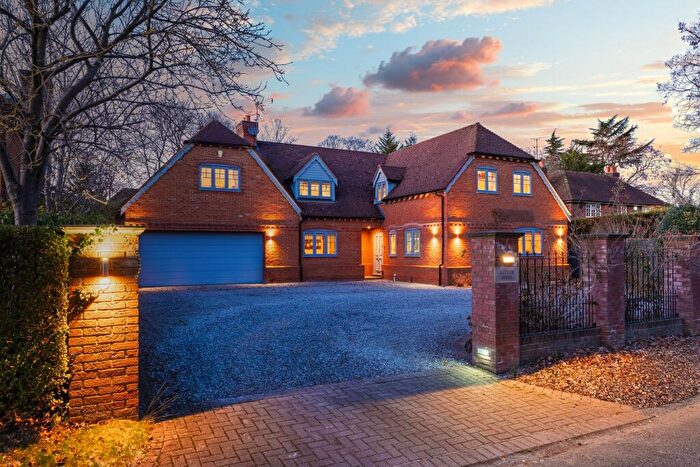
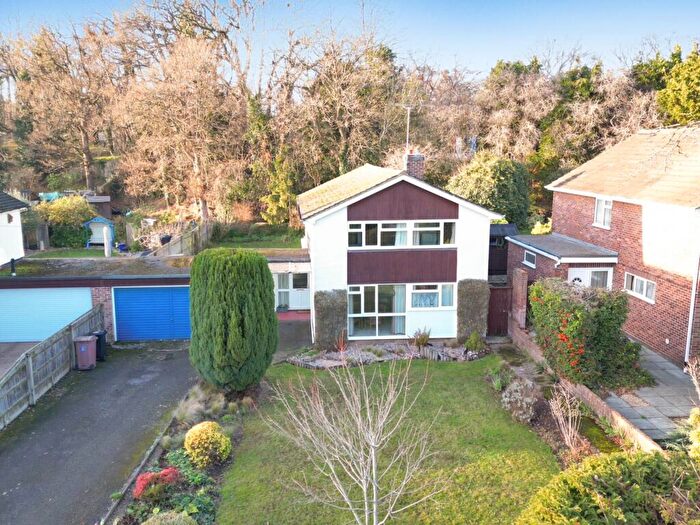
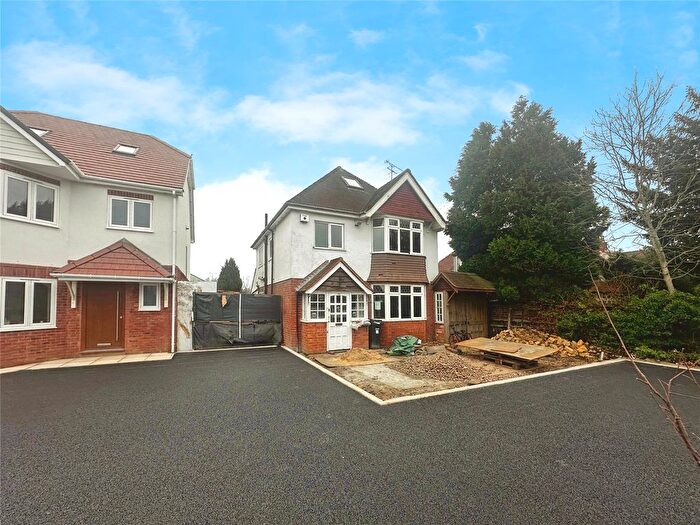
Properties for sale in Sonning
Roads and Postcodes in Sonning
Navigate through our locations to find the location of your next house in Sonning, Reading for sale or to rent.
| Streets | Postcodes |
|---|---|
| Augustfield | RG4 6AF |
| Badgers Rise | RG5 3AJ |
| Bath Road | RG4 6TB RG4 6TD |
| Charvil Lane | RG4 6TH RG4 6TJ RG4 6TL |
| Duffield Road | RG4 6GJ |
| Elmwood Close | RG5 3AL |
| Frampton Close | RG5 3BS |
| Frimley Close | RG5 3AU |
| Garde Road | RG4 6XJ |
| Glebe Gardens | RG4 6XN |
| Glebe Lane | RG4 6XH |
| Hanwood Close | RG5 3AB |
| Hawthorn Way | RG4 6TG |
| High Street | RG4 6UP |
| Holme Park Farm Lane | RG4 6SX |
| Holmemoor Drive | RG4 6TE |
| Liguge Way | RG4 6XF |
| Little Glebe | RG4 6XL |
| London Road | RG6 1BD RG6 1BE RG6 1BG |
| Meade Park | RG4 6US |
| Mustard Lane | RG4 6GH |
| Old Bath Road | RG4 6GA RG4 6SY RG4 6SZ RG4 6TA RG4 6TQ |
| Paddick Close | RG4 6XQ |
| Parkway Drive | RG4 6XG |
| Pearson Road | RG4 6UH RG4 6UL RG4 6UN |
| Pound Lane | RG4 6GG RG4 6XD RG4 6XE |
| Radcot Close | RG5 3BG |
| Reading Road | RG5 3AA RG5 3AD |
| Ryecroft Close | RG5 3BP |
| Segrave Close | RG4 6BB |
| Selcourt Close | RG5 3AS |
| Shepherds Hill | RG6 1BB RG6 1FE |
| Shepherds Walk | RG6 1BS |
| Sonning Gate | RG4 6GQ |
| Sonning Lane | RG4 6ST RG4 6SU |
| Sonning Meadows | RG4 6XB |
| South Drive | RG4 6GB |
| Steggles Close | RG5 3AH |
| Tamarisk Gardens | RG5 3BW |
| Thames Street | RG4 6UR RG4 6UT RG4 6UU RG4 6UX |
| Thames Terrace | RG4 6XA |
| The Hedgerows | RG5 3BQ |
| The Laurels | RG5 3BA |
| The Pit | RG4 6XS |
| Tiverton Close | RG5 3BE |
| Warren Road | RG5 3AP RG5 3AR |
| West Drive | RG4 6GD RG4 6GE RG4 6GL |
| Western Avenue | RG5 3BH RG5 3BJ RG5 3BL RG5 3BN RG5 3BU |
| Wildwood Close | RG5 3BY |
| Wroxham Road | RG5 3AT RG5 3AX |
| Wyndham Crescent | RG5 3AY RG5 3AZ |
| RG6 1WA RG6 1WG |
Transport near Sonning
-
Earley Station
-
Winnersh Triangle Station
-
Twyford Station
-
Wargrave Station
-
Reading Station
-
Winnersh Station
- FAQ
- Price Paid By Year
- Property Type Price
Frequently asked questions about Sonning
What is the average price for a property for sale in Sonning?
The average price for a property for sale in Sonning is £706,518. This amount is 41% higher than the average price in Reading. There are 420 property listings for sale in Sonning.
What streets have the most expensive properties for sale in Sonning?
The streets with the most expensive properties for sale in Sonning are Old Bath Road at an average of £1,379,875, The Pit at an average of £1,300,000 and Charvil Lane at an average of £1,250,000.
What streets have the most affordable properties for sale in Sonning?
The streets with the most affordable properties for sale in Sonning are Little Glebe at an average of £280,000, Tamarisk Gardens at an average of £380,000 and Hanwood Close at an average of £390,625.
Which train stations are available in or near Sonning?
Some of the train stations available in or near Sonning are Earley, Winnersh Triangle and Twyford.
Property Price Paid in Sonning by Year
The average sold property price by year was:
| Year | Average Sold Price | Price Change |
Sold Properties
|
|---|---|---|---|
| 2025 | £746,065 | 17% |
23 Properties |
| 2024 | £622,081 | -27% |
44 Properties |
| 2023 | £791,537 | -11% |
33 Properties |
| 2022 | £877,719 | 26% |
43 Properties |
| 2021 | £652,027 | 6% |
53 Properties |
| 2020 | £612,128 | -7% |
35 Properties |
| 2019 | £657,662 | 5% |
37 Properties |
| 2018 | £621,855 | -2% |
39 Properties |
| 2017 | £635,299 | -24% |
56 Properties |
| 2016 | £787,133 | 26% |
37 Properties |
| 2015 | £580,258 | -3% |
41 Properties |
| 2014 | £598,696 | 25% |
55 Properties |
| 2013 | £449,713 | 8% |
44 Properties |
| 2012 | £414,741 | -11% |
41 Properties |
| 2011 | £458,517 | 5% |
40 Properties |
| 2010 | £437,403 | 18% |
37 Properties |
| 2009 | £356,784 | -11% |
50 Properties |
| 2008 | £395,059 | -20% |
46 Properties |
| 2007 | £474,392 | 25% |
77 Properties |
| 2006 | £353,804 | 13% |
57 Properties |
| 2005 | £309,411 | -4% |
73 Properties |
| 2004 | £321,693 | -5% |
74 Properties |
| 2003 | £336,488 | -14% |
67 Properties |
| 2002 | £385,248 | 19% |
70 Properties |
| 2001 | £310,576 | 25% |
62 Properties |
| 2000 | £233,310 | 3% |
41 Properties |
| 1999 | £226,749 | 19% |
59 Properties |
| 1998 | £183,070 | 15% |
45 Properties |
| 1997 | £156,072 | 0,4% |
66 Properties |
| 1996 | £155,500 | 5% |
72 Properties |
| 1995 | £147,981 | - |
32 Properties |
Property Price per Property Type in Sonning
Here you can find historic sold price data in order to help with your property search.
The average Property Paid Price for specific property types in the last three years are:
| Property Type | Average Sold Price | Sold Properties |
|---|---|---|
| Semi Detached House | £601,200.00 | 25 Semi Detached Houses |
| Detached House | £990,783.00 | 40 Detached Houses |
| Terraced House | £522,904.00 | 21 Terraced Houses |
| Flat | £357,821.00 | 14 Flats |

