
Houses for sale in Inkberrow, Alcester
House Prices in Inkberrow
Properties in Inkberrow have an average house price of £520k and had 26 Property Transactions within the last 3 years¹.
Inkberrow is an area in Alcester, Worcestershire with 257 households², where the most expensive property was sold for £908k.
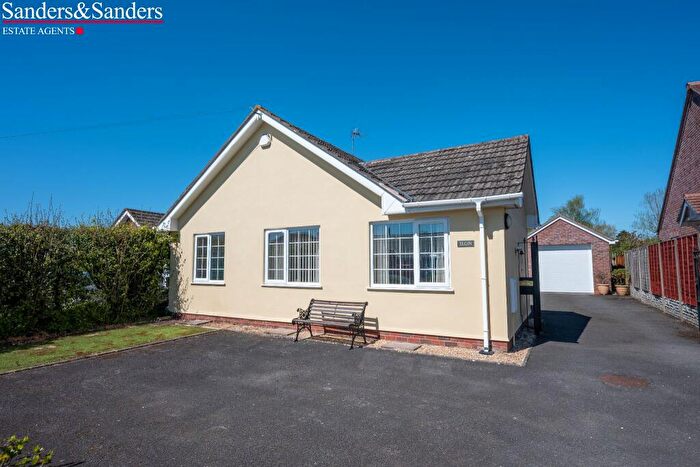
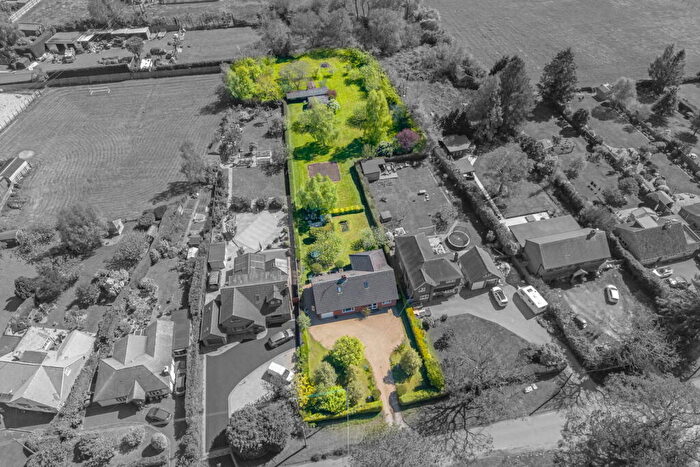
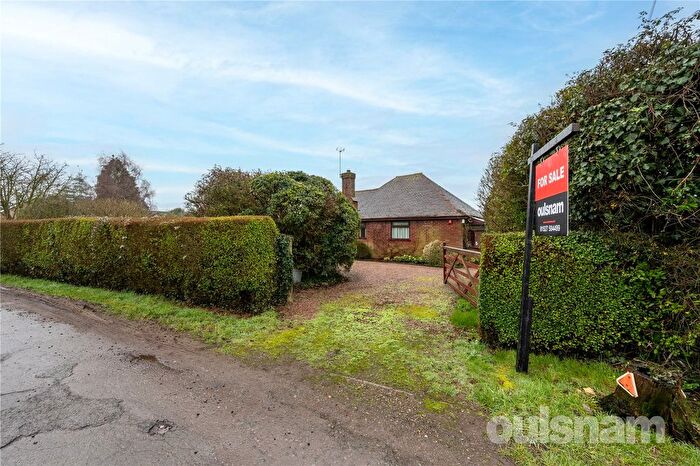
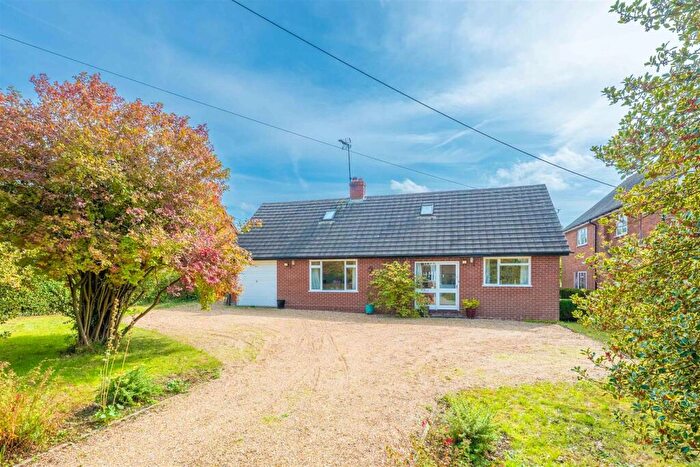
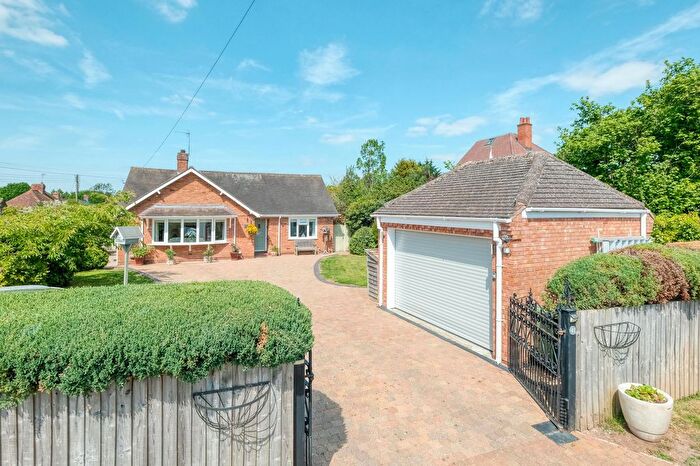
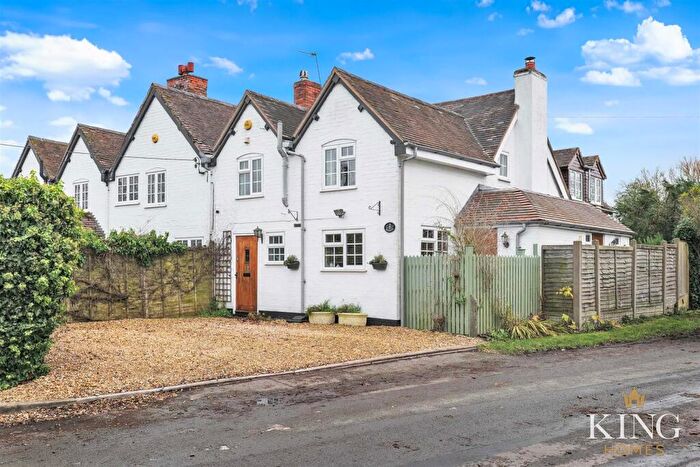
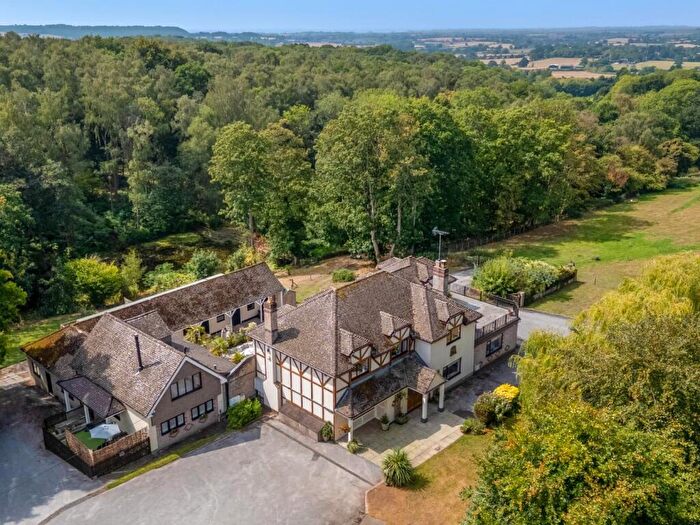
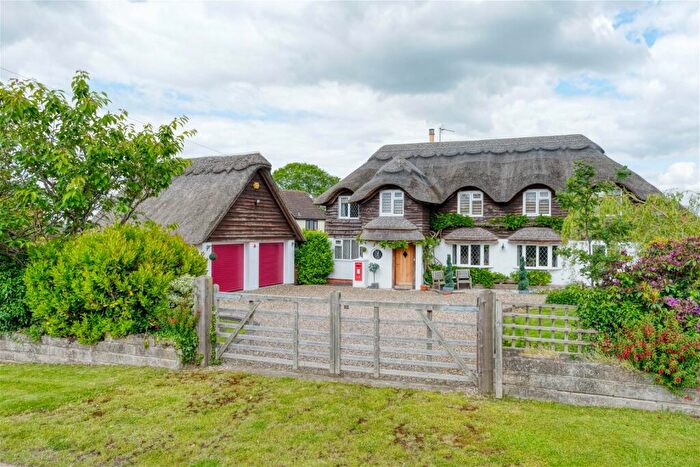
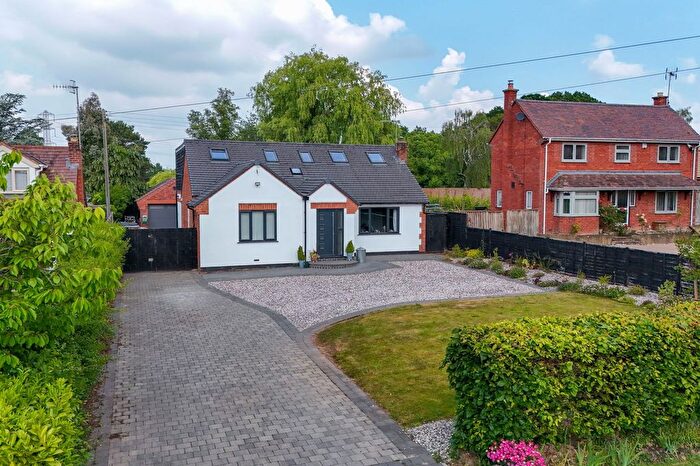
Properties for sale in Inkberrow
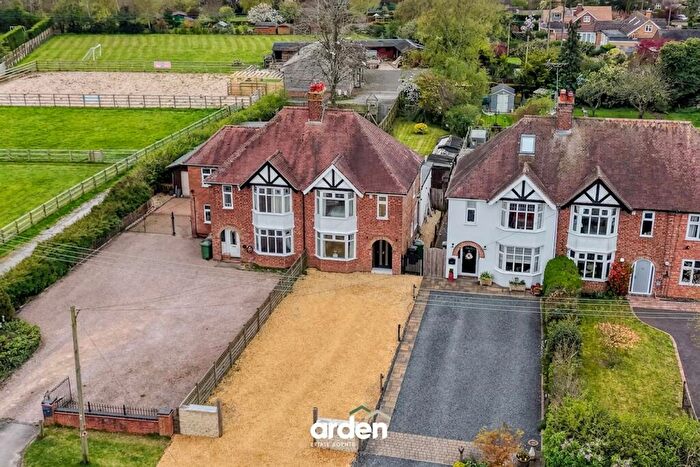
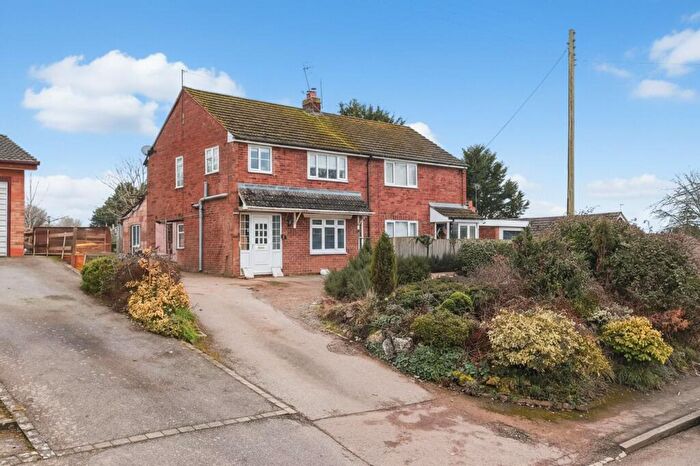
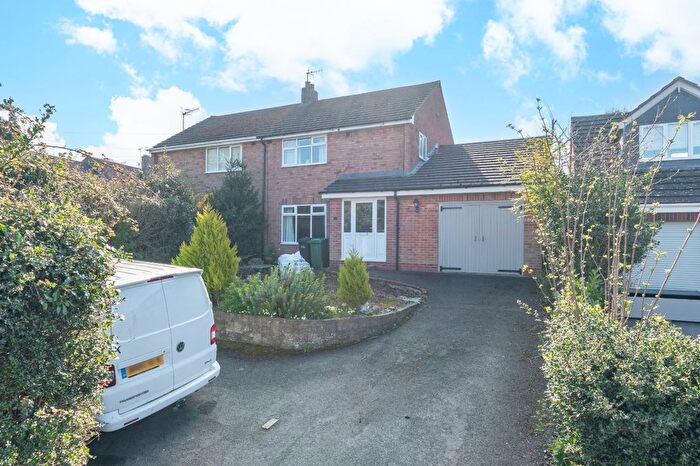
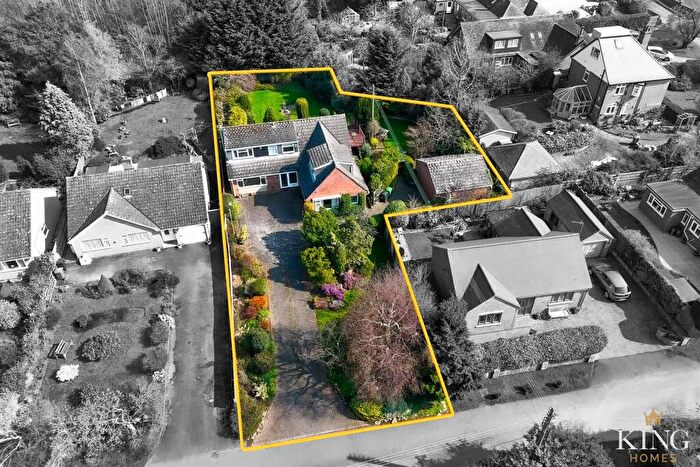
Previously listed properties in Inkberrow

![]()
If you are looking to sell your house, let it out, or receive a property valuation, an expert can help you.
Click the button below to get started.

Roads and Postcodes in Inkberrow
Navigate through our locations to find the location of your next house in Inkberrow, Alcester for sale or to rent.
| Streets | Postcodes |
|---|---|
| Chamberlain Lane | B49 5LD |
| Church Drive | B49 5JH |
| Church Lane | B49 5JS |
| Cladswell Close | B49 5JX |
| Cladswell Lane | B49 5JT B49 5JU |
| Cookhill | B49 5LA |
| Evesham Road | B49 5JR B49 5LB B49 5LG B49 5LJ B49 5LL B49 5LN B49 5LQ B49 5LW |
| Lower Cladswell Lane | B49 5JY B49 5JZ |
| Oak Tree Lane | B49 5LH |
| Worcester Road | B49 5LP B49 5LS |
| B49 5LT B49 5LU |
Property price trends in Inkberrow
According to the latest Land Registry data, the average home in Inkberrow sold for £490,357 in 2025. That figure comes from 257 sales logged over the past 30 years.
Prices have fallen back over the last three years. Compared with 2022, when the typical sale came in around £725,833, that's a fall of roughly 32.4%.
Looking back five years, average prices are down about 9.8% since 2020, a drop of around £52,976 in cash terms.
Zoom out to the past decade for the fuller picture. Back in 2015, homes here averaged £287,000, so the typical sold price has climbed about 70.9% since then, roughly 5.5% a year. Stretch the view to fifteen years and that annual pace eases back to about 2.4%.
Frequently asked questions about Inkberrow
What is the average price for a property for sale in Inkberrow?
The average price for a property for sale in Inkberrow is £520,288. This amount is 2% lower than the average price in Alcester. There are 51 property listings for sale in Inkberrow.
What streets have the most expensive properties for sale in Inkberrow?
The streets with the most expensive properties for sale in Inkberrow are Church Lane at an average of £690,833, Oak Tree Lane at an average of £569,000 and Evesham Road at an average of £542,111.
What streets have the most affordable properties for sale in Inkberrow?
The streets with the most affordable properties for sale in Inkberrow are Cladswell Close at an average of £297,000 and Lower Cladswell Lane at an average of £438,500.
Which train stations are available in or near Inkberrow?
Some of the train stations available in or near Inkberrow are Redditch, Wootton Wawen and Wilmcote.
Property Price Paid in Inkberrow by Year
The average sold property price by year was:
| Year | Average Sold Price | Price Change |
Sold Properties
|
|---|---|---|---|
| 2025 | £490,357 | -13% |
7 Properties |
| 2024 | £555,722 | 8% |
9 Properties |
| 2023 | £509,350 | -43% |
10 Properties |
| 2022 | £725,833 | 30% |
6 Properties |
| 2021 | £509,550 | -7% |
10 Properties |
| 2020 | £543,333 | 32% |
9 Properties |
| 2019 | £369,222 | -14% |
9 Properties |
| 2018 | £421,981 | 2% |
15 Properties |
| 2017 | £412,136 | -4% |
11 Properties |
| 2016 | £428,545 | 33% |
11 Properties |
Property Price per Property Type in Inkberrow
Here you can find historic sold price data in order to help with your property search.
The average Property Paid Price for specific property types in the last three years are:
| Property Type | Average Sold Price | Sold Properties |
|---|---|---|
| Semi Detached House | £416,428.00 | 7 Semi Detached Houses |
| Terraced House | £305,500.00 | 2 Terraced Houses |
| Detached House | £588,323.00 | 17 Detached Houses |
