
Houses for sale in Inkberrow, Worcester
House Prices in Inkberrow
Properties in Inkberrow have an average house price of £553k and had 90 Property Transactions within the last 3 years¹.
Inkberrow is an area in Worcester, Worcestershire with 962 households², where the most expensive property was sold for £2.98M.
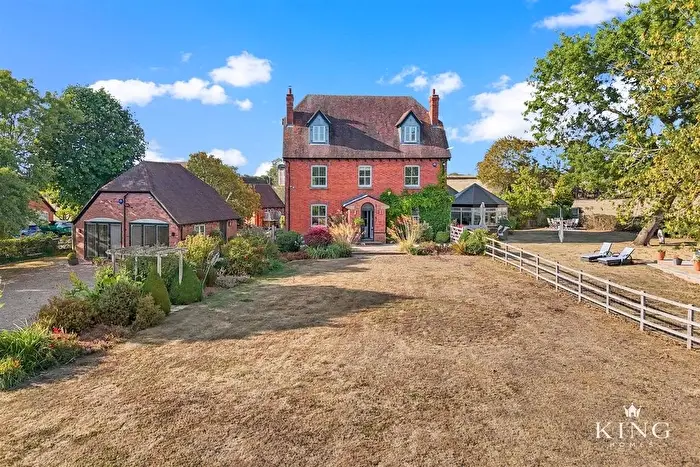
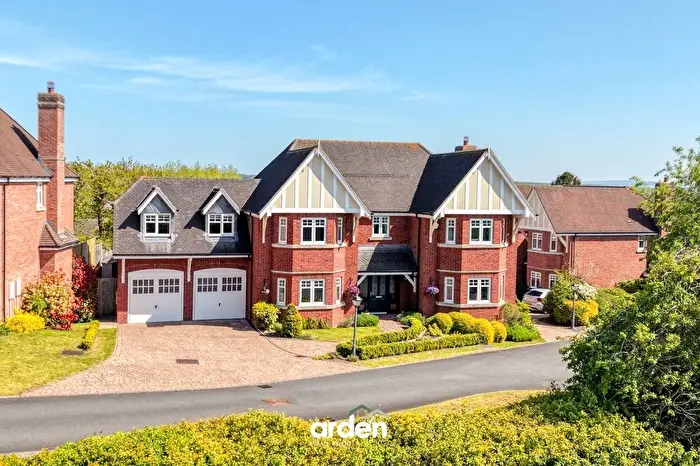
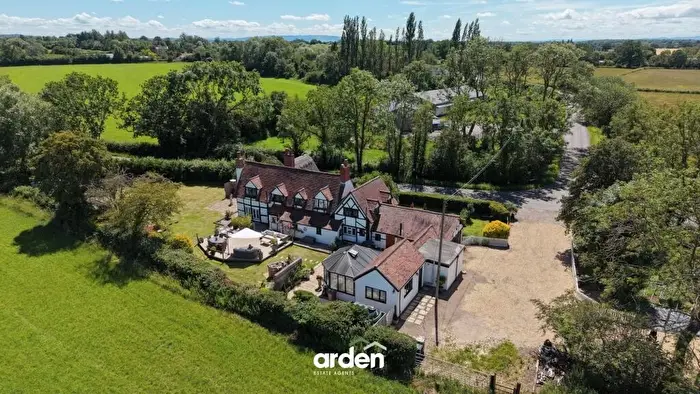
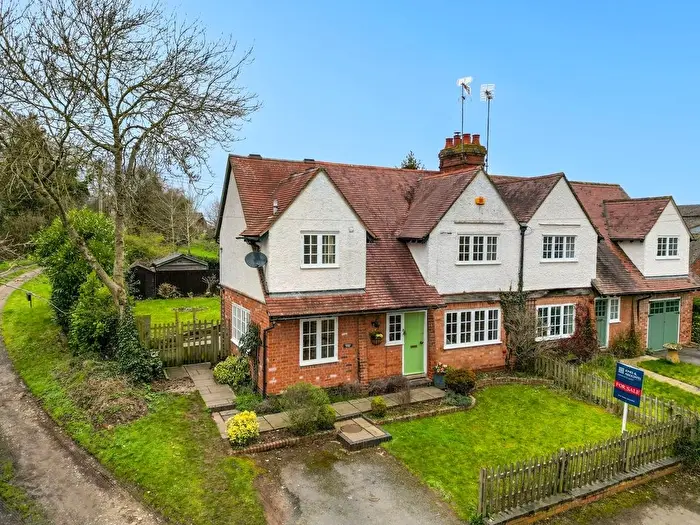
Properties for sale in Inkberrow

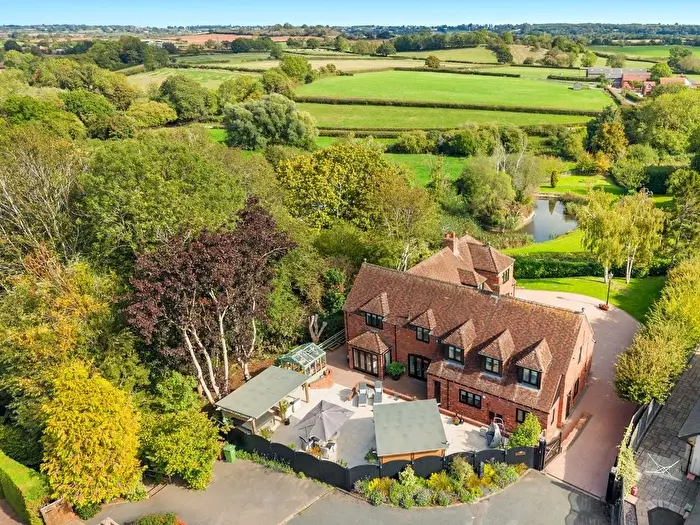

 4 Bedrooms
 4 Bathrooms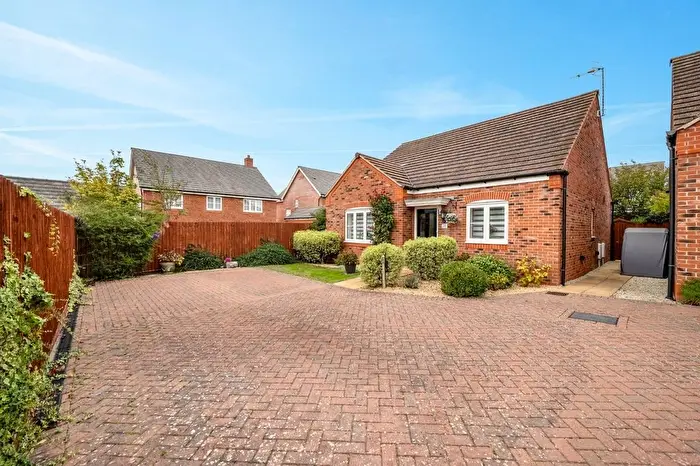




If you are looking to sell your house, let it out, or receive a property valuation, an expert can help you.
Click the button below to get started.






Roads and Postcodes in Inkberrow
Navigate through our locations to find the location of your next house in Inkberrow, Worcester for sale or to rent.
| Streets | Postcodes |
|---|---|
| Alcester Road | WR7 4HN WR7 4HR WR7 4LS WR7 4LW WR7 4LX WR7 4LY |
| Appletree Lane | WR7 4HY WR7 4JA |
| Ballard Way | WR7 4FF |
| Barley Meadows | WR7 4DR |
| Bouts Lane | WR7 4HP WR7 4HW |
| Bray Close | WR7 4GA |
| Brecon Close | WR7 4EP |
| Bredon Close | WR7 4HQ |
| Broadclose Lane | WR7 4JN WR7 4JW |
| Brooklyn Court | WR7 4QZ |
| Chaston Close | WR7 4ER |
| Chestnut Lane | WR7 4ES |
| Church Close | WR7 4EA |
| Churchway Piece | WR7 4HB |
| Council Houses | WR7 4HJ |
| Devon Close | WR7 4EN |
| Dingle End | WR7 4EY |
| Evesham Road | WR7 4LJ WR7 4LN |
| Ganderton Close | WR7 4FE |
| Goomshill | WR7 4LT |
| Greenscroft Way | WR7 4EE |
| Harris Grove | WR7 4JR |
| High House Drive | WR7 4EG |
| High Street | WR7 4BW WR7 4DT WR7 4DU WR7 4DY WR7 4EB |
| Hill Farm | WR7 4JE |
| Jenkinson Gardens | WR7 4HL |
| Knighton Lane | WR7 4HX |
| Little Inkberrow | WR7 4JH WR7 4JQ |
| Main Road | WR7 4HH |
| Malt House Crescent | WR7 4EF |
| Mearse Farm Lane | WR7 4HS |
| Midsummer Fields | WR7 4HZ |
| Midsummer Meadow | WR7 4HD |
| Mill Lane | WR7 4LP |
| Morton Wood Lane | WR7 4LU |
| Nobury Hill | WR7 4HA |
| Orchard Mead | WR7 4EH |
| Pepper Street | WR7 4EJ WR7 4EW |
| Perkins Drive | WR7 4FD |
| Poplar Piece | WR7 4JD |
| Priory Farm Lane | WR7 4HT WR7 4HU |
| Ramble Close | WR7 4EL |
| Rock Hill | WR7 4EZ |
| Ross Crescent | WR7 4FG |
| Sands Road | WR7 4PX |
| Stockwood Lane | WR7 4HF WR7 4JG |
| Stonepit Lane | WR7 4ED |
| The Pleck | WR7 4JB |
| Tuer Way | WR7 4EQ |
| Village Green | WR7 4DZ |
| Windmill Lane | WR7 4HG |
| Withybed Lane | WR7 4JJ WR7 4JL |
| Worcester Road | WR7 4ET WR7 4EU WR7 4EX WR7 4LH |
| WR7 4LR WR7 4LZ WR7 4NA |
Property price trends in Inkberrow
According to the latest Land Registry data, the average home in Inkberrow sold for £462,125 in 2026. That figure comes from 1,029 sales logged over the past 31 years.
Prices have fallen back over the last three years. Compared with 2023, when the typical sale came in around £509,976, that's a fall of roughly 9.4%.
Looking back five years, average prices are down about 0.1% since 2021, a drop of around £520 in cash terms.
Zoom out to the past decade for the fuller picture. Back in 2016, homes here averaged £393,064, so the typical sold price has climbed about 17.6% since then, roughly 1.6% a year. Stretch the view to fifteen years and that annual pace eases back to about 1.4%.
Frequently asked questions about Inkberrow
What is the average price for a property for sale in Inkberrow?
The average price for a property for sale in Inkberrow is £552,545. This amount is 77% higher than the average price in Worcester. There are 206 property listings for sale in Inkberrow.
What streets have the most expensive properties for sale in Inkberrow?
The streets with the most expensive properties for sale in Inkberrow are Goomshill at an average of £1,362,500, Main Road at an average of £957,000 and Jenkinson Gardens at an average of £940,000.
What streets have the most affordable properties for sale in Inkberrow?
The streets with the most affordable properties for sale in Inkberrow are Churchway Piece at an average of £295,000, Windmill Lane at an average of £296,800 and High House Drive at an average of £298,500.
Which train stations are available in or near Inkberrow?
Some of the train stations available in or near Inkberrow are Redditch, Pershore and Evesham.
Property Price Paid in Inkberrow by Year
The average sold property price by year was:
| Year | Average Sold Price | Price Change |
Sold Properties

|
|---|---|---|---|
| 2026 | £462,125 | 
-34% |
12 Properties |
| 2025 | £619,212 | 
9% |
24 Properties |
| 2024 | £564,028 |
10% |
33 Properties |
| 2023 | £509,976 |
-8% |
21 Properties |
| 2022 | £551,400 |
16% |
38 Properties |
| 2021 | £462,645 |
18% |
40 Properties |
| 2020 | £380,998 |
-9% |
34 Properties |
| 2019 | £415,038 |
3% |
26 Properties |
| 2018 | £401,759 |
7% |
31 Properties |
| 2017 | £372,025 |
-6% |
45 Properties |
Property Price per Property Type in Inkberrow
Here you can find historic sold price data in order to help with your property search.
The average Property Paid Price for specific property types in the last three years are:
| Property Type | Average Sold Price | Sold Properties |
|---|---|---|
| Detached House | £600,686.00 | 70 Detached Houses |
| Semi Detached House | £405,785.00 | 14 Semi Detached Houses |
| Terraced House | £333,333.00 | 6 Terraced Houses |
