Houses for sale & to rent in Catshill, Bromsgrove
House Prices in Catshill
Properties in Catshill have an average house price of £299,201.00 and had 169 Property Transactions within the last 3 years¹.
Catshill is an area in Bromsgrove, Worcestershire with 1,794 households², where the most expensive property was sold for £930,000.00.
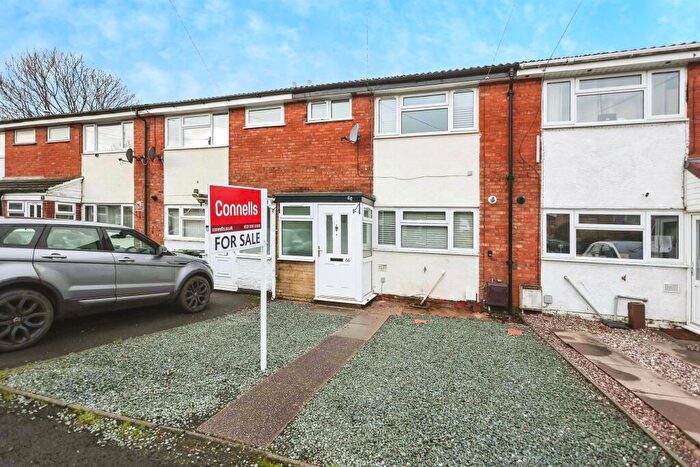
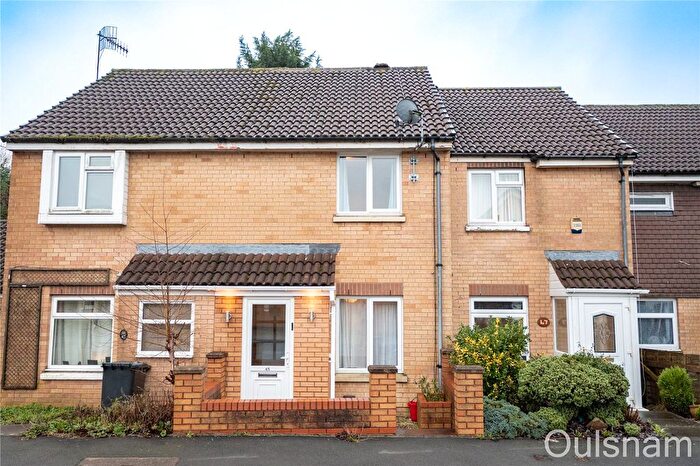
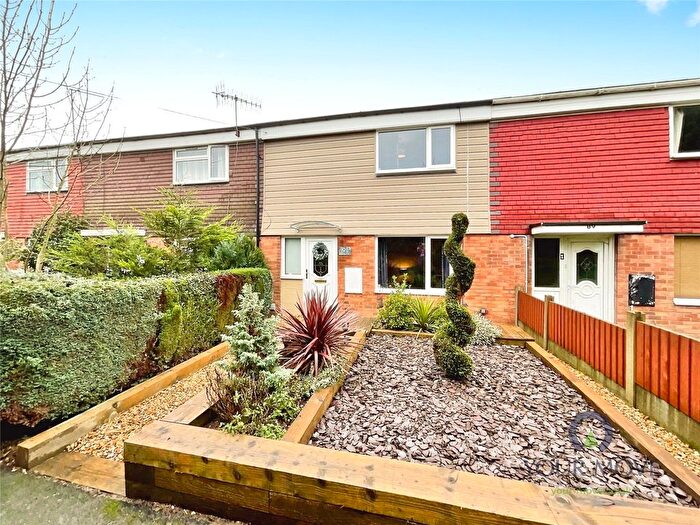
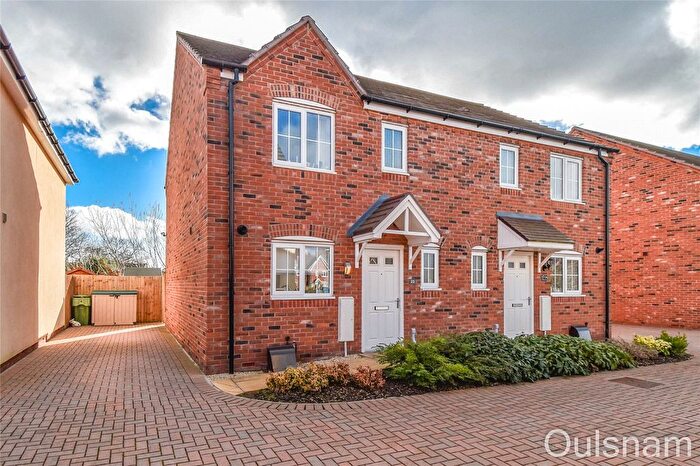
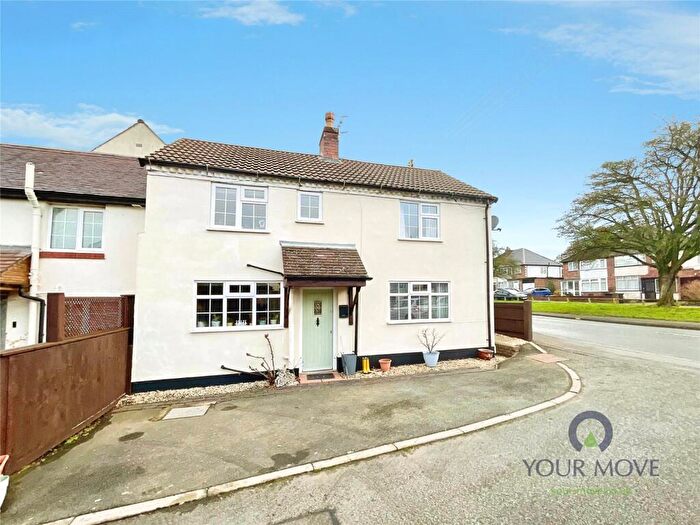
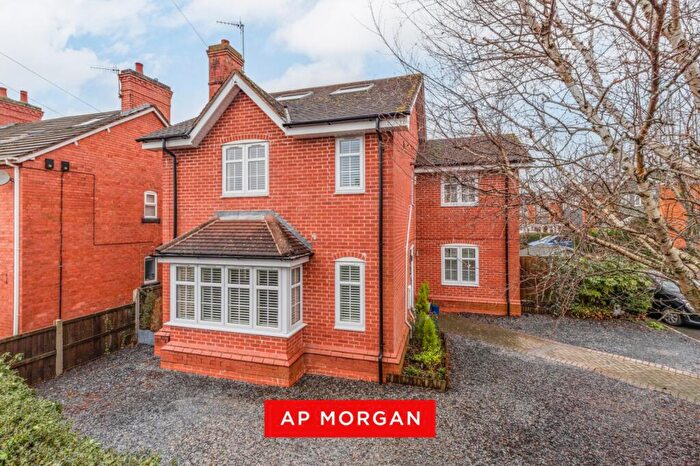
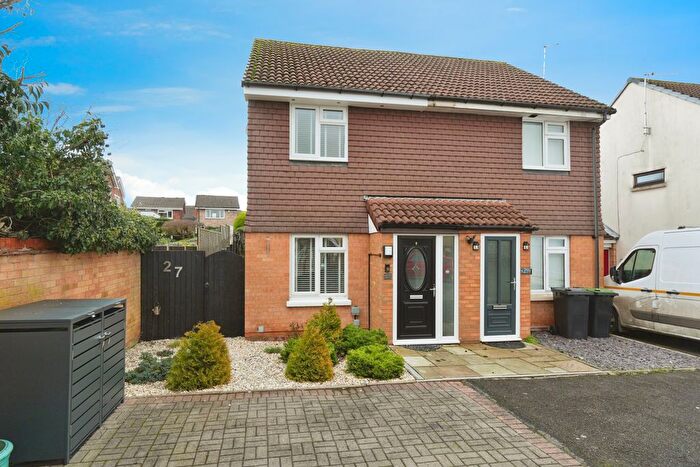
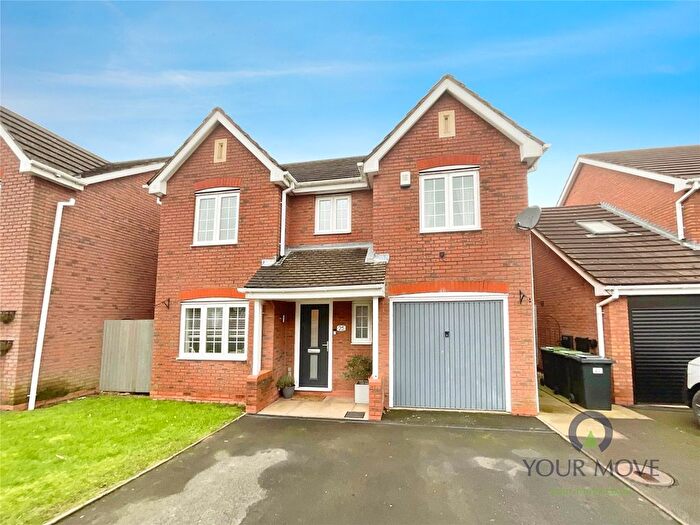
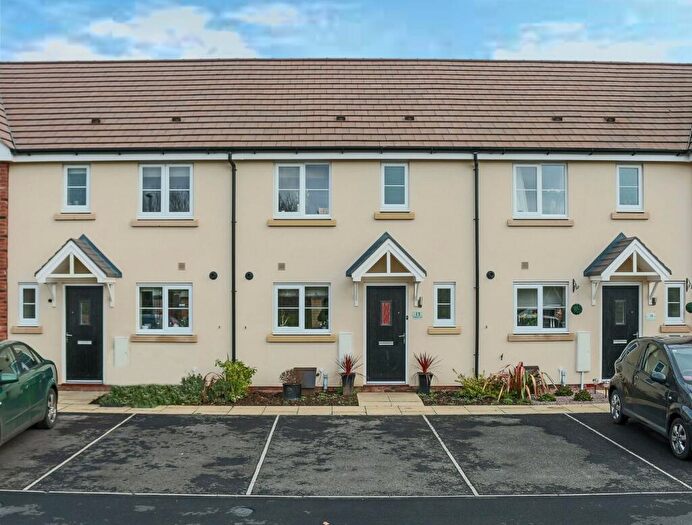
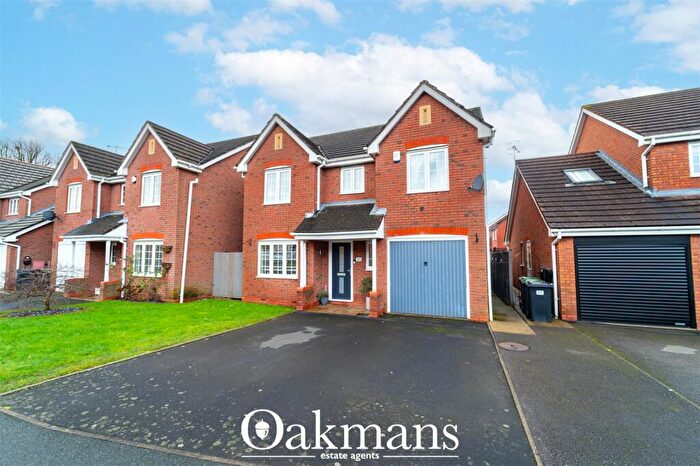
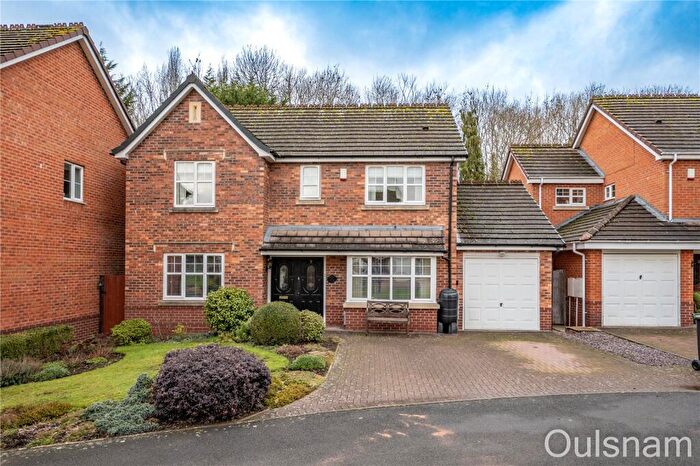
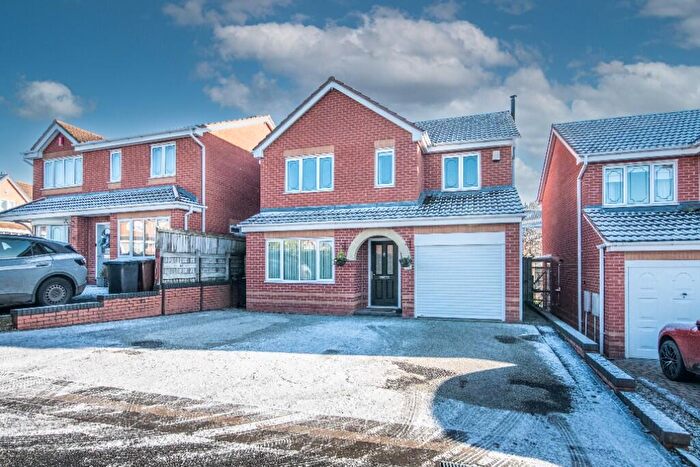
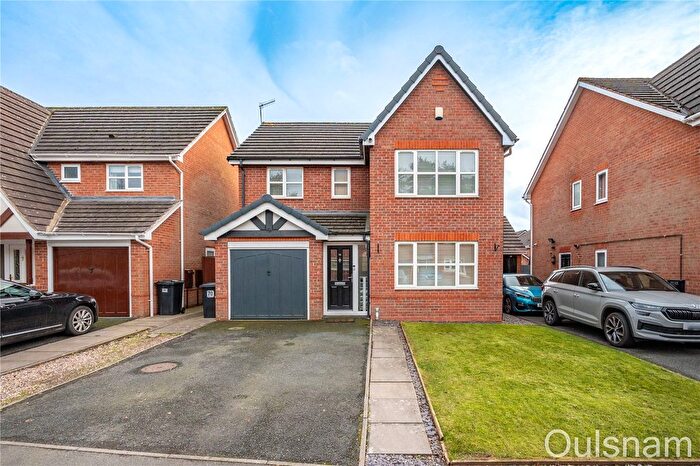
Properties for sale in Catshill
Roads and Postcodes in Catshill
Navigate through our locations to find the location of your next house in Catshill, Bromsgrove for sale or to rent.
| Streets | Postcodes |
|---|---|
| Aintree Close | B61 0LN B61 0LW |
| Alexander Close | B61 0PF |
| Ash Drive | B61 0LF |
| Beehive Close | B61 0PT |
| Birmingham Road | B61 0HY |
| Bourne Avenue | B61 0NX B61 0NZ |
| Bracken Grove | B61 0PB |
| Brookside Drive | B61 9LD |
| Chadcote Way | B61 0JT B61 0JU |
| Cheltenham Avenue | B61 0RU B61 0RX |
| Chepstow Drive | B61 0RZ |
| Church Road | B61 0JS B61 0JY |
| Churchill Road | B61 0PD B61 0PE |
| Churchstone Close | B61 9HL |
| Cobnall Road | B61 0PH B61 0PJ |
| Cowslip Close | B61 0GF |
| Crownhill Meadow | B61 9HH |
| Dale Close | B61 9HS |
| Eliza Gardens | B61 0JA |
| Epsom Road | B61 0PY |
| Ferndale Close | B61 0PR |
| Gibb Lane | B61 0JP |
| Golden Cross Lane | B61 0JZ B61 0LA B61 0LE B61 0LG |
| Green Lane | B61 0LD |
| Halesowen Road | B61 0QL |
| Haydock Road | B61 0SA |
| Hinton Fields | B61 9HR B61 9HT |
| Julian Close | B61 0LH |
| Lingfield Walk | B61 0LJ |
| Marlbrook Gardens | B61 0HN |
| Marsh Way | B61 0JD |
| Mayfield Close | B61 0NP B61 0NR |
| Meadow Road | B61 0JJ B61 0JL |
| Milton Road | B61 0NA |
| Minster Walk | B61 0JX |
| Montgomery Close | B61 0PG |
| Newbury Close | B61 0SB |
| Poplar Close | B61 0HH |
| Rocky Lane | B61 9HP |
| Sandown Drive | B61 0SD |
| Sedgefield Walk | B61 0SE |
| Shelley Close | B61 0NH B61 0NQ |
| Springs Avenue | B61 0NU |
| Stourbridge Road | B61 0BL B61 0BN B61 0BW B61 9LE B61 9LF B61 9LG B61 9LH B61 9LQ |
| Tall Trees Close | B61 0HQ |
| The Dock | B61 0NJ |
| The Meadows | B61 0NN |
| Thirsk Way | B61 0RY |
| Watercress Drive | B61 0GE |
| Westfields | B61 9HJ |
| Wildmoor Lane | B61 0NT B61 0PA B61 0PQ |
| Woodbank Drive | B61 0HG |
| Woodrow Close | B61 0NY |
| Woodrow Lane | B61 0PL B61 0PN B61 0PP B61 0PS B61 0PU B61 0PX |
Transport near Catshill
- FAQ
- Price Paid By Year
- Property Type Price
Frequently asked questions about Catshill
What is the average price for a property for sale in Catshill?
The average price for a property for sale in Catshill is £299,201. This amount is 9% lower than the average price in Bromsgrove. There are 439 property listings for sale in Catshill.
What streets have the most expensive properties for sale in Catshill?
The streets with the most expensive properties for sale in Catshill are Birmingham Road at an average of £585,000, The Meadows at an average of £540,000 and Sedgefield Walk at an average of £520,000.
What streets have the most affordable properties for sale in Catshill?
The streets with the most affordable properties for sale in Catshill are Aintree Close at an average of £125,000, Lingfield Walk at an average of £140,000 and Newbury Close at an average of £177,500.
Which train stations are available in or near Catshill?
Some of the train stations available in or near Catshill are Barnt Green, Bromsgrove and Longbridge.
Property Price Paid in Catshill by Year
The average sold property price by year was:
| Year | Average Sold Price | Price Change |
Sold Properties
|
|---|---|---|---|
| 2025 | £323,259 | 13% |
54 Properties |
| 2024 | £280,372 | -7% |
70 Properties |
| 2023 | £299,621 | 6% |
45 Properties |
| 2022 | £281,862 | 7% |
70 Properties |
| 2021 | £262,094 | 4% |
85 Properties |
| 2020 | £251,395 | -1% |
58 Properties |
| 2019 | £253,372 | 6% |
72 Properties |
| 2018 | £237,790 | 10% |
71 Properties |
| 2017 | £214,550 | 5% |
85 Properties |
| 2016 | £202,807 | -4% |
85 Properties |
| 2015 | £211,634 | 8% |
73 Properties |
| 2014 | £193,888 | 10% |
110 Properties |
| 2013 | £174,310 | 9% |
61 Properties |
| 2012 | £158,431 | -6% |
52 Properties |
| 2011 | £168,655 | -5% |
44 Properties |
| 2010 | £176,494 | -1% |
44 Properties |
| 2009 | £177,910 | -1% |
40 Properties |
| 2008 | £179,706 | -1% |
42 Properties |
| 2007 | £182,060 | 2% |
105 Properties |
| 2006 | £177,670 | 2% |
110 Properties |
| 2005 | £173,383 | 7% |
73 Properties |
| 2004 | £161,321 | 10% |
133 Properties |
| 2003 | £145,045 | 14% |
95 Properties |
| 2002 | £124,691 | 12% |
113 Properties |
| 2001 | £109,733 | -9% |
119 Properties |
| 2000 | £119,700 | 23% |
152 Properties |
| 1999 | £92,416 | 27% |
105 Properties |
| 1998 | £67,323 | 7% |
78 Properties |
| 1997 | £62,745 | -11% |
82 Properties |
| 1996 | £69,501 | 14% |
91 Properties |
| 1995 | £59,692 | - |
52 Properties |
Property Price per Property Type in Catshill
Here you can find historic sold price data in order to help with your property search.
The average Property Paid Price for specific property types in the last three years are:
| Property Type | Average Sold Price | Sold Properties |
|---|---|---|
| Semi Detached House | £283,202.00 | 47 Semi Detached Houses |
| Detached House | £410,360.00 | 61 Detached Houses |
| Terraced House | £213,623.00 | 53 Terraced Houses |
| Flat | £112,562.00 | 8 Flats |

