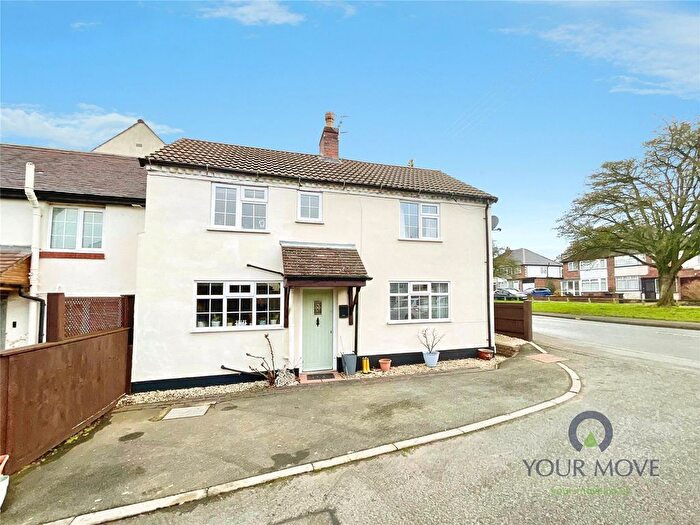
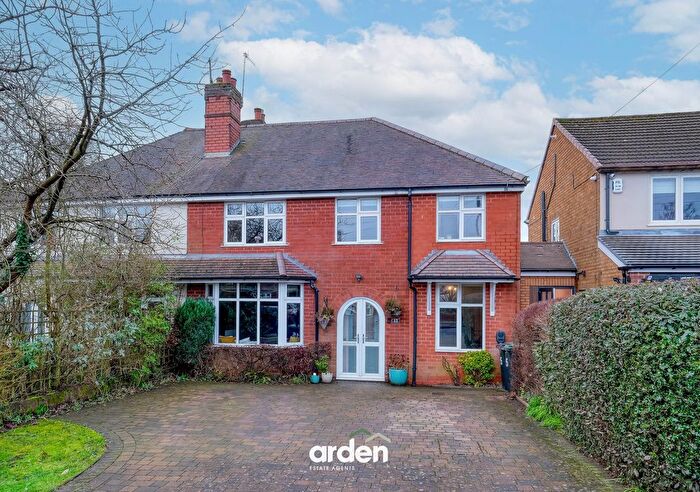
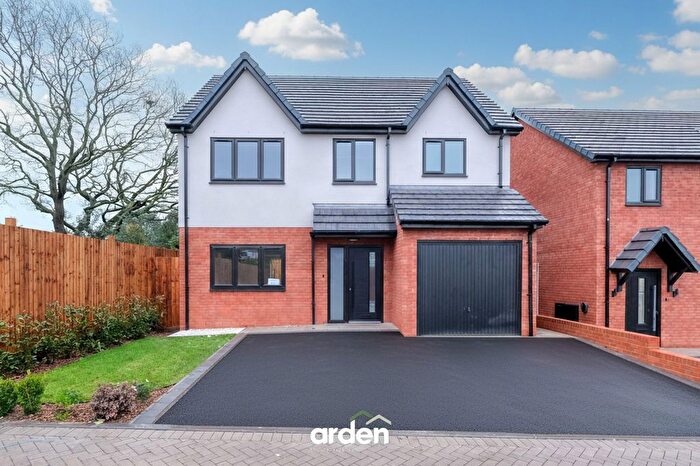
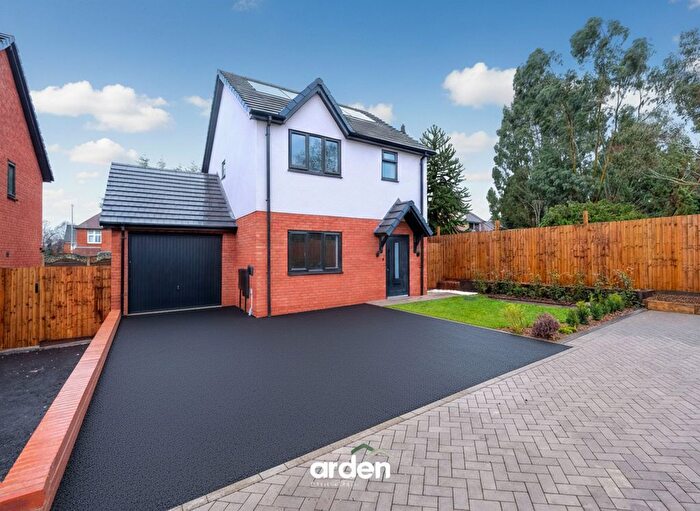
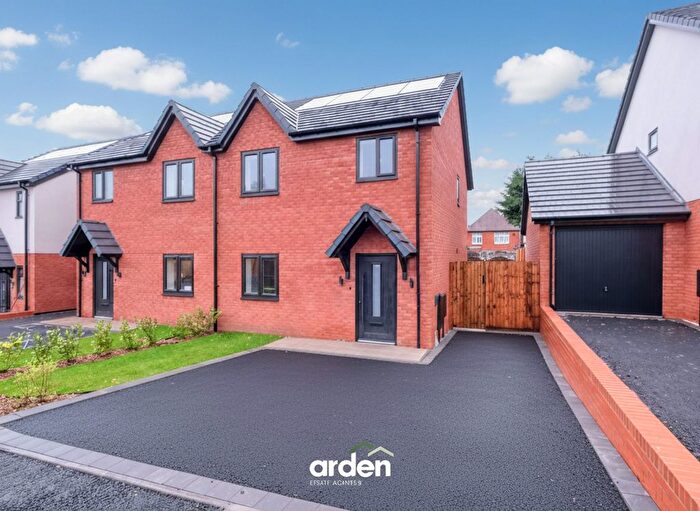
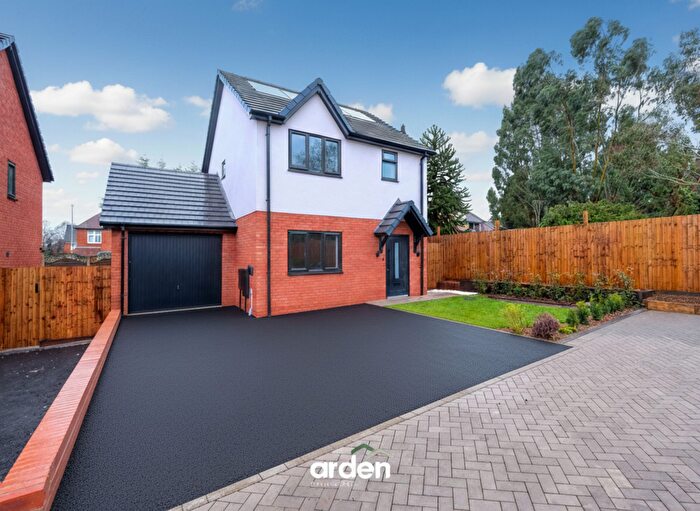
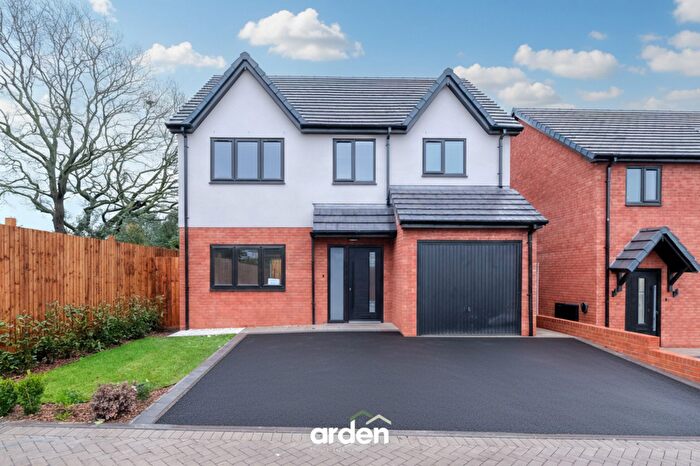
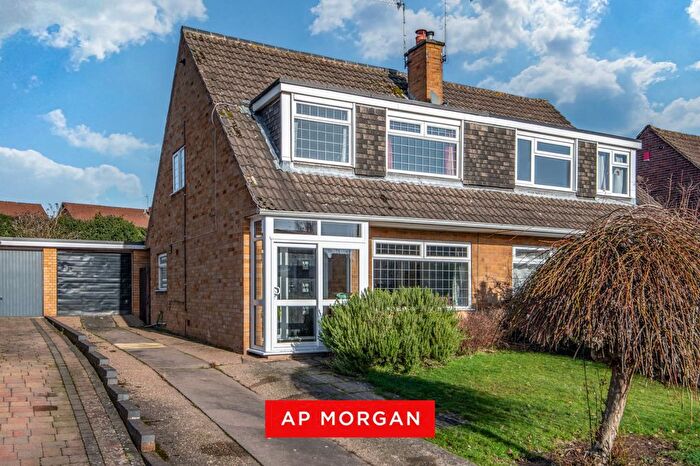
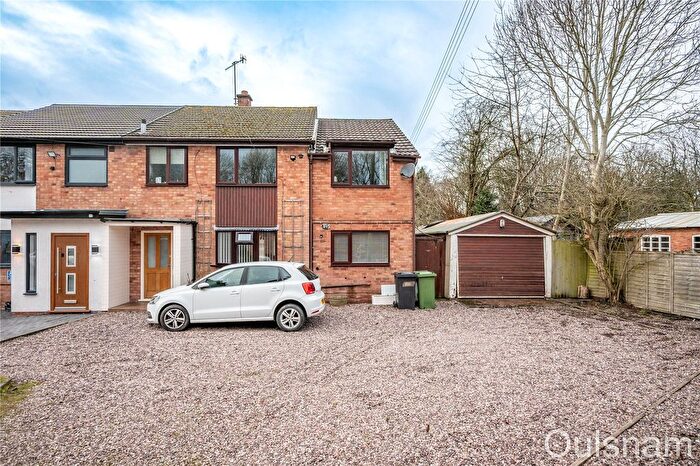
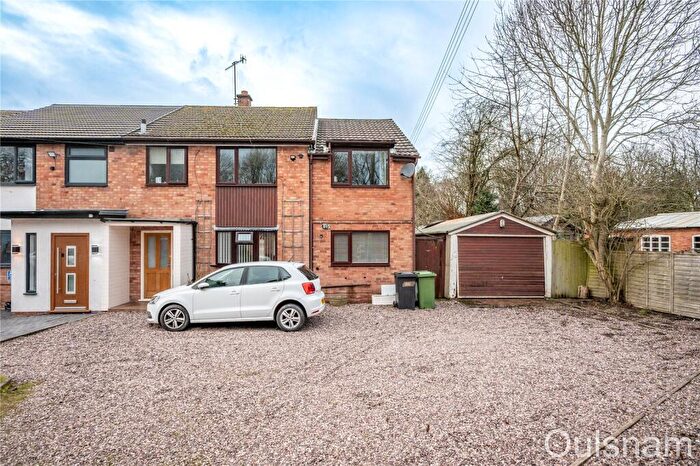
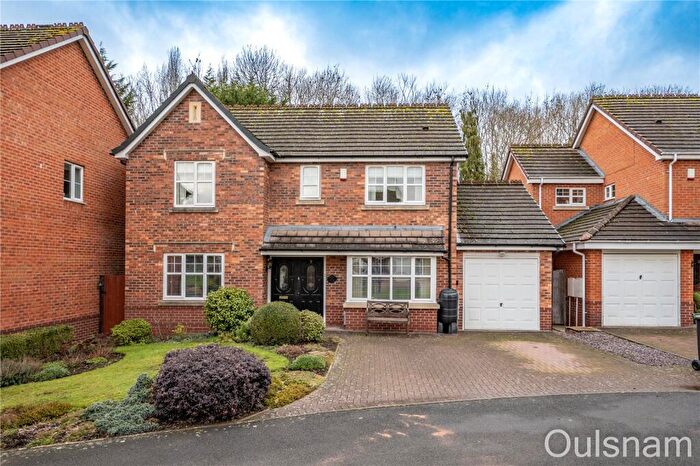
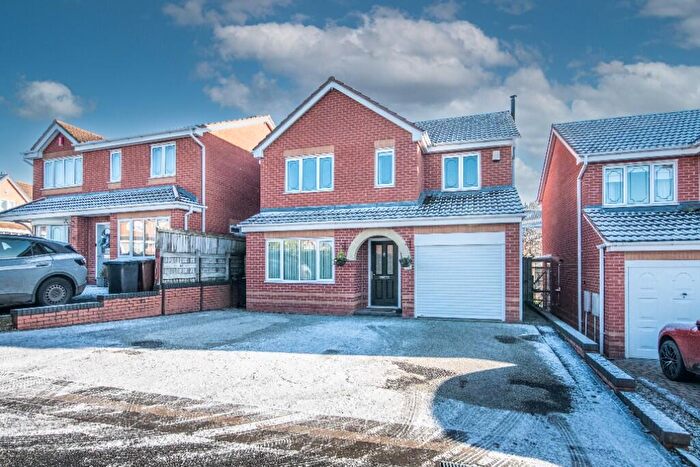
Houses for sale & to rent in Marlbrook, Bromsgrove
House Prices in Marlbrook
Properties in Marlbrook have an average house price of £367,621.00 and had 175 Property Transactions within the last 3 years¹.
Marlbrook is an area in Bromsgrove, Worcestershire with 1,753 households², where the most expensive property was sold for £1,250,000.00.
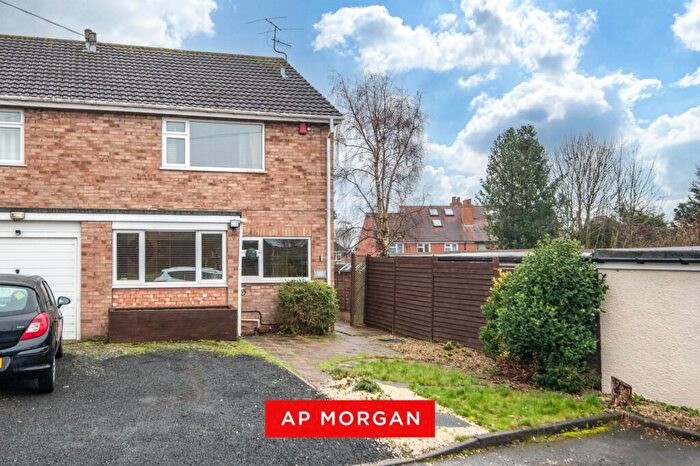
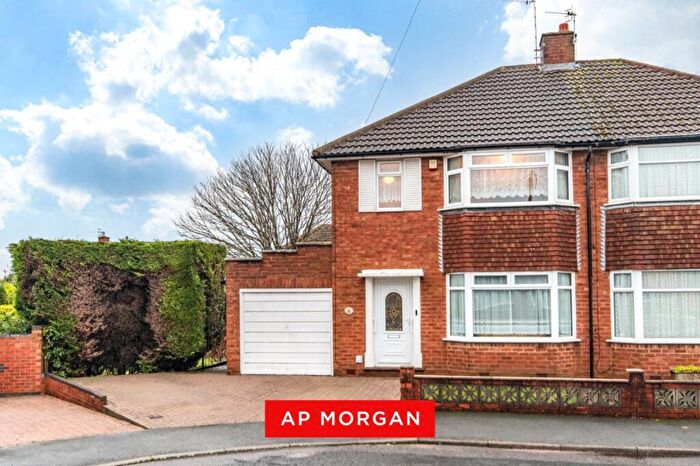
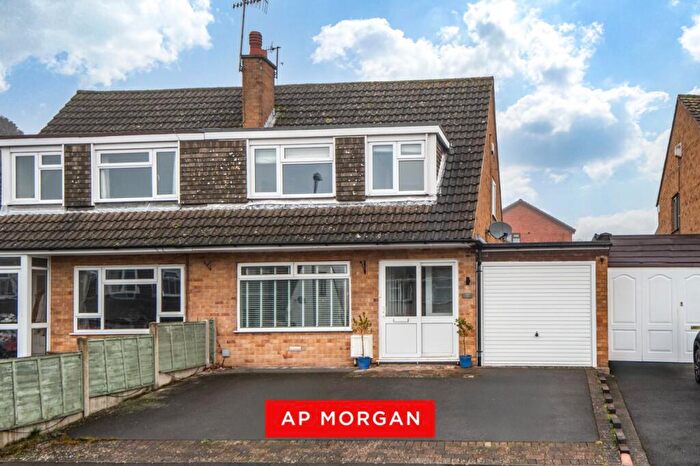
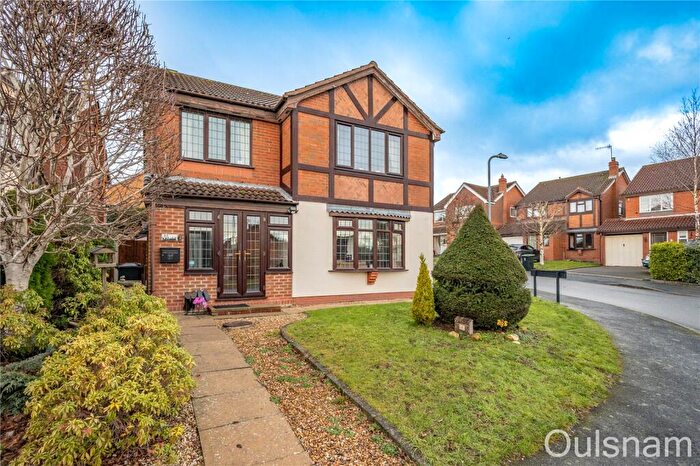
Properties for sale in Marlbrook
Roads and Postcodes in Marlbrook
Navigate through our locations to find the location of your next house in Marlbrook, Bromsgrove for sale or to rent.
| Streets | Postcodes |
|---|---|
| Acorn Road | B61 0TR |
| Alvechurch Highway | B60 1PA |
| Ashgrove Close | B60 1HW |
| Barley Mow Lane | B61 0LP B61 0LU B61 0LY |
| Beaumont Lawns | B60 1HZ |
| Belle Vue Close | B61 0JQ |
| Birmingham Road | B61 0HJ B61 0HL B61 0HR B61 0HS B61 0HT B61 0HX B61 0HZ |
| Braces Lane | B60 1DX B60 1DY B60 1ED |
| Brook Fields Close | B60 1EP |
| Byron Way | B61 0NB B61 0ND |
| Catkins Close | B61 0TT |
| Cavendish Close | B60 1EE |
| Cottage Drive | B60 1DN |
| Cottage Farm Lane | B60 1EA |
| Cottage Lane | B60 1DP B60 1DT B60 1DU B60 1DW |
| Firs Close | B60 1DR |
| Four Oaks Drive | B61 0SF |
| Foxtail Place | B61 0FL |
| Golden Cross Lane | B61 0LQ |
| Green Slade Crescent | B60 1DS |
| Greendale Close | B61 0LR |
| Greenfield Avenue | B60 1HE |
| Halesowen Road | B61 0QJ |
| Haynes Close | B61 0LX |
| Hazelton Close | B61 0JF |
| Hazelton Road | B61 0JE B61 0JG |
| Herbert Austin Drive | B60 1RA |
| Kestrel View | B60 1DB |
| Lickey Grange | B60 1NP |
| Lickey Grange Drive | B60 1RD |
| Lickey Rock | B60 1HF |
| Linehouse Lane | B60 1HR B60 1HS |
| Lord Austin Drive | B60 1RB |
| Marlbrook Lane | B60 1HN B60 1HP |
| Marlbrook Rise | B61 0HW |
| Marlgrove Court | B61 0HE |
| Merrill Gardens | B60 1JA |
| Middle House Drive | B60 1HB |
| Milton Road | B61 0NG |
| Oak Apple Road | B61 0TS |
| Oak Road | B61 0LS B61 0LT |
| Old Birmingham Road | B60 1DD B60 1DE B60 1DF B60 1DG B60 1DH B60 1DQ B60 1HG B60 1HH B60 1HL B60 1HQ B60 1NR B60 1DL B60 1NS B60 1NT |
| Redland Close | B60 1DZ |
| Severn Close | B61 0LL |
| Spenser Walk | B61 0NE B61 0NF |
| Staple Flat | B60 1HD |
| The Acorns | B61 0LB |
| The Brambles | B61 0JH |
| West View | B60 1JB |
Transport near Marlbrook
- FAQ
- Price Paid By Year
- Property Type Price
Frequently asked questions about Marlbrook
What is the average price for a property for sale in Marlbrook?
The average price for a property for sale in Marlbrook is £367,621. This amount is 11% higher than the average price in Bromsgrove. There are 411 property listings for sale in Marlbrook.
What streets have the most expensive properties for sale in Marlbrook?
The streets with the most expensive properties for sale in Marlbrook are Lickey Grange at an average of £975,000, Lord Austin Drive at an average of £756,500 and Hazelton Road at an average of £514,714.
What streets have the most affordable properties for sale in Marlbrook?
The streets with the most affordable properties for sale in Marlbrook are Catkins Close at an average of £119,331, Byron Way at an average of £168,050 and Spenser Walk at an average of £196,250.
Which train stations are available in or near Marlbrook?
Some of the train stations available in or near Marlbrook are Barnt Green, Bromsgrove and Longbridge.
Property Price Paid in Marlbrook by Year
The average sold property price by year was:
| Year | Average Sold Price | Price Change |
Sold Properties
|
|---|---|---|---|
| 2025 | £363,479 | 0,4% |
50 Properties |
| 2024 | £362,009 | -4% |
55 Properties |
| 2023 | £374,989 | 2% |
70 Properties |
| 2022 | £367,886 | -4% |
55 Properties |
| 2021 | £384,253 | 7% |
94 Properties |
| 2020 | £357,488 | 16% |
58 Properties |
| 2019 | £298,583 | 4% |
52 Properties |
| 2018 | £287,303 | 3% |
65 Properties |
| 2017 | £279,465 | 2% |
79 Properties |
| 2016 | £272,726 | 12% |
78 Properties |
| 2015 | £239,265 | -2% |
70 Properties |
| 2014 | £244,280 | 4% |
76 Properties |
| 2013 | £235,721 | 9% |
64 Properties |
| 2012 | £215,425 | 1% |
44 Properties |
| 2011 | £213,497 | -15% |
57 Properties |
| 2010 | £246,257 | 22% |
52 Properties |
| 2009 | £191,188 | -3% |
39 Properties |
| 2008 | £197,204 | -15% |
45 Properties |
| 2007 | £226,097 | 2% |
72 Properties |
| 2006 | £221,344 | 4% |
99 Properties |
| 2005 | £212,110 | 4% |
83 Properties |
| 2004 | £203,818 | 21% |
96 Properties |
| 2003 | £160,664 | 7% |
58 Properties |
| 2002 | £149,482 | 14% |
67 Properties |
| 2001 | £129,270 | 1% |
89 Properties |
| 2000 | £128,512 | -21% |
66 Properties |
| 1999 | £155,512 | 15% |
95 Properties |
| 1998 | £131,932 | 34% |
94 Properties |
| 1997 | £86,524 | 4% |
59 Properties |
| 1996 | £82,743 | -2% |
61 Properties |
| 1995 | £84,531 | - |
53 Properties |
Property Price per Property Type in Marlbrook
Here you can find historic sold price data in order to help with your property search.
The average Property Paid Price for specific property types in the last three years are:
| Property Type | Average Sold Price | Sold Properties |
|---|---|---|
| Semi Detached House | £323,793.00 | 53 Semi Detached Houses |
| Detached House | £487,930.00 | 75 Detached Houses |
| Terraced House | £240,592.00 | 32 Terraced Houses |
| Flat | £191,929.00 | 15 Flats |

