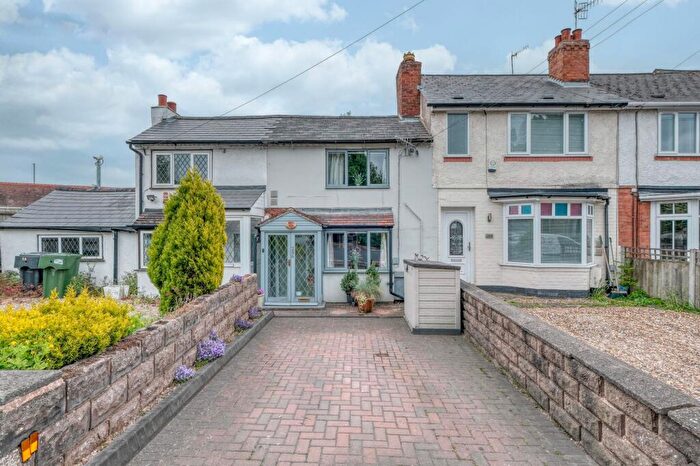
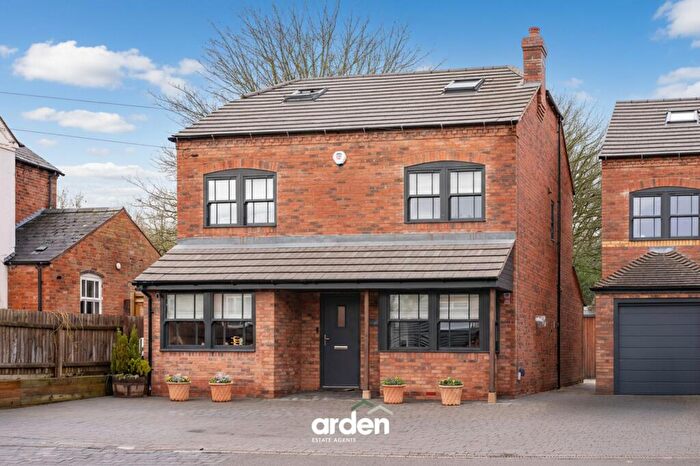
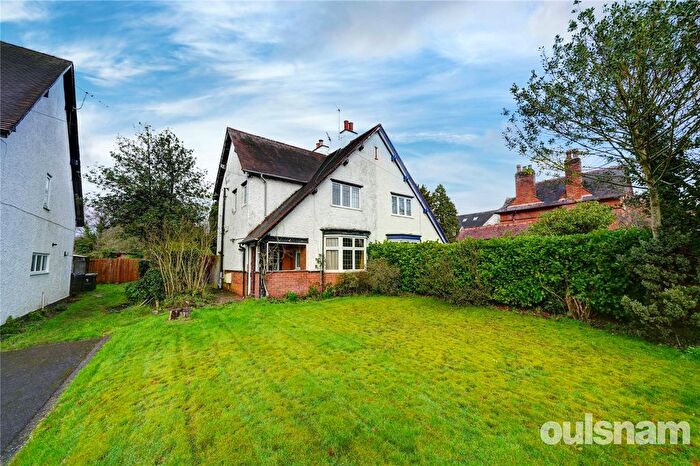
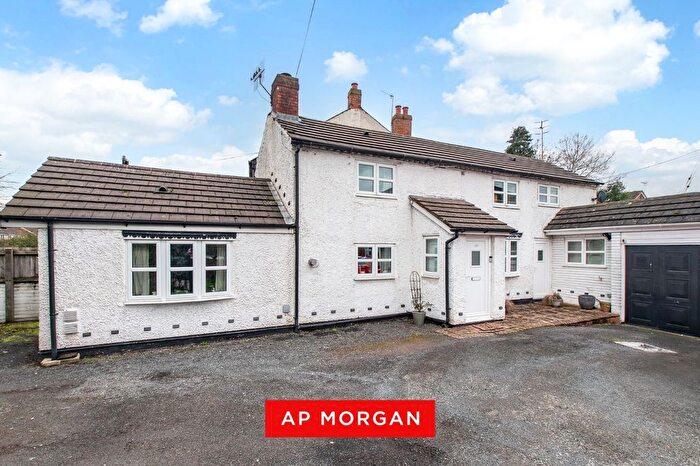
Houses for sale & to rent in Linthurst, Bromsgrove
House Prices in Linthurst
Properties in Linthurst have an average house price of £502,134.00 and had 47 Property Transactions within the last 3 years¹.
Linthurst is an area in Bromsgrove, Worcestershire with 625 households², where the most expensive property was sold for £990,000.00.
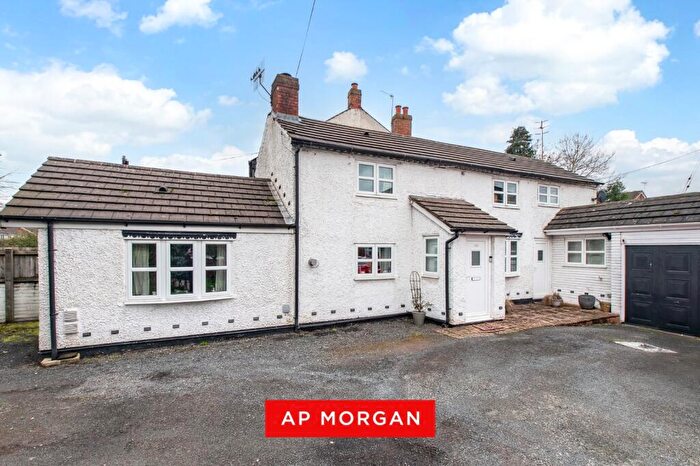
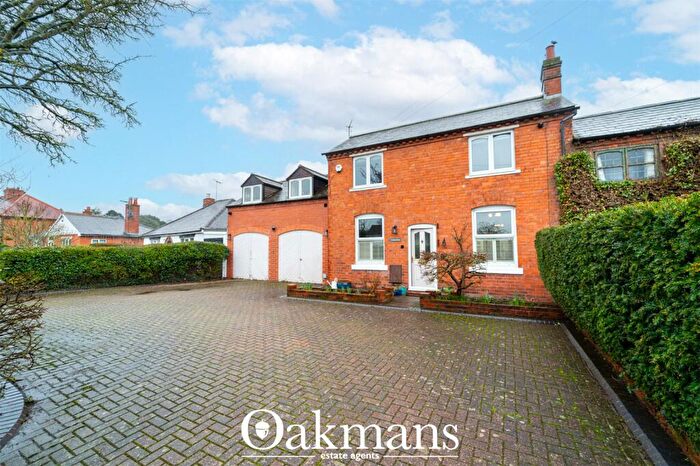
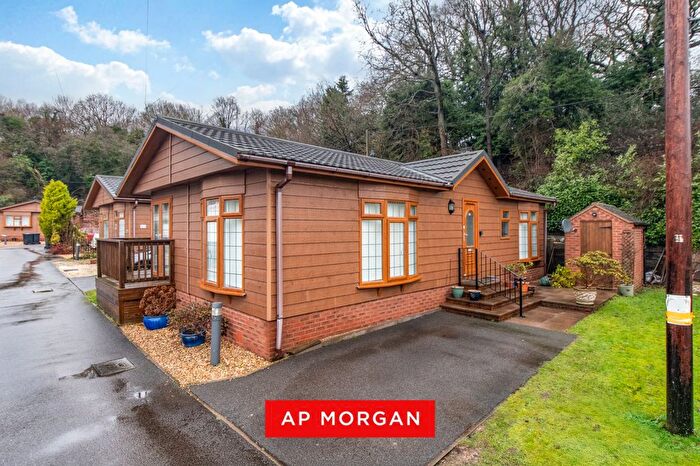
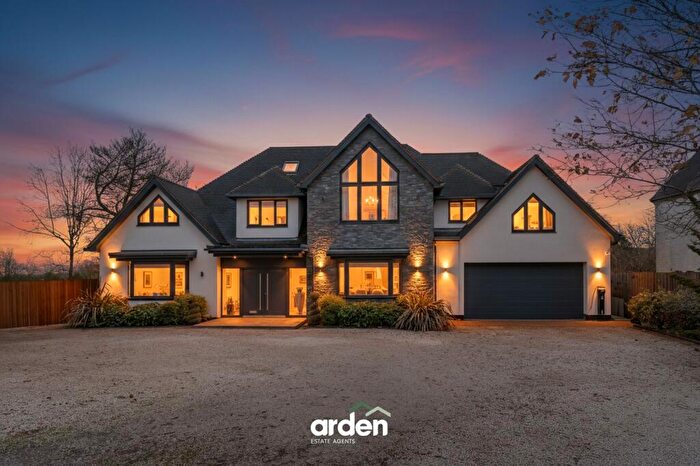
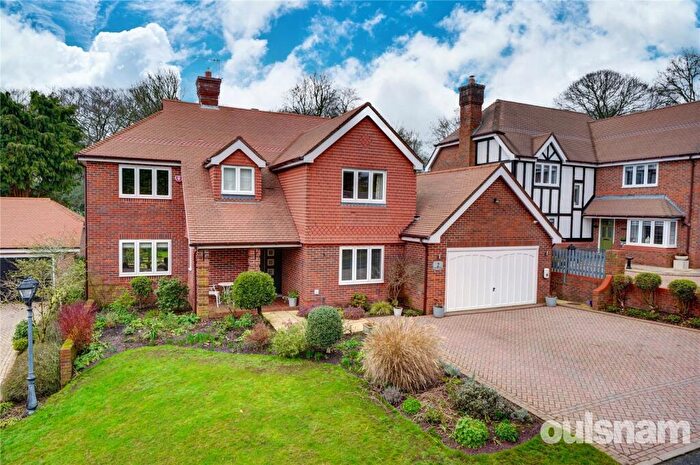
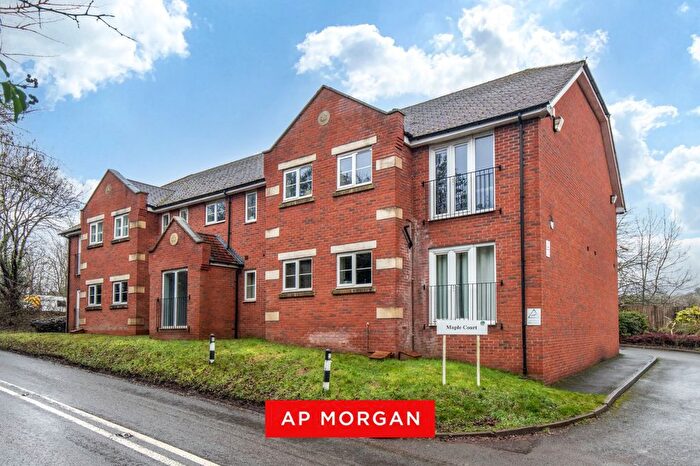
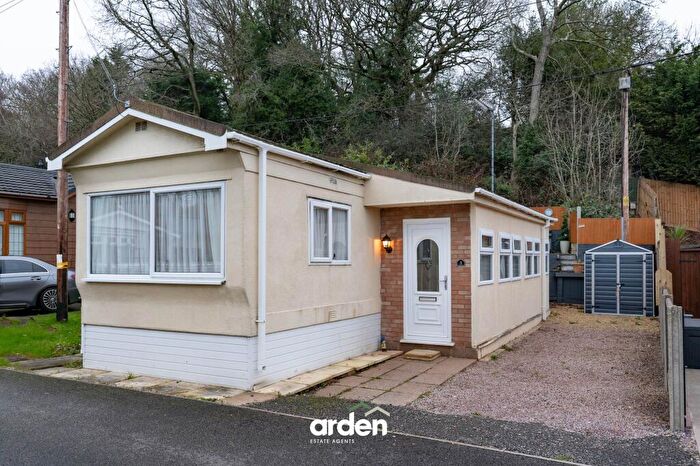
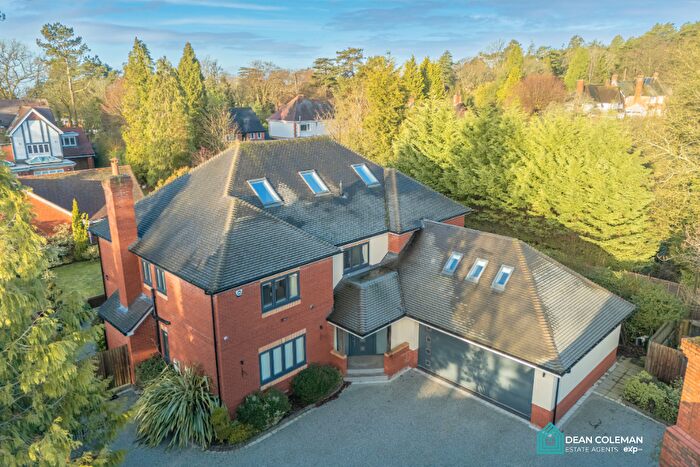
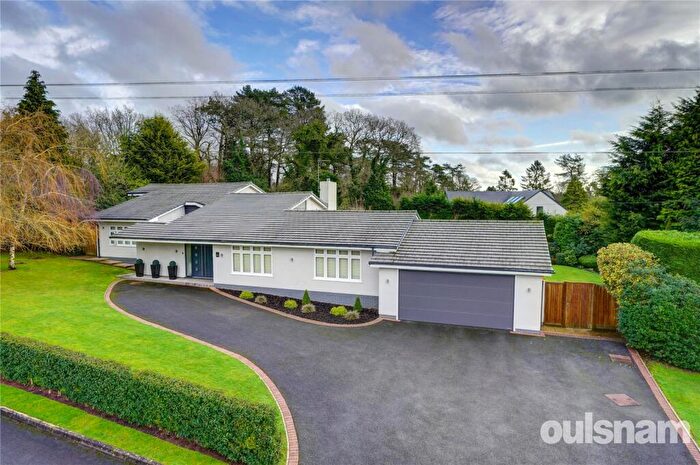
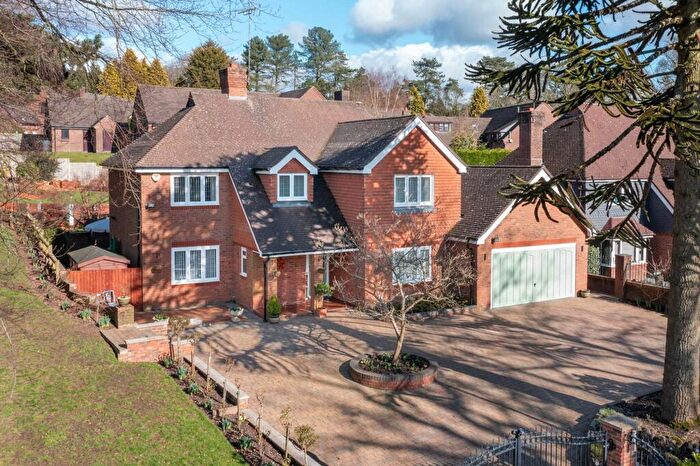
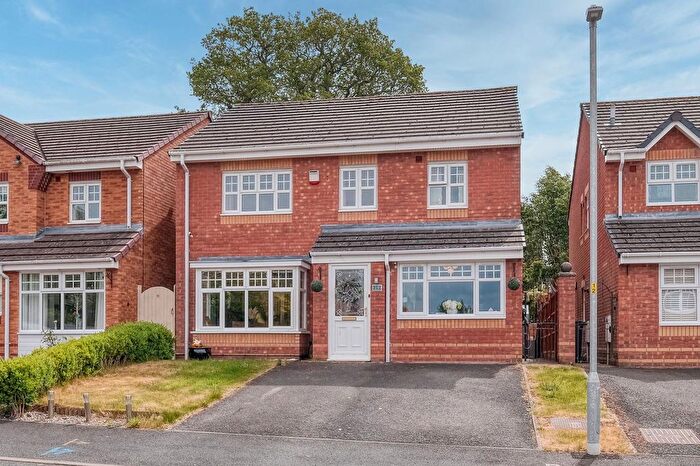
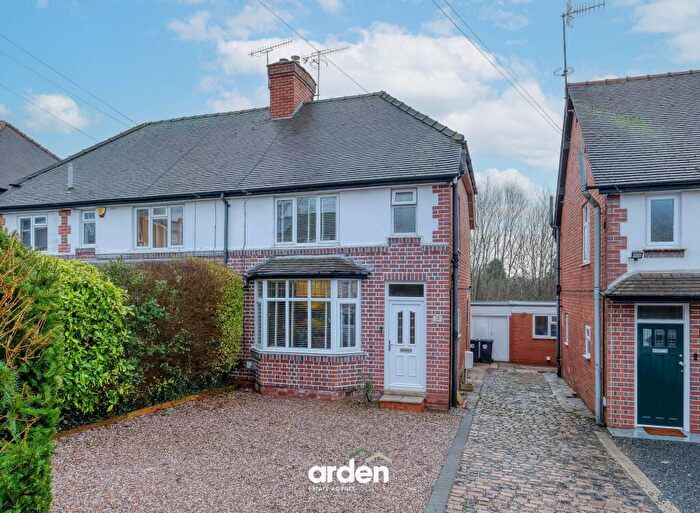
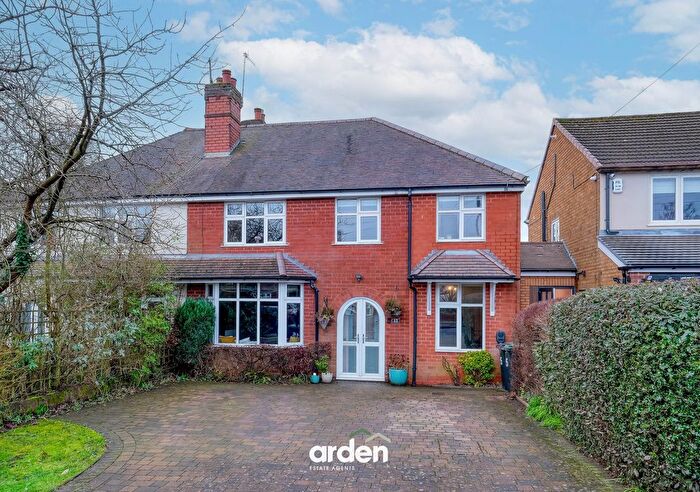
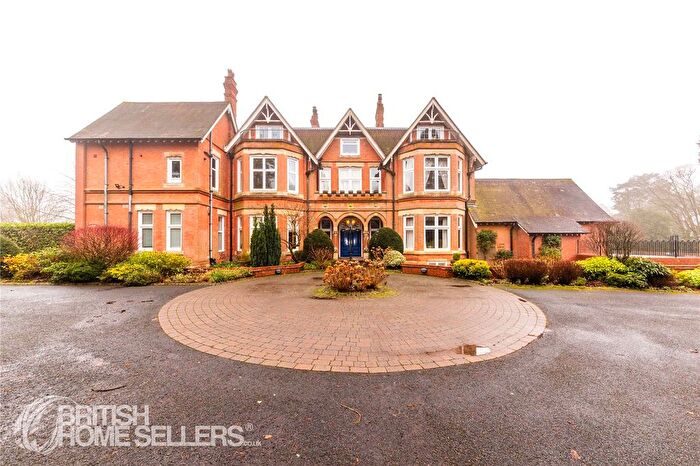
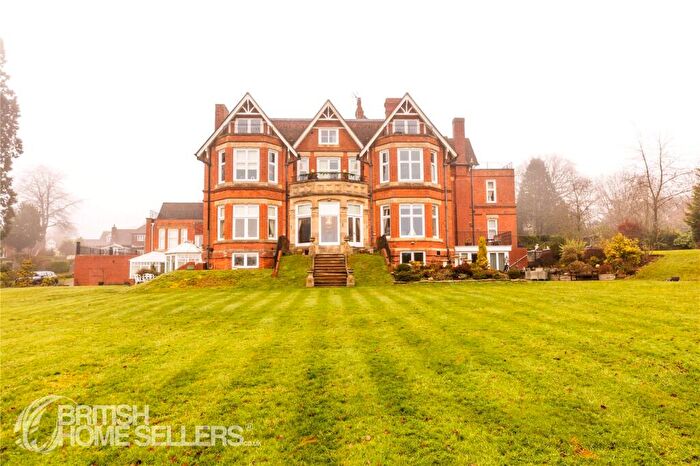
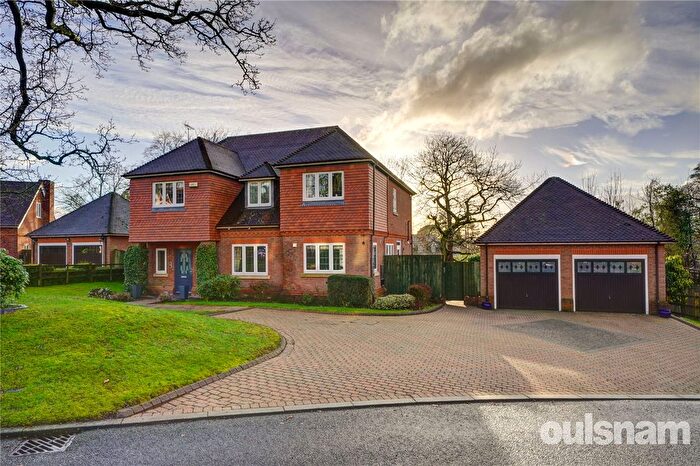
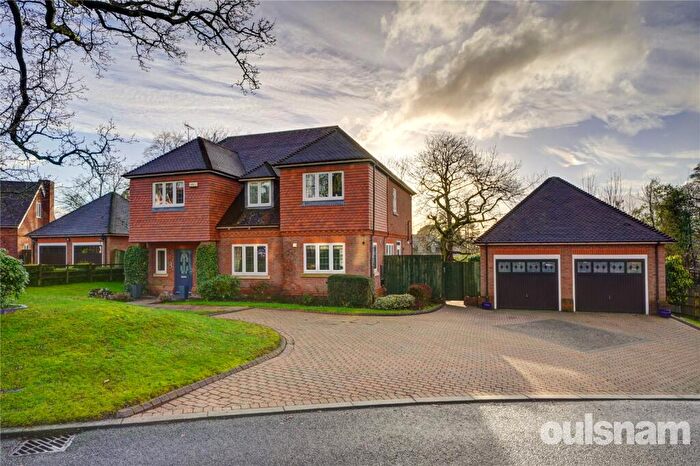
Properties for sale in Linthurst
Roads and Postcodes in Linthurst
Navigate through our locations to find the location of your next house in Linthurst, Bromsgrove for sale or to rent.
| Streets | Postcodes |
|---|---|
| Alcester Road | B60 1BH B60 1BQ B60 1PJ B60 1PN B60 1PP B60 1PW |
| Badger Way | B60 1EX |
| Billy Lane | B60 1QL |
| Birkdale Avenue | B60 1BY |
| Brookhouse Road | B60 1QP |
| Burcot Lane | B60 1PH |
| Cornmill Gardens | B60 1QU |
| Dale Hill | B60 1QJ |
| Dale Lane | B60 1GZ |
| Fairways Drive | B60 1BB |
| Ferndale Gate | B60 1GY |
| Foxes Close | B60 1EY |
| Gleneagles Drive | B60 1BD |
| Greenhill | B60 1BJ B60 1BL |
| Kimbolton Drive | B60 1QF |
| Laurel Bank Mews | B60 1PD |
| Linthurst Newtown | B60 1BP B60 1BS |
| Linthurst Road | B60 1QG B60 1QH |
| Lower Shepley Lane | B60 1HX |
| Pikes Pool Lane | B60 1LH B60 1LJ |
| Pumphouse Lane | B60 1QN |
| Spirehouse Lane | B60 1QE |
| St Catherines Close | B60 1BG |
| St Catherines Coppice | B60 1FD |
| St Catherines Road | B60 1BN |
| Station Road | B60 1PZ B60 1QB |
| Tanglewood Close | B60 1BU |
| The Avenue | B60 1BW |
| Wentworth Drive | B60 1BE |
| Woodcroft Close | B60 1DA |
Transport near Linthurst
- FAQ
- Price Paid By Year
- Property Type Price
Frequently asked questions about Linthurst
What is the average price for a property for sale in Linthurst?
The average price for a property for sale in Linthurst is £502,134. This amount is 52% higher than the average price in Bromsgrove. There are 689 property listings for sale in Linthurst.
What streets have the most expensive properties for sale in Linthurst?
The streets with the most expensive properties for sale in Linthurst are Ferndale Gate at an average of £990,000, Pikes Pool Lane at an average of £895,000 and Lower Shepley Lane at an average of £802,500.
What streets have the most affordable properties for sale in Linthurst?
The streets with the most affordable properties for sale in Linthurst are Laurel Bank Mews at an average of £175,916, Badger Way at an average of £408,000 and Alcester Road at an average of £470,000.
Which train stations are available in or near Linthurst?
Some of the train stations available in or near Linthurst are Barnt Green, Alvechurch and Bromsgrove.
Property Price Paid in Linthurst by Year
The average sold property price by year was:
| Year | Average Sold Price | Price Change |
Sold Properties
|
|---|---|---|---|
| 2025 | £608,450 | 11% |
10 Properties |
| 2024 | £539,714 | 20% |
14 Properties |
| 2023 | £433,034 | -35% |
23 Properties |
| 2022 | £585,164 | 15% |
27 Properties |
| 2021 | £498,189 | -18% |
37 Properties |
| 2020 | £587,604 | 17% |
26 Properties |
| 2019 | £489,997 | 8% |
20 Properties |
| 2018 | £449,444 | 0,4% |
28 Properties |
| 2017 | £447,736 | 4% |
36 Properties |
| 2016 | £428,679 | -2% |
29 Properties |
| 2015 | £436,596 | 13% |
27 Properties |
| 2014 | £378,138 | 13% |
26 Properties |
| 2013 | £328,257 | -11% |
26 Properties |
| 2012 | £363,960 | -13% |
27 Properties |
| 2011 | £411,872 | 29% |
24 Properties |
| 2010 | £292,410 | -15% |
19 Properties |
| 2009 | £336,861 | 3% |
18 Properties |
| 2008 | £328,095 | -19% |
22 Properties |
| 2007 | £389,876 | 2% |
39 Properties |
| 2006 | £381,061 | 18% |
31 Properties |
| 2005 | £311,590 | 20% |
27 Properties |
| 2004 | £247,907 | -4% |
35 Properties |
| 2003 | £258,709 | 7% |
32 Properties |
| 2002 | £240,184 | 19% |
55 Properties |
| 2001 | £195,066 | 12% |
47 Properties |
| 2000 | £171,201 | -3% |
38 Properties |
| 1999 | £176,247 | 18% |
43 Properties |
| 1998 | £144,777 | 13% |
44 Properties |
| 1997 | £125,669 | 2% |
36 Properties |
| 1996 | £122,868 | 22% |
27 Properties |
| 1995 | £95,511 | - |
40 Properties |
Property Price per Property Type in Linthurst
Here you can find historic sold price data in order to help with your property search.
The average Property Paid Price for specific property types in the last three years are:
| Property Type | Average Sold Price | Sold Properties |
|---|---|---|
| Semi Detached House | £432,200.00 | 5 Semi Detached Houses |
| Detached House | £581,250.00 | 34 Detached Houses |
| Terraced House | £245,760.00 | 5 Terraced Houses |
| Flat | £149,333.00 | 3 Flats |

